|
NOAA monitors meteorological conditions and ozone amounts in the
stratosphere. On this page we present graphics to aid in visualizing the evolution of the South Polar "ozone hole" and factors important
for ozone depletion in the polar areas. Several other web pages (see
links) discuss the processes of ozone depletion. Here we provide information on the
size of the polar vortex, the size of the ozone hole, the size of the area where air is cold enough to
form Polar Stratospheric Clouds (PSCs), and which parts
of this cold air are sunlit such that photo-chemical ozone depletion processes can occur.
In addition, the latitudinal-time cross sections shows the thermal evolution at all latitudes.
 Ozone
Hole Size Ozone
Hole Size
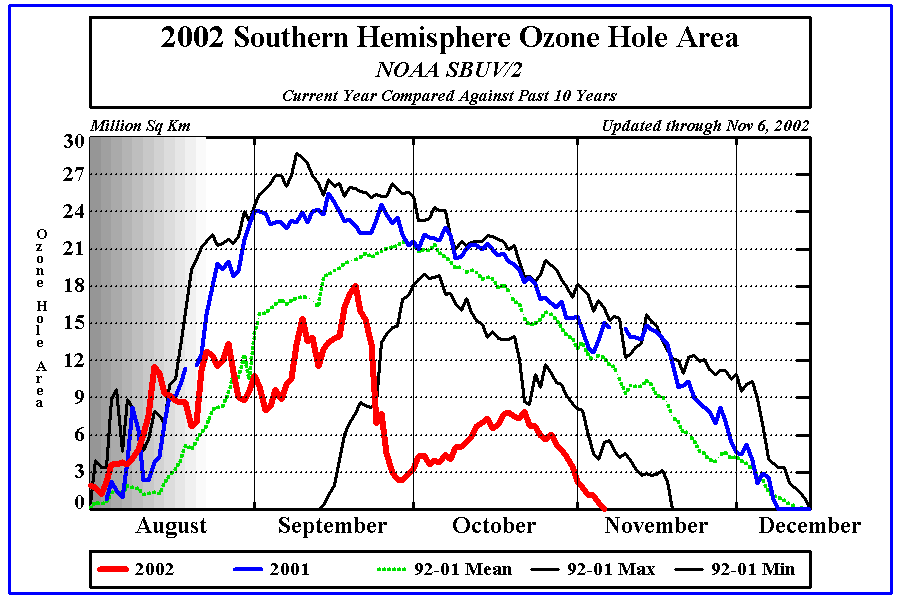
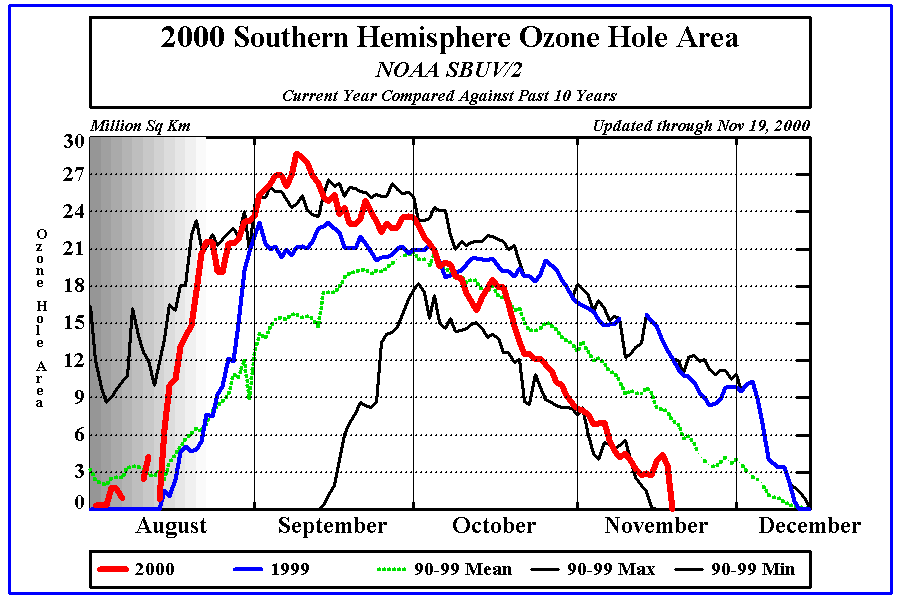
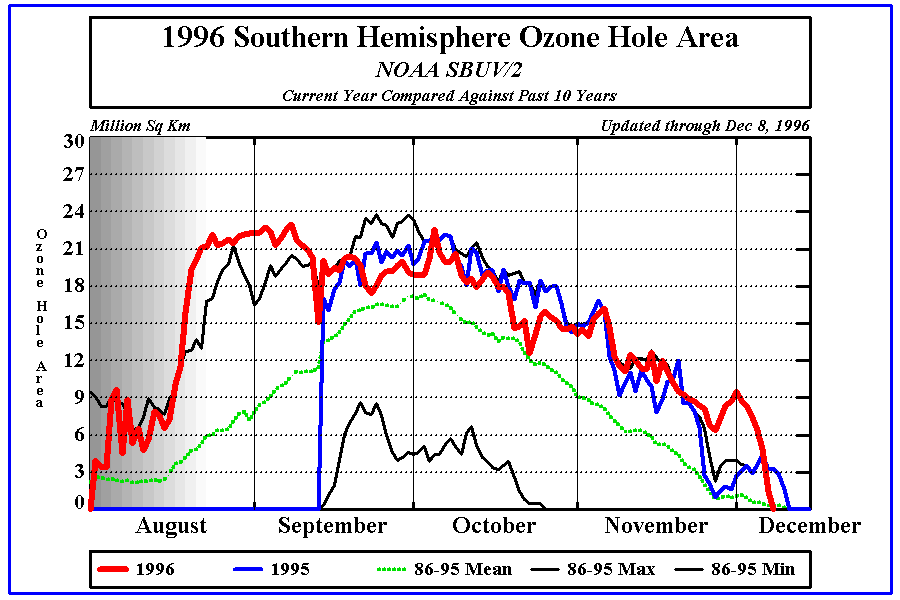
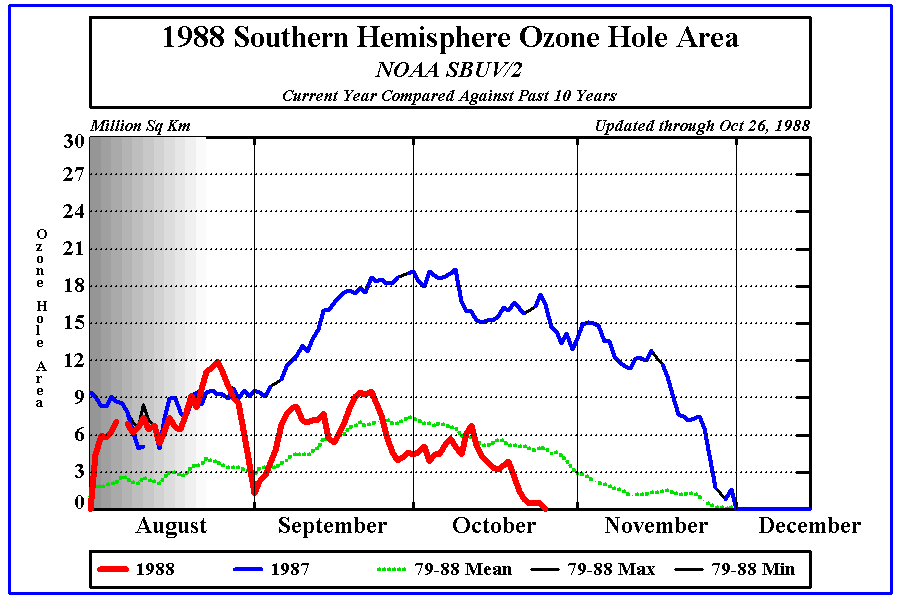
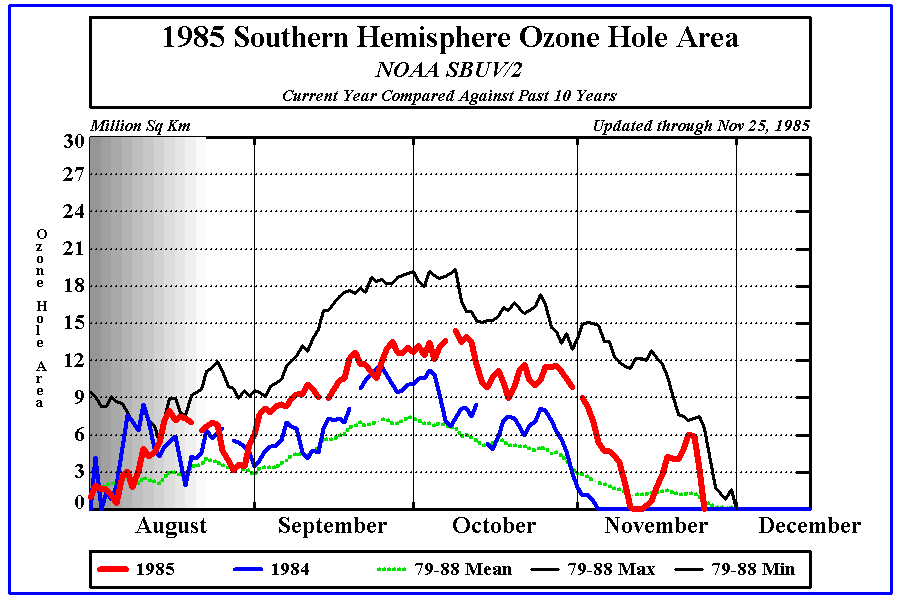
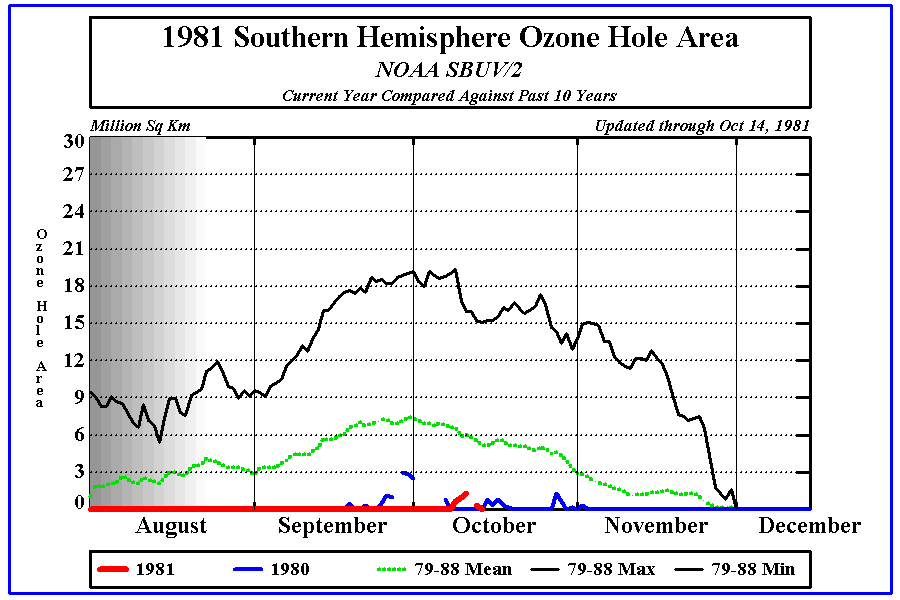
This figure shows the progress of the size of the ozone hole in comparison to other years.
For more information about this graph go to the
ozone hole web page.
Ozone hole size for previous years:
2008, 2007,
2006, 2005,
2004, 2003,
2002, 2001,
2000, 1999,
1998, 1997,
1996, 1995,
1994, 1993,
1992, 1991,
1990, 1989,
1988, 1987,
1986, 1985,
1984, 1983,
1982, 1981,
1980-79
 Southern
Hemisphere SBUV/2 Total Ozone Analysis Southern
Hemisphere SBUV/2 Total Ozone Analysis
This map shows the most recent analayis of the Southern Hemsisphere total ozone from the Solar
Backscattering UltraViolet (SBUV/2) instrument on board the
NOAA polar orbiting satellite. In austral spring the analysis shows the "ozone
hole" (values below 220 Dobson Units)over Antarctica and the Antarctic Ocean. This
area of low ozone is confined by the polar vortex. Usually circular in August and
September, the vortex tends to elongate in October, stretching towards inhabited areas of
South America. By November, the polar vortex begins to weaken and ozone rich air begins to
mix with the air in the "ozone hole" region. The "ozone hole" is
usually gone by late November/early December.
The SBUV/2 instrument can not make
observations in the polar night region because it relies upon bascscattered sun light. The blackened area centered over the pole
represents the latitudes in which no observations can be made.
 South
Polar Vertical Ozone Profile South
Polar Vertical Ozone Profile
This figure shows the vertical profile of ozone over the South Pole when the "ozone
hole" becomes well established. Nearly complete ozone depletion occurs between
13 km and 23 km, where extremely low temperatures support the heterogeneous photo-chemical destruction of
ozone. But, above and below these heights the air temperature is not low enough for this type
of ozone destruction, and ozone amounts remain virtually unchanged. The most recent ozone
soundings from the South Pole are available from NOAA's Earth System Research Laboratory - Global
Monitoring Division.
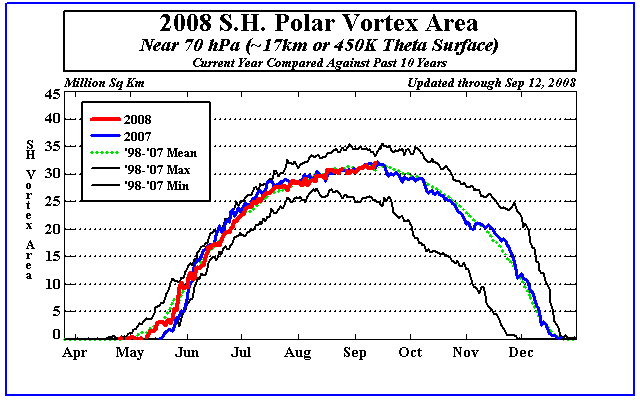
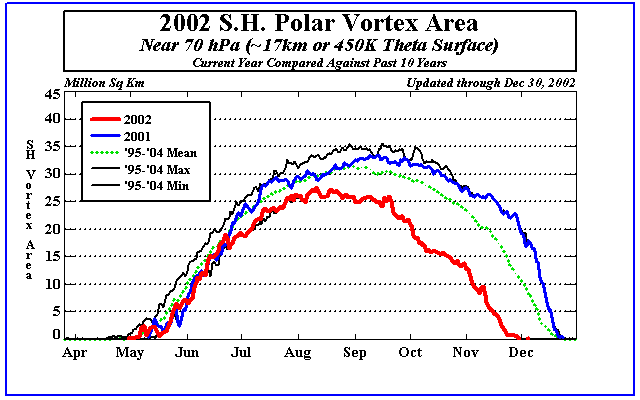
 Time series of the
size of the S.H. polar vortex at 450K. Air parcels
move on isentropic surfaces (surfaces of equal potential temperature) rather than pressure
surfaces. The 450 K surface in the south polar area lies between the 70 mb and 50 mb
pressure surfaces. This is near the altitude where ozone is in greatest abundance in
the vertical profile. This figure shows the size of the polar vortex with respect to previous years.
The polar vortex defines the area in which cold polar air is trapped by the very
strong winds of the Polar Night Jet. During the winter/spring period, when the polar
vortex is strongest, air outside of the vortex can not enter.
So, because the warm air from the mid latitudes can not mix with the cold polar
air, the polar air continues to get colder due to radiative loss of heat. Also, when ozone
in the vortex is depleted, it is not replenished with ozone rich air from outside the
vortex. Not until mid to late Spring does the polar vortex weaken and eventually break
down. After this, thorough mixing occurs and ozone amounts are replenished. Time series of the
size of the S.H. polar vortex at 450K. Air parcels
move on isentropic surfaces (surfaces of equal potential temperature) rather than pressure
surfaces. The 450 K surface in the south polar area lies between the 70 mb and 50 mb
pressure surfaces. This is near the altitude where ozone is in greatest abundance in
the vertical profile. This figure shows the size of the polar vortex with respect to previous years.
The polar vortex defines the area in which cold polar air is trapped by the very
strong winds of the Polar Night Jet. During the winter/spring period, when the polar
vortex is strongest, air outside of the vortex can not enter.
So, because the warm air from the mid latitudes can not mix with the cold polar
air, the polar air continues to get colder due to radiative loss of heat. Also, when ozone
in the vortex is depleted, it is not replenished with ozone rich air from outside the
vortex. Not until mid to late Spring does the polar vortex weaken and eventually break
down. After this, thorough mixing occurs and ozone amounts are replenished.
Previous years: 2008,
2007, 2006,
2005, 2004,
2003, 2002,
2001
Time series of the
size of the S.H. polar vortex at 550K.
surfaces. The 550 K surface in the south polar area lies between the 50 mb and 30 mb
pressure surfaces. This is near or slightly above the altitude where ozone is in greatest abundance in
the vertical profile. See the Vortex area at 450 K for more information.
Previous years: 2008,
2007, 2006,
2005
Time series of the
size of the S.H. polar vortex at 650K.
surfaces. The 650 K surface in the south polar area lies between the 30 mb and 20 mb
pressure surfaces. This is above the altitude where ozone is in greatest abundance in
the vertical profile. See the Vortex area at 450 K for more information.
Previous years: 2008,
2007, 2006,
2005
 Time series of the
size of the air colder than -78C (PSC-1) at 450K.
This figure shows the area within the polar vortex that has temperatures low enough to
form Polar Stratospheric Clouds (PSCs). The ice crystals that make up these PSCs are where
heterogeneous photo-chemical destruction of ozone take place. So as the area of low
temperatures becomes larger, there is greater liklihood of PSCs forming. When this area
becomes sunlit, enhanced ozone distruction takes place. Time series of the
size of the air colder than -78C (PSC-1) at 450K.
This figure shows the area within the polar vortex that has temperatures low enough to
form Polar Stratospheric Clouds (PSCs). The ice crystals that make up these PSCs are where
heterogeneous photo-chemical destruction of ozone take place. So as the area of low
temperatures becomes larger, there is greater liklihood of PSCs forming. When this area
becomes sunlit, enhanced ozone distruction takes place.
Previous years: 2008,
2007,
2006, 2005,
2004, 2003,
2002, 2001
 Map of
temperature field at 50 mb for the past seven days. These maps shows where the very
cold polar air is that will support the formation of Polar Stratospheric Clouds and the
photo-chemical distruction of ozone. Map of
temperature field at 50 mb for the past seven days. These maps shows where the very
cold polar air is that will support the formation of Polar Stratospheric Clouds and the
photo-chemical distruction of ozone.
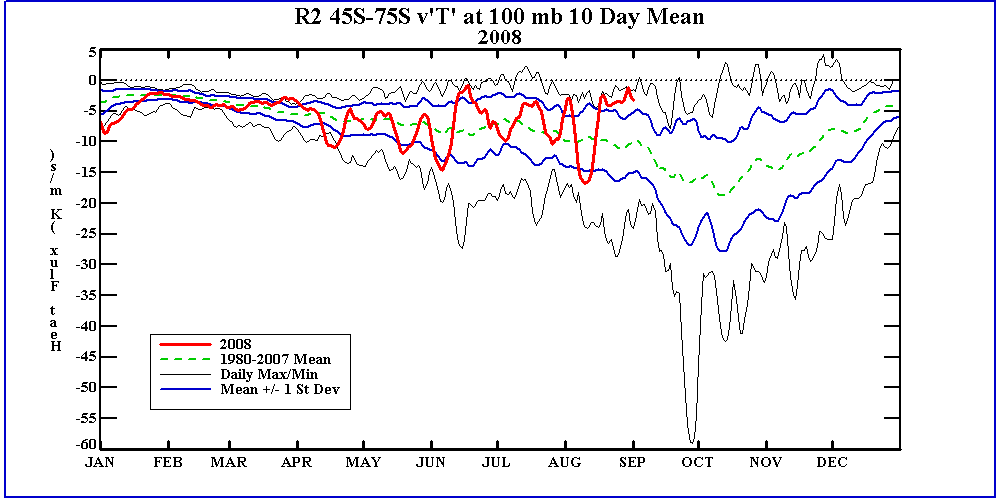 South Poleward eddy heat
flux at 100mb. This time series shows the 10 day averaged eddy heat flux towards the South
Pole at 100mb. Strong negative fluxes indicate poleward flux of heat via eddies. Multiple stong poleward
episodes will result in a smaller polar vortex and an ealier transition from winter to summer circulations.
Relatively small flux amplitudes will result in a more stable polar vortex and will extend the winter circulation
well into November and December. South Poleward eddy heat
flux at 100mb. This time series shows the 10 day averaged eddy heat flux towards the South
Pole at 100mb. Strong negative fluxes indicate poleward flux of heat via eddies. Multiple stong poleward
episodes will result in a smaller polar vortex and an ealier transition from winter to summer circulations.
Relatively small flux amplitudes will result in a more stable polar vortex and will extend the winter circulation
well into November and December.
 Time vs. Latitude of zonal mean temperatures on the
50 mb pressure surface. This figure shows the changes with time of
temperatures at all latitudes for the current year. We especially direct your attention to
the regions of cold air in the polar regions during the Northern and Southern winters.
Also shown are curves delineating the latitudes that are not sunlit during winter.
Latitudes poleward of this line are in complete darkness. Only when and where the
cold polar air is sunlit, can photo-chemical reactions depleting ozone take place, (in the
presence of chlorine and other halons). Time vs. Latitude of zonal mean temperatures on the
50 mb pressure surface. This figure shows the changes with time of
temperatures at all latitudes for the current year. We especially direct your attention to
the regions of cold air in the polar regions during the Northern and Southern winters.
Also shown are curves delineating the latitudes that are not sunlit during winter.
Latitudes poleward of this line are in complete darkness. Only when and where the
cold polar air is sunlit, can photo-chemical reactions depleting ozone take place, (in the
presence of chlorine and other halons).
100 hPa Previous Years:
2008, 2007,
2006, 2005,
2004, 2003,
2002, 2001,
2000, 1999,
1998, 1997,
1996, 1995,
1994, 1993,
1992, 1991,
1990, 1989,
1988, 1987,
1986, 1985,
1984, 1983,
1982, 1981,
1980, 1979
70 hPa Previous Years:
2008, 2007,
2006, 2005,
2004, 2003,
2002, 2001,
2000, 1999,
1998, 1997,
1996, 1995,
1994, 1993,
1992, 1991,
1990, 1989,
1988, 1987,
1986, 1985,
1984, 1983,
1982, 1981,
1980, 1979
50 hPa Previous Years:
2008, 2007,
2006, 2005,
2004, 2003,
2002, 2001,
2000, 1999,
1998, 1997,
1996, 1995,
1994, 1993,
1992, 1991,
1990, 1989,
1988, 1987,
1986, 1985,
1984, 1983,
1982, 1981,
1980, 1979
30 hPa Previous Years:
2008, 2007,
2006, 2005,
2004, 2003,
2002, 2001,
2000, 1999,
1998, 1997,
1996, 1995,
1994, 1993,
1992, 1991,
1990, 1989,
1988, 1987,
1986, 1985,
1984, 1983,
1982, 1981,
1980, 1979
10 hPa Previous Years:
2008, 2007,
2006, 2005,
2004, 2003,
2002, 2001,
2000, 1999,
1998, 1997,
1996, 1995,
1994, 1993,
1992, 1991,
1990, 1989,
1988, 1987,
1986, 1985,
1984, 1983,
1982, 1981,
1980, 1979
05 hPa Previous Years:
2008, 2007,
2006, 2005,
2004, 2003,
2002, 2001,
2000, 1999,
1998, 1997,
1996, 1995,
1994, 1993,
1992, 1991,
1990, 1989,
1988, 1987,
1986, 1985,
1984, 1983,
1982, 1981,
1980, 1979
02 hPa Previous Years:
2008, 2007,
2006, 2005,
2004, 2003,
2002, 2001,
2000, 1999,
1998, 1997,
1996, 1995,
1994, 1993,
1992, 1991,
1990, 1989,
1988, 1987,
1986, 1985,
1984, 1983,
1982, 1981,
1980, 1979
01 hPa Previous Years:
2008, 2007,
2006, 2005,
2004, 2003,
2002, 2001,
2000, 1999,
1998, 1997,
1996, 1995,
1994, 1993,
1992, 1991,
1990, 1989,
1988, 1987,
1986, 1985,
1984, 1983,
1982, 1981,
1980, 1979
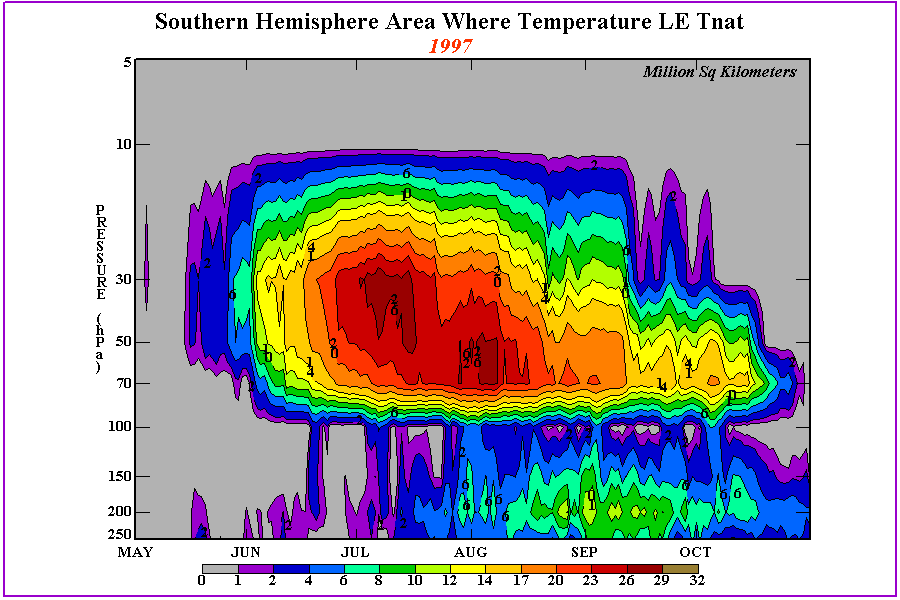
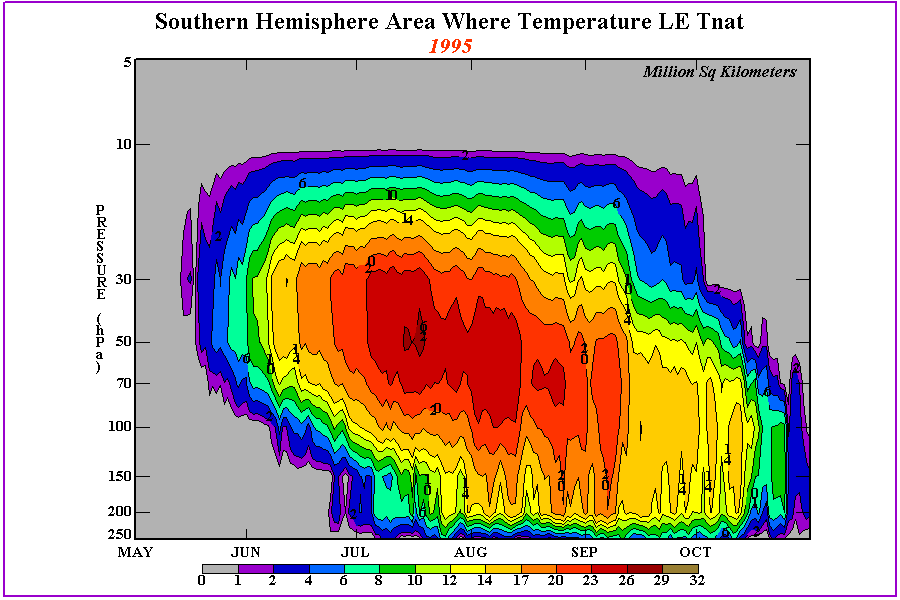
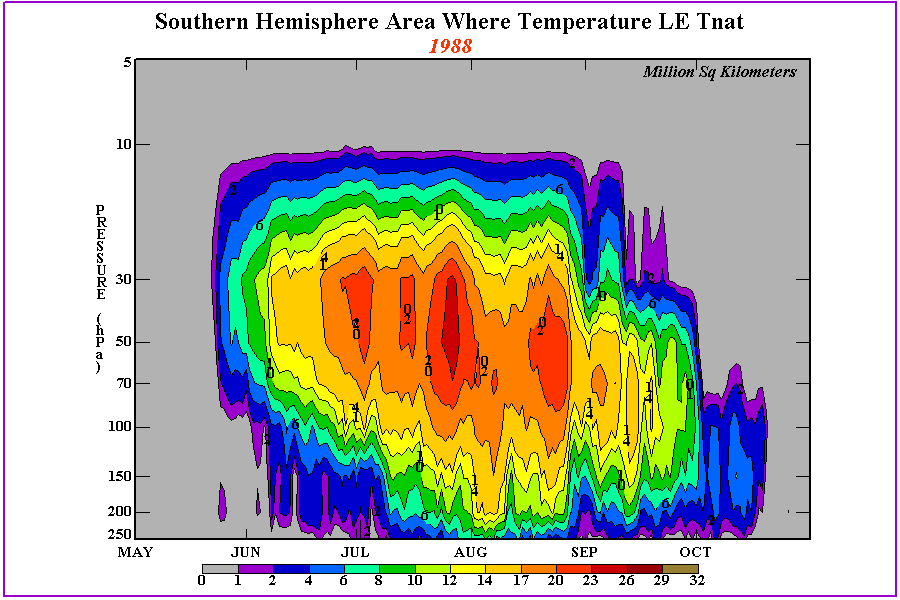
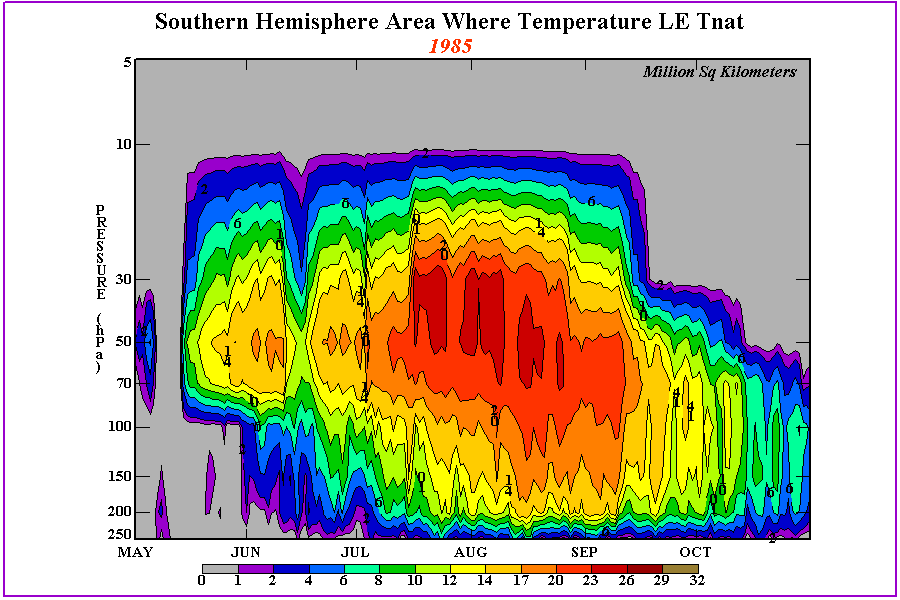
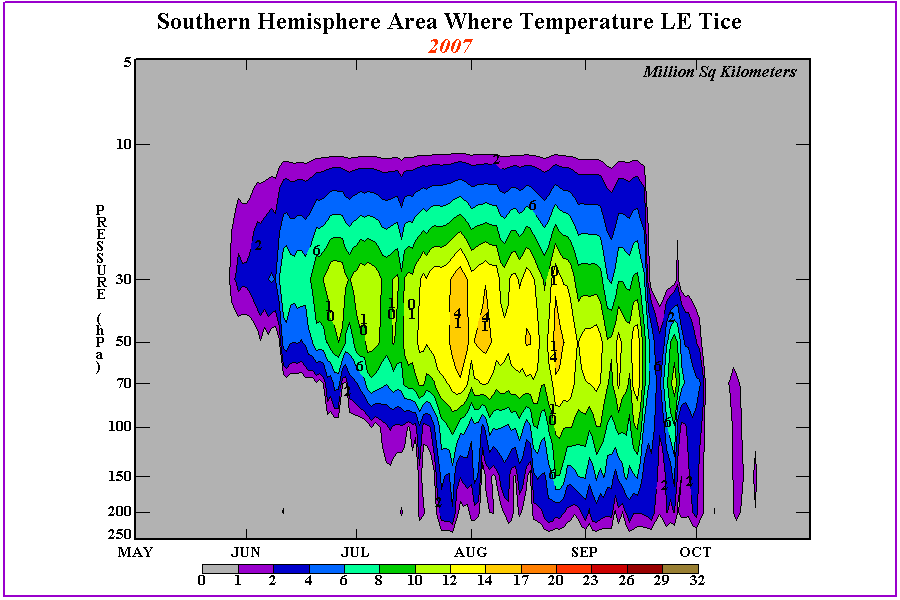
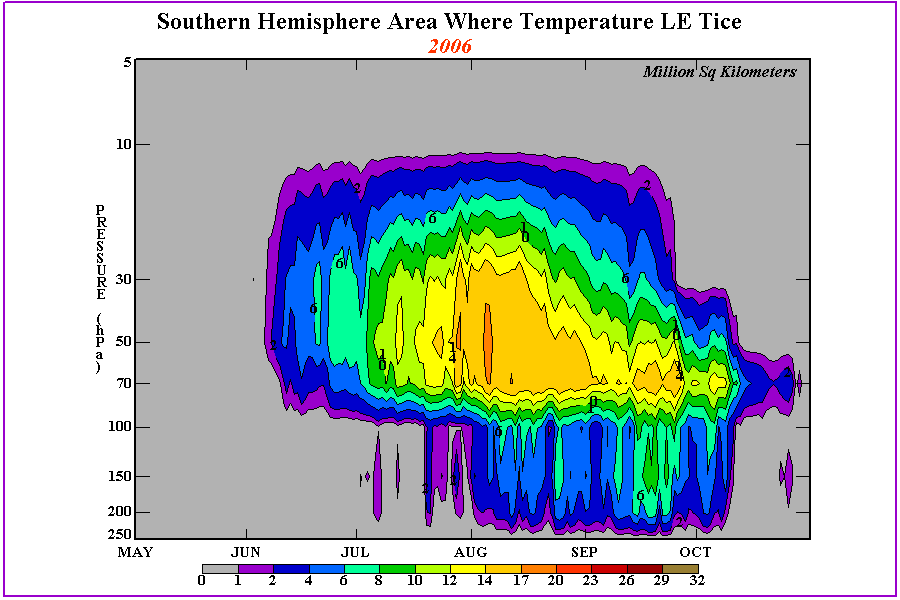
 Time vs. Pressure of Tnat in Southern Hemisphere.
This figure shows the change with time of the area at various pressure levels at which the temperature
is below that which forms Polar Stratospheric Clouds(PSC) Type I (nitric acid trihydrate - NAT) and II
(ice). At low temperatures over the winter polar areas (195 K or -78 C), nitric acid (HNO3) and
sulfur-containing gases condense with water vapor to form solid and liquid PSC particles.
At even lower temperatures(188 K and -85 C), ice particles form.
These particles grow in size and number to create cloud-like features. PSCs cause
changes in the abundance of reactive chlorine gases. Reactions occur on the surfaces of PSCs that
convert reservoir forms of reactive chlorine, ClONO2 and HCl, into the most reactive form ClO.
Reactive chlorine then destroys ozone once sunlight returns to the polar area. Time vs. Pressure of Tnat in Southern Hemisphere.
This figure shows the change with time of the area at various pressure levels at which the temperature
is below that which forms Polar Stratospheric Clouds(PSC) Type I (nitric acid trihydrate - NAT) and II
(ice). At low temperatures over the winter polar areas (195 K or -78 C), nitric acid (HNO3) and
sulfur-containing gases condense with water vapor to form solid and liquid PSC particles.
At even lower temperatures(188 K and -85 C), ice particles form.
These particles grow in size and number to create cloud-like features. PSCs cause
changes in the abundance of reactive chlorine gases. Reactions occur on the surfaces of PSCs that
convert reservoir forms of reactive chlorine, ClONO2 and HCl, into the most reactive form ClO.
Reactive chlorine then destroys ozone once sunlight returns to the polar area.
Tnat Previous Years:
2008, 2007,
2006, 2005,
2004, 2003,
2002, 2001,
2000, 1999,
1998, 1997,
1996, 1995,
1994, 1993,
1992, 1991,
1990, 1989,
1988, 1987,
1986, 1985,
1984, 1983,
1982, 1981,
1980, 1979
Tice Previous Years:
2008, 2007,
2006, 2005,
2004, 2003,
2002, 2001,
2000, 1999,
1998, 1997,
1996, 1995,
1994, 1993,
1992, 1991,
1990, 1989,
1988, 1987,
1986, 1985,
1984, 1983,
1982, 1981,
1980, 1979
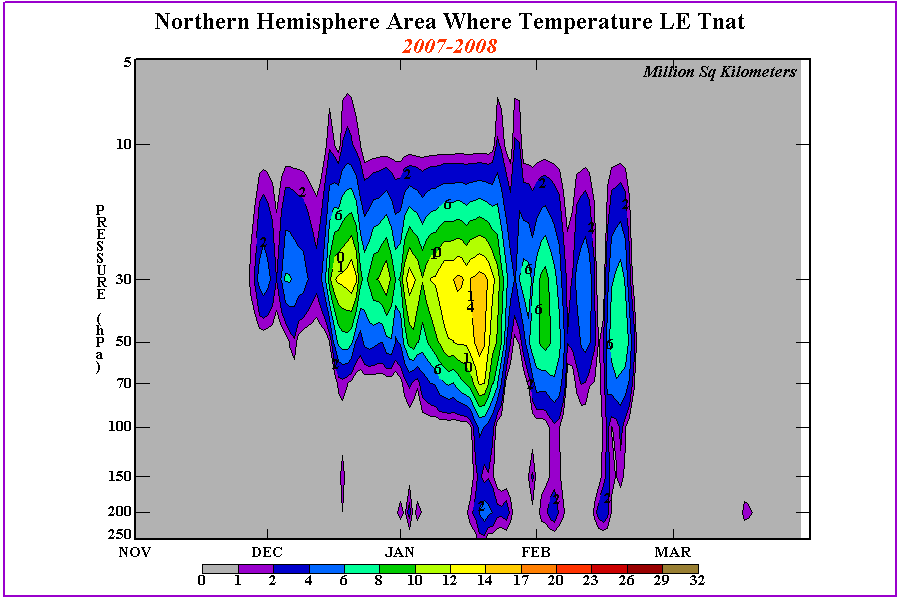
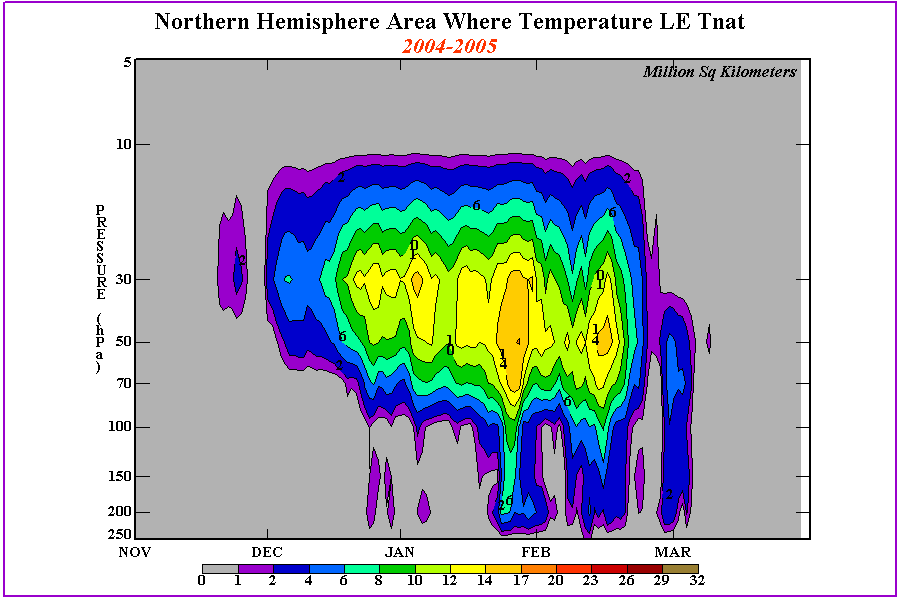
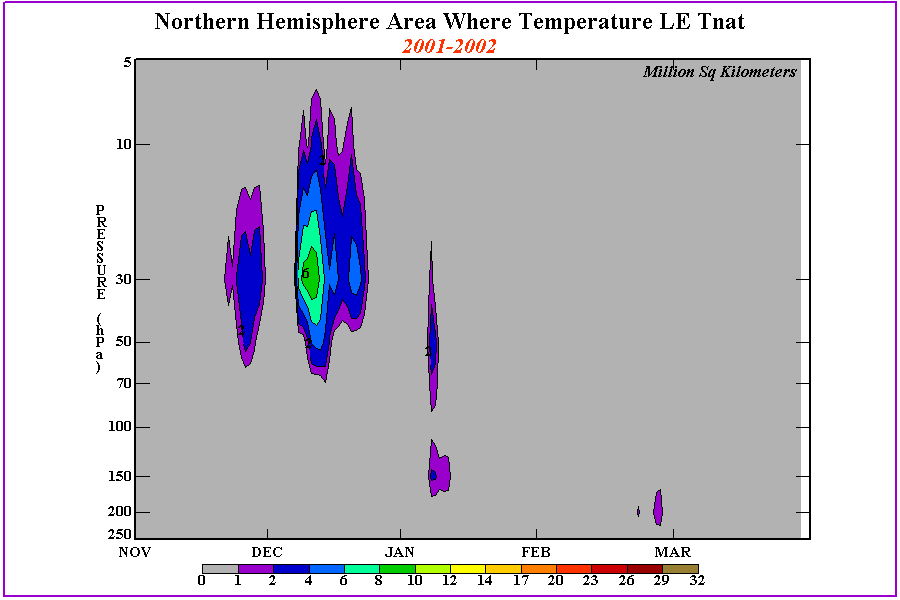
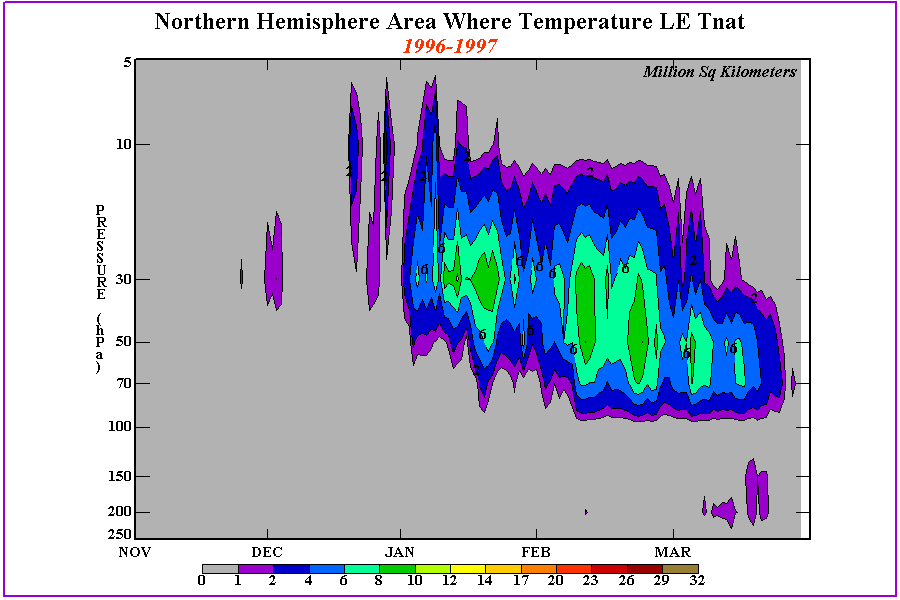
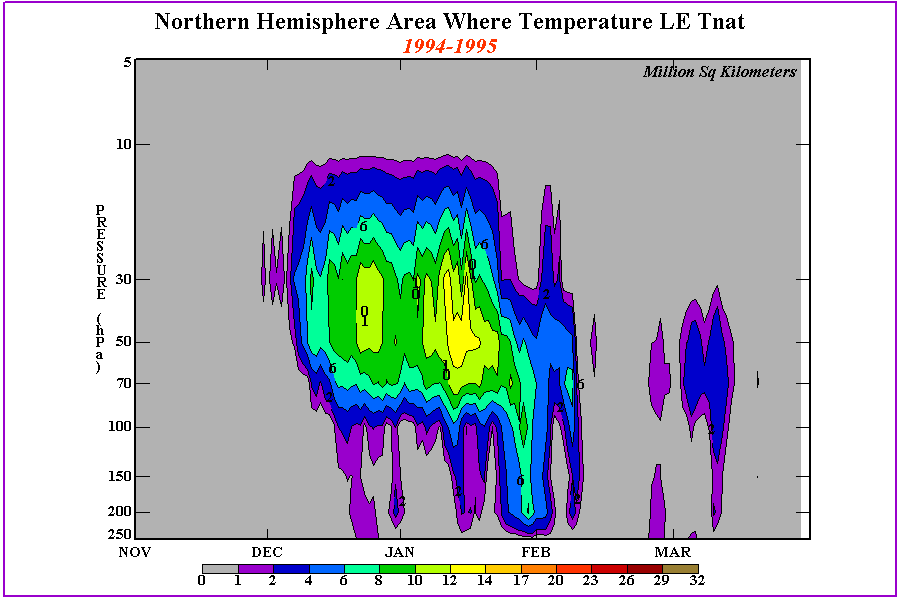
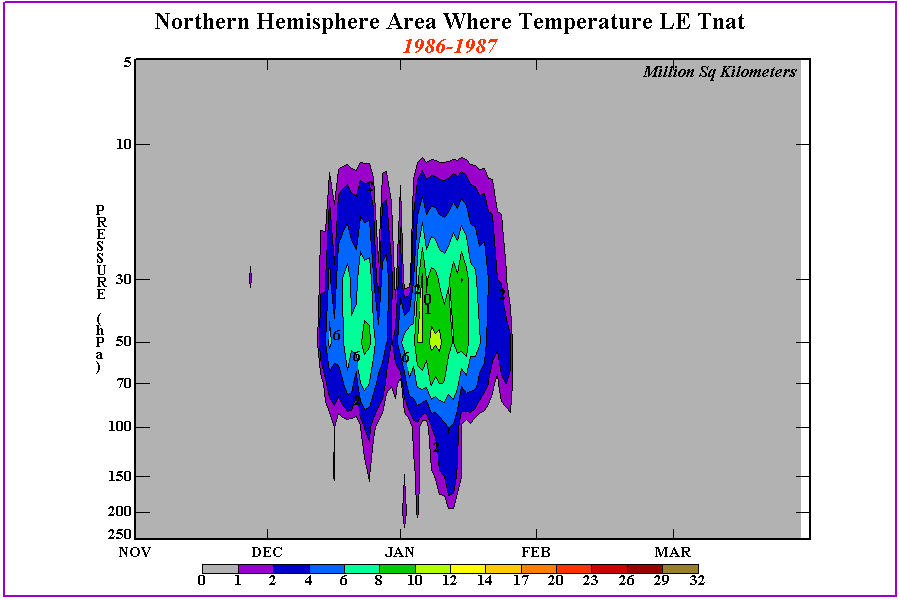
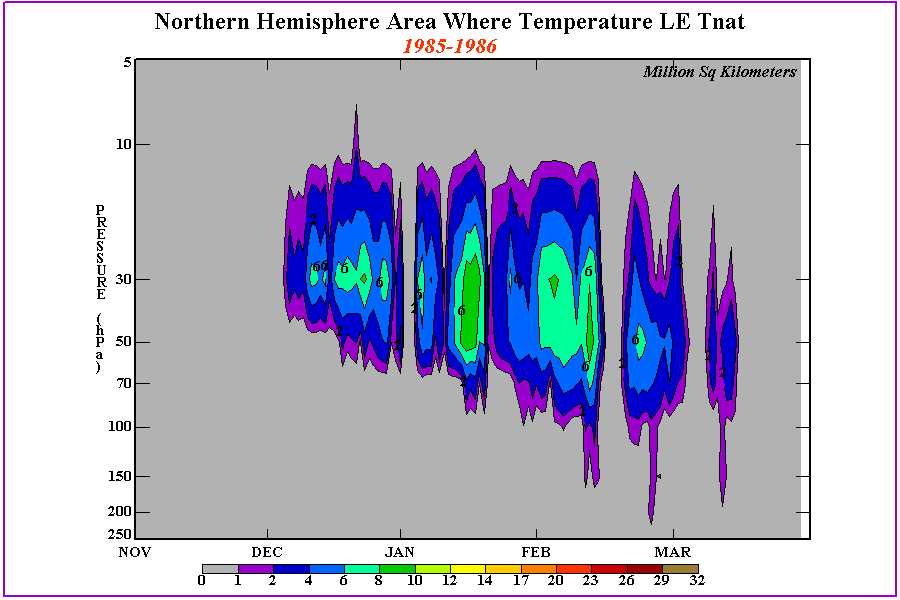
 Time vs. Pressure of Tnat in Northern Hemisphere.
This figure shows the change with time of the area at various pressure levels at which the temperature
is below that which forms Polar Stratospheric Clouds(PSC) Type I (nitric acid trihydrate - NAT).
At low temperatures over the winter polar areas (195 K or -78 C), nitric acid (HNO3) and
sulfur-containing gases condense with water vapor to form solid and liquid PSC particles.
At even lower temperatures(188 K and -85 C), ice particles form.
These particles grow in size and number to create cloud-like features. PSCs cause
changes in the abundance of reactive chlorine gases. Reactions occur on the surfaces of PSCs that
convert reservoir forms of reactive chlorine, ClONO2 and HCl, into the most reactive form ClO.
Reactive chlorine then destroys ozone once sunlight returns to the polar area. Time vs. Pressure of Tnat in Northern Hemisphere.
This figure shows the change with time of the area at various pressure levels at which the temperature
is below that which forms Polar Stratospheric Clouds(PSC) Type I (nitric acid trihydrate - NAT).
At low temperatures over the winter polar areas (195 K or -78 C), nitric acid (HNO3) and
sulfur-containing gases condense with water vapor to form solid and liquid PSC particles.
At even lower temperatures(188 K and -85 C), ice particles form.
These particles grow in size and number to create cloud-like features. PSCs cause
changes in the abundance of reactive chlorine gases. Reactions occur on the surfaces of PSCs that
convert reservoir forms of reactive chlorine, ClONO2 and HCl, into the most reactive form ClO.
Reactive chlorine then destroys ozone once sunlight returns to the polar area.
Tnat Previous Years:
2008, 2007,
2006, 2005,
2004, 2003,
2002, 2001,
2000, 1999,
1998, 1997,
1996, 1995,
1994, 1993,
1992, 1991,
1990, 1989,
1988, 1987,
1986, 1985,
1984, 1983,
1982, 1981,
1980, 1979
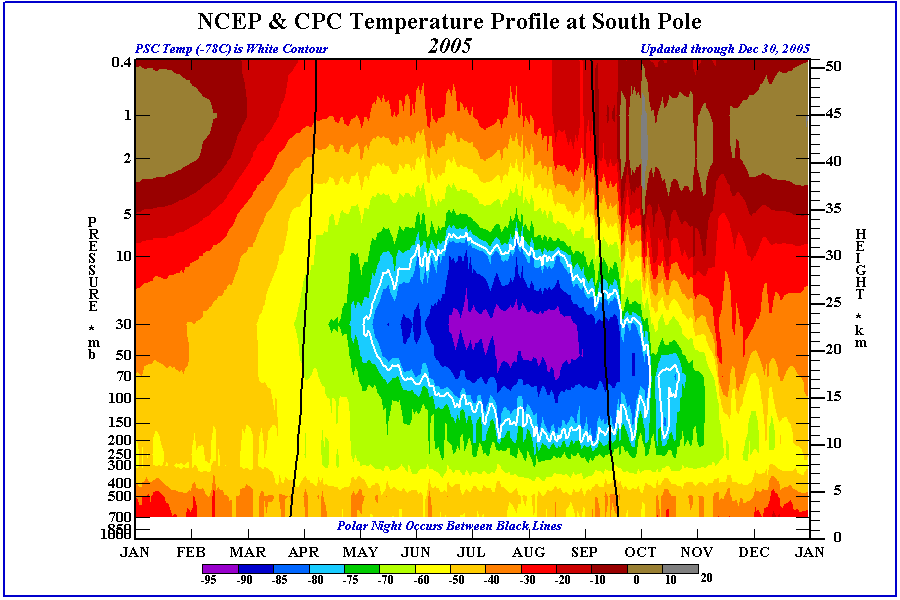
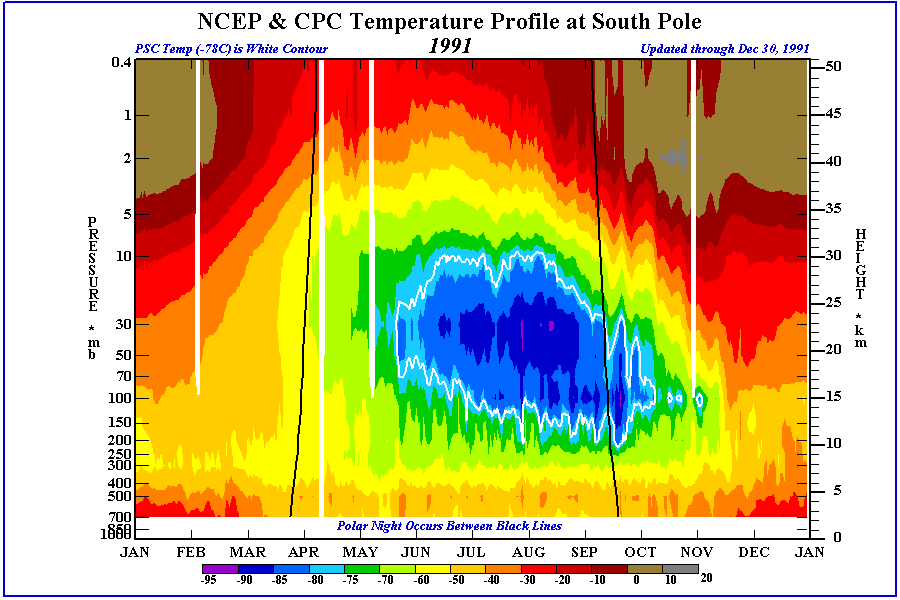
 Time vs. Pressure of temperatures over the
South Pole. This figure shows the changes with time of
temperatures over the South Pole throughout the troposphere and stratosphere. Very cold air
dominates over the South Polar region during Austral Winter. Adiabatically warmed descending
air at the highest altitudes (lowest pressures) becomes apparent by mid September. The
dynamic heating and then solar heating (in spring time) spread with time throughout the
polar stratosphere, leading to the weakening and breakup of the S.H. stratospheric polar
vortex. Time vs. Pressure of temperatures over the
South Pole. This figure shows the changes with time of
temperatures over the South Pole throughout the troposphere and stratosphere. Very cold air
dominates over the South Polar region during Austral Winter. Adiabatically warmed descending
air at the highest altitudes (lowest pressures) becomes apparent by mid September. The
dynamic heating and then solar heating (in spring time) spread with time throughout the
polar stratosphere, leading to the weakening and breakup of the S.H. stratospheric polar
vortex.
The white contour outlines the altitudes and time of temperatures lower than -78 C, where
Polar Stratospheric Clouds may form.
Previous Years:
2008, 2007,
2006, 2005,
2004, 2003,
2002, 2001,
2000, 1999,
1998, 1997,
1996, 1995,
1994, 1993,
1992, 1991,
1990, 1989,
1988, 1987,
1986, 1985,
1984, 1983,
1982, 1981,
1980, 1979
Links
For more information about stratospheric processes , ozone depletion and
recovery check out these sites:
For ozone sounding information from Antarctica check out these sites:
|


