Air Temperature
Global and Hemispheric
- Global & Hemispheric Temperature, NAO, and SOI (Review), 2000 Years, Jones and Mann 2004.
- Global Temperature (PCA: Tree-rings, Ice Cores, Corals, Sediments, Historical), 1000 Years, Jones et al. 1998
- Global Temperature (PCA: Tree-rings, Ice Cores, Corals) and Spatial Distribution, 600 Years, Mann et al. 2000.
- Global & Hemispheric Temperature (CPS & EIV: Tree Rings, Multiproxy), 2,000 Years, Mann et al. 2008.
- Global Temperature (PCA: Tree-rings, Ice Cores, Corals, Historical), 600 Years, Mann et al. 1998.
- Global Temperature (Glacier Length), 400 Years, Oerlemans 2005
- Global Temperature (Geothermal Heat Flow Analysis: Boreholes), 500 Years, Pollack et al. 1998.
- Antarctic Temperature, Vostok, (Isotopes: Ice Core) 414,000 Years, Petit et al. 1999.
- Antarctic Temperature, EPICA Dome C, (Isotopes: Ice Core) 800,000 Years, Jouzel et al. 2007.
- Northern Hemisphere & Regional Temperature (Age Band Decomp.: Tree-rings), 600 Years, Briffa et al. 2001.
- Northern Hemisphere Temperature (Regression: Tree-rings), 600 Years, Briffa et al. 1998.
- Northern Hemisphere Temperature (Tree-rings, Ice Cores, Historical), 1000 Years, Crowley & Lowery 2000.
- Northern Hemisphere Temperature (RCS and STD: Tree-rings), 1300 Years, D'Arrigo et al. 2006.
- Northern Hemisphere Temperature (RCS: Tree-rings), 1000 Years, Esper et al. 2002.
- Northern Hemisphere Temperature (Boreholes, Tree-ring, Ice Cores, Corals), 500 Years, Huang 2004.
- Northern Hemisphere Temperature (Review), 1000 Years, IPCC Fourth Assessment, Working Group 1, 2007.
- Hemispheric Temperature, NAO, and SOI (Review), 1000 Years, Jones et al. 2001.
- Northern Hemisphere Temperature (PCA: Tree-rings, Ice Cores, Corals), 1000 Years, Mann et al. 1999.
- Hemispheric Temperature (Historical, Tree-rings, Ice Cores, Sediment), 2000 Years, Mann and Jones 2003.
- Northern Hemisphere Temperature (Wavelet: Sediments, Tree-rings), 2000 Years, Moberg et al. 2005.
- Northern Hemisphere Temperature, Warm/Cold Spatial Extent, 1,200 Years, Osborn and Briffa 2006.
- Northern Hemisphere Temperature (Review/Comparison), 600 Years, Rutherford et al. 2005.
- Northern Hemisphere Temperature (Speleothem Layer Thickness), 500 Years, Smith et al. 2006.
- Northern Hemisphere Temperature (Tree-rings), 250 Years, Wilson et al. 2007.
Local and Regional
- Greenland Temperature, 49,000 Years, Alley 2000
- Arctic Temperature, 400 Years, Overpeck et al. 1997
- Antarctic Temperature, 200 Years, Schneider et al. 2006
- Dome Fuji, Antarctica Preliminary Temperature, 340,000 Years, Kawamura et al. 2007
- Africa
- Lake Malawi, East Africa Surface Temperature, 25,000 Years, Powers et al. 2005.
- Congo River Basin Mean Air Temperature, 25,000 Years, Weijers et al. 2007,
Text or
Excel format.
- Asia
- China Temperature, 2000 Years, Yang et al. 2002.
- East China Winter Temperature, 2000 Years, Ge et al. 2003.
- Beijing, China Temperature, 2650 Years, Tan et al. 2003.
- Taymir, northern Siberia, Summer Temperature, 400 Years, Jacoby et al. 2000.
- Yamal Peninsula, western Siberia, Summer Temperature, 4000 Years, Hantemirov and Shiyatov 2002.
- Kathmandu, Nepal, Pre- and Post- Monsoon Temperature, 550 Years, Cook et al. 2003.
- Hokkaido, Japan Warm Season Temperature, 440 Years, Davi et al. 2001.
- Lake Suigetsu, Japan Temperature, 15,700 - 10,200 YrBP, Nakagawa et al. 2006,
Text or
Excel format.
- Australia, New Zealand
- New Zealand Temperature, 270 Years, Xiong and Palmer 2000.
- Tasmania Temperature, 3600 Years, Cook et al. 2000
- Europe
- European Gridded and Regional Summer Temperature and Data Visualization, 225 Years, Briffa 1988.
- European Seasonal Temperature, with Data Visualization, 500 Years, Xoplaki et al. 2005, Luterbacher et al. 2004.
- European Pattern Climatology, Gridded Monthly Temp., Precip., 500hPa Height, 340 Years, Casty et al. 2007.
- European Alps Temperature and Precipitation Reconstructions, 500 Years, Casty et al. 2005.
- Central Alps Temperature, 2,000 Years, Mangini et al. 2005.
- Swiss Alps Temperature, 400 Years, Blass et al. 2007,
Text or
Excel.
- Switzerland Spring-Summer Temperature, 526 Years, Meier et al. 2007.
- Burgundy Spring-Summer Temperature, 630 Years, Chuine et al. 2004.
- Northern Coastal Norway Temperature, 650 Years, Kirchhefer 2001
- Abisko Valley, Northern Sweden Temperature, 10,000 Years, Larocque and Hall 2004,
Text or
Excel.
- North America
- Baffin Island Summer Temperature, 500 Years, Hughen et al. 2000.
- Baffin Island Summer Temperature, 1200 Years, Moore et al. 2001.
- Northwest Canada Temperature, 350 Years, Szeicz et al. 1995.
- Canadian Rockies Summer Temperature, 1050 Years, Luckman and Wilson 2005.
- Gulf of Alaska March-May,
March-Sept., and
April-Sept.
Temperature, 400 Years, Wiles et al. 1998.
- Wrangell Mountains, Alaska Warm Season Temperature, 400 Years, Davi et al. 2003.
- USA Pacific Northwest Temperature, 250 Years, Wiles et al. 1996.
- East-central Idaho July Temperature Reconstruction, 850 Years, Biondi et al. 1999.
- Southern Colorado Plateau Temperature Reconstruction, 2,262 Years, Salzer and Kipfmueller 2005.
- West N.America Gridded & Regional Summer Temperature and Data Visualization, 400 Years, Briffa et al. 1992.
- Large Scale N.American Temp. and Precip., Description, and Data Visualization, 400 Years, Fritts 1991.
- North American and Regional July Temperature Reconstructions, 14,000 Years, Viau et al. 2006,
Text or
Excel.
- South America
- Southern Andes Temperature, Text or
Excel format,
350 Years, Villalba et al. 2003.
Hydroclimate
Drought
- Africa
- East Africa Drought, 1100 Years, Verschuren et al. 2000.
- North America
- NOAA/NESDIS North American Drought Variability project
(includes Tree-ring reconstructed PDSI).
- A Paleo Perspective on North American Drought
- North American PDSI, 2000 Years, Cook et al. 2004.
- North American Great Plains Drought, 2300 Years, Laird et al. 1996.
- North American Great Plains Drought, 11,000 Years, Laird et al. 1996.
- Upper Mississippi Basin Aridity, 10,000 Years, Dean et al. 1997.
- U.S. Drought Area Index, 270 Years, Cook et al. 1997.
- U.S. PDSI, text or Microsoft Excel, and Data Visualization, 280 Years, Zhang et al. 2004.
- Western U.S. Drought Area Index, 1200 Years, Cook et al. 2004.
- Southwest US Drought Index, 570 Years, Cook unpublished data.
- Southwestern US Drought Maps from Pinyon Tree-Ring δ13C, 400 Years, Leavitt et al. 2007.
- Eastern Colorado PDSI, 440 Years, Woodhouse et al. 2001.
- Texas PDSI, 280 Years, Stahle and Cleaveland 1988.
- Northeastern Utah PDSI, 600 Years, Gray et al. 2003.
- Northern California and Nevada Multicentennial Droughts, 7600 Years, Benson et al. 2002.
- East USA Lost Colony/Jamestown Droughts, 800 Years, Stahle et al. 1998.
- Central American Drought and the Classic Maya Civilization, 9700 Years, Hodell et al. 1995.
Precipitation
- Africa
- East African Precipitation 40,000 Years, Bonnefille and Chalié 2000.
- Zimbabwe Summer Precipitation, 200 Years, Therrell et al. 2006,
Text or
Excel format.
- Asia
- Huashuan, China Precipitation, 400 Years, Hughes et al. 1994.
- Mongolia Riverflow and Precipitation Reconstructions, 350 Years, Pederson et al. 2001.
- Lake Suigetsu, Japan Precipitation, 15,700 - 10,200 YrBP, Nakagawa et al. 2006,
Text or
Excel format.
- Southern Jordan Precipitation, 400 Years, Touchan et al. 1999.
- Australia, New Zealand
- Queensland, Australia Riverflow and Precipitation, 350 Years, Lough 2007.
- Europe
- Gridded European Seasonal Precipitation, 500 Years, Pauling et al. 2006.
- Scotland Precipitation, 3600 Years, Proctor et al. 2002.
- Scotland Precipitation, 1000 Years, Proctor et al. 2000.
- Lyngen Peninsula, Norway, Winter Precipitation, Text or
Excel, 20,000 Years, Bakke et al. 2005.
- Bavarian Forest Spring-Summer Precipitation, 500 Years, Wilson et al. 2005.
- Turkey Precipitation 350 Years, D'Arrigo and Cullen 2001.
- Southwest Turkey Precipitation 660 Years, Touchan et al. 2003.
- Northwest Turkey Precipitation 365 Years, Akkemik et al. 2005.
- South Central Turkey Precipitation 300 Years, Akkemik et al. 2005.
- Northern Aegean (NE Greece/NW Turkey) May-June Precipitation, 900 Years, Griggs et al. 2007,
Text or
Excel.
- Eastern Mediterranean May-August Precipitation, 600 Years, Touchan et al. 2005,
Text or
Excel.
- North America
- Large Scale North American Temperature and Precipitation ,Description, and Data Visualization, 400 Years, Fritts 1991.
- Southern Manitoba precipitation reconstruction, 595 Years, St. George and Nielsen 2002.
- Northeast USA Little Ice Age Precipitation, 2000 Years, Gajewski 1988.
- Montpelier Plantation, Virginia Precipitation, 180 Years, Druckenbrod et al. 2003.
- Southeast USA Precipitation and PDSI reconstructions, 1000 Years, Stahle and Cleaveland 1992.
- Iowa Precipitation and PDSI reconstructions, 340 Years, Cleaveland and Duvick 1992.
- Missouri Precipitation and PDSI reconstructions, 400 Years, Cleaveland and Stahle 1996.
- Eastern Oregon Precipitation and PDSI, 300 Years, Garfin and Hughes 1997.
- Glacier National Park Mean Summer Deficit, 460 Years, Pederson et al. 2006.
- Bighorn Basin Wyoming/Montana Precipitation, 739 Years, Gray et al. 2004.
- Uinta Basin, Utah Precipitation, 775 Years, Gray et al. 2004.
- El Malpais, New Mexico Precipitation, 2129 Years, Grissino 1996.
- Arizona and New Mexico Climate Division Precipitation, 1000 Years, Ni et al. 2002.
- Southern Colorado Plateau Precipitation Reconstruction, 1,425 Years, Salzer and Kipfmueller 2005.
- Nevada Precipitation, 8000 Years, Hughes and Graumlich 1996.
- Durango, Mexico precipitation reconstruction, 610 Years, Cleaveland et al. 2003.
- Chihuahua, Mexico precipitation reconstruction, 350 Years, Díaz et al. 2002.
- Saltillo, Coahuila, Mexico, precipitation reconstruction, 220 Years, Pohl et al. 2003.
Streamflow
- Asia
- Selenge River, Mongolia Streamflow, 360 Years, Davi et al. 2006.
- Australia, New Zealand
- Burdekin River, Australia Streamflow, 350 Years, Isdale et al. 1998.
- Queensland, Australia Riverflow and Precipitation, 350 Years, Lough 2007.
- North America
- Upper Colorado River and tributaries flow, 1200 Years, Meko et al. 2007.
- Colorado River and tributaries flow, Text or
Microsoft Excel format, 500 Years, Stockton and Jacoby 1976.
- Upper Colorado River and tributaries flow, 500 Years, Woodhouse et al. 2006.
- California TreeFlow - Tree Ring Reconstructions of Streamflow for California
- Feather River, California flow reconstruction, 1076 Years, Meko 2001.
- Sacramento River, California flow reconstruction (JAWRA), 1109 Years, Meko et al. 2001.
- Sacramento River, California flow reconstruction (CDWR), 1076 Years, Meko 2001.
- Salinas River, California flow reconstruction, 595 Years, Griffin 2005.
- TreeFlow Project - Tree Ring Reconstructions of Streamflow for Colorado
- Clear Creek Colorado Annual Flow Reconstruction, 300 Years, Woodhouse 2000.
- Middle Boulder Creek Colorado Flow Reconstruction, 280 Years, Woodhouse 2001.
- Yellowstone River, Montana flow reconstruction, 270 Years, Graumlich et al. 2003.
- White River, Arkansas flow reconstruction, 963 Years, Cleaveland 2000.
- White River, Arkansas flow reconstruction, 280 Years, Cleaveland and Stahle 1989.
Other
- Global Lake Level Histories
- Europe
- Northern England Peatland Water Table, 4800 Years, Charman 2000.
- Northern Britain Stacked Water Table Record, 4400 Years, Charman et al. 2006.
- Folgefonna Glacier, Norway, Equilibrium-Line Altitude, Text or
Excel, 6,000 Years, Bakke et al. 2005.
- Lyngen Peninsula, Norway, Glacier Equilibrium-Line Altitude, Text or
Excel, 4,000 Years, Bakke et al. 2005.
- North America
- Chesapeake Bay Salinity reconstructions,
text or
Excel format, 550 Years, Cronin et al. 2000.
- Michigan Water Table Depth Reconstruction, 3,500 Years, Booth and Jackson 2003.
- Gunnison River Basin Snow Water Equivalent Reconstruction, 430 Years, Woodhouse 2003.
- Central Mexico Maize Yield Reconstruction, 525 Years, Therrell et al. 2006.
- San Francisco Bay Salinity reconstructions, 390 Years, Stahle et al. 2001.
- Caribbean Sea Salinity reconstructions, 130,000 Years, Schmidt et al. 2004.
Atmospheric Circulation Patterns
- Arctic Oscillation Warm Season SAT and SLP Indices, 325 Years, D'Arrigo et al. 2003.
- Increase in the Asian SW Monsoon During the Past Four Centuries, 400 Years, Anderson et al. 2002.
- Western Indian Ocean low-level cross-equatorial jet, 342 years, Gong & Luterbacher 2008,
Text or
Excel
- Pacific
- Pacific Decadal Oscillation, 330 Years, Biondi et al. 2001.
- Pacific Decadal Oscillation, 420 Years, D'Arrigo and Wilson 2006, Text or
Excel
- Pacific Decadal Oscillation, 300 Years, D'Arrigo et al. 2001.
- Pacific Decadal Oscillation, 1,000 Years, MacDonald and Case 2005.
- Pacific Decadal Oscillation, 530 Years, Shen et al. 2006.
- Niño 3 Index, 575 Years, Cook unpublished.
- Niño 3 Index and
Description, 330 Years, Mann et al. 2000.
- El Niño Events, 500 Years, Quinn and Neal 1983.
- Southern Oscillation Index, 270 Years, Stahle et al. 1998.
- Fiji-Tonga Interdecadal-Decadal Pacific Oscillation Index, 350 Years, Linsley et al. 2008,
Text or
Excel.
- Atlantic
- Atlantic Multidecadal Oscillation Index, 420 Years, Gray et al. 2004.
- North Atlantic Oscillation Index, 600 Years, Cook et al. 2002.
- North Atlantic Oscillation Index, 280 Years, Cook et al. 1998.
- North Atlantic Oscillation Index, 550 Years, Glueck and Stockton 2001.
- North Atlantic Oscillation Index, 500 Years, Luterbacher et al. 2002.
- North Atlantic Oscillation Index, 275 Years, Timm et al. 2004, Text or
Excel format.
- North Atlantic Oscillation Index, Southern Oscillation Index, 1000 Years, Jones et al. 2001.
- Eastern North Atlantic-European Sea Level Pressure Reconstruction, and Data Visualization, 500 Years, Luterbacher et al. 2002.

Sea Surface Temperature
- Global LGM SST and
Description, 18,000 YBP, Mix et al. 1999.
- Global Sea Surface Temperature, Holocene/Modern, Bollmann et al. 2002.
- Global Gridded LGM Sea Surface Temperature and Salinity,
Description, and Data Visualization, 18,000 Years Before Present, Paul and Schäfer-Neth 2003.
- Global Gridded LGM Sea Surface Temperature,
Description, and Data Visualization, 18,000 YBP, Hostetler and Mix 1999.
- Global CLIMAP LGM Sea Surface Temperature, 18,000 Years Before Present, CLIMAP Members 1981.
- Southern Ocean Sea Surface Temperature, 200,000 Years, Brathauer et al. 1999.
- Southern Ocean Sea Surface Temperature, 290,000 Years, Mashiotta et al. 1999.
- Southern Ocean Sea Surface Temperature, 160,000 years, Pahnke and Sachs 2006,
Text or
Excel.
- Southern Ocean Miocene Sea Surface Temperature, 17 - 11 MYrBP, Shevenell et al. 2004,
Text or
Excel.
- Atlantic/Pacific Bottom Water Temperature, 331,000 years, Martin et al. 2002,
Text or
Excel.
- Tropical Sea Surface Temperature, 250 Years, Wilson et al. 2006.
- Pacific
- Pacific SST Reconstructions and
Description, 400 Years, Evans et al. 2002.
- Eastern Tropical Pacific Sea Surface Temperature, 1,830,000 Years, Liu and Herbert 2004.
- Eastern Equatorial Pacific Sea Surface Temperature, 5,089,000 Years, Lawrence et al. 2006,
Text or
Excel.
- Eastern Equatorial Pacific Sea Surface Temperature & SSS, 90,000 Years, Leduc et al. 2007,
Text or
Excel.
- Southeast Pacific Sea Surface Temperature, 25,000 - 10,000 Years BP, Lamy et al. 2007,
Text or
Excel.
- Galápagos Sea Surface Temperature, 135,000 Years, Lea et al. 2006,
Text or
Excel.
- Southwest Pacific Sea Surface Temperature, 1,185,000 Years, Crundwell et al. 2008.
- Southwest Pacific Sea Surface Temperature, 340,000 Years, Pahnke et al. 2003.
- Southwest Pacific LGM Sea Surface Temperature and
Description, 18,000 YBP, Barrows et al. 2000.
- Equatorial Pacific Sea Surface Temperature, 470,000 Years, Lea et al. 2000.
- Equatorial Pacific Sea Surface Temperature, 1.5 - 0.5 MMYrBP, McClymont and Rosell-Melé 2006.
- Western Tropical Pacific Sea Surface Temperature, 1,750,000 Years, de Garidal-Thoron et al. 2005
- Western Tropical Pacific SST, 21,000 Years, Stott et al. 2007.
- Western Tropical Pacific SST and Salinity,
text or
Excel format, 15,000 Years, Stott et al. 2004.
- Western Tropical Pacific SST,
text or
Excel format, 67,000 Years, Stott et al. 2002.
- Western Tropical Pacific SST,
text or
Excel format, 1,340,000 Years, Medina-Elizalde and Lea 2005.
- Indo-Pacific Warm Pool SST and SSS,
text or
Excel format, 1,000 Years, Newton et al. 2006.
- Coral Sea SST,
text or
Excel format, 815,000 Years, Lawrence and Herbert 2005.
- Sea of Okhotsk alkenone SST,
text or
Excel format, 120,000 Years, Harada et al. 2006.
- Northwest Pacific alkenone SST,
text or
Excel format, 144,000 Years, Yamamoto et al. 2005.
- Okinawa Trough SST, 18,000 Years, Sun et al. 2005
- South China Sea Alkenone Deglacial SST Estimates, 3,000-16,000 Years Before Present, Kienast et al. 2001
- South China Sea Coral Sr Data and SST Reconstruction, 100 Years, Sun et al. 2004
- California Current Collapse, LGM, 18,000 Years Before Present, Herbert et al. 2001
- California Current alkenone SST,
text or
Excel format, 136,000 Years, Yamamoto et al. 2007.
- Strait of Juan de Fuca SST, 155 Years, Strom et al. 2004
- Rarotonga Sea Surface Temperature Reconstruction, 270 Years, Linsley et al. 2000.
- Southern Peru-Chile Current Sea Surface Temperature Reconstruction, 8,000 Years, Lamy et al. 2002.
- Southeast Pacific Sea Surface Temperature Reconstruction, 70,000 years, Kaiser et al. 2005.
- Southern Peru-Chile Current Sea Surface Temperature Reconstruction, 50 KyrBP-8 KYr BP, Lamy et al. 2004.
- Bay of Plenty, New Zealand, SST, 16,000 Years, Samson et al. 2005,
Text or
Excel format.
- Tasmanian Gateway SST, 500,000 Years, Nürnberg et al. 2004,
Text or
Excel format.
- Tasman Sea SST, 600,000 Years, Nürnberg and Groeneveld 2006,
Text or
Excel format.
- Great Barrier Reef Sea Surface Temperature Reconstruction, 440 Years, Wörheide 1998.
- Vanuatu Sea Surface Temperature, 4200 Years Before Present, Correge et al. 2000.
- Atlantic
- Subpolar North Atlantic Holocene SST,
Text or
Excel, 11,000 - 500 YrBP, Came et al. 2007.
- Subpolar North Atlantic SST,
Text or
Excel, 191,000 years, Oppo et al. 2006.
- North Atlantic Sea Surface Temperature, 107,000 Years, Bard 2002.
- North Atlantic Sea Surface Temperature and Salinity, 59,000 - 45,000 Years Before Present, Schmidt et al. 2006.
- North Atlantic 8200BP Event Summer and Winter SST,
Text or
Excel, 9,200 - 7,200 YrBP, Ellison et al. 2006.
- Northeast North Atlantic Faunal SST,
Text or
Excel, 56 - 40 KYrBP, Dickson et al. 2008.
- Northeast North Atlantic Younger Dryas SST/SSS,
Text or
Excel, 13 - 10 KYrBP, Ebbesen and Hald 2004.
- Gulf of Maine, 1000 years, Wanamaker et al. 2008,
Text or
Excel.
- Chesapeake Bay Spring Temperature, 2,200 Years, Cronin et al. 2003.
- Subtropical North Atlantic Sea Surface Temperature, 60 - 30 KYrBP, Sachs and Lehman 1999,
Text or
Excel.
- Subtropical Atlantic Sea Surface Temperature, 23,000 Years, deMenocal et al. 2000.
- Tropical Atlantic Sea Surface Temperature, 29,000 Years, Rühlemann et al. 1999.
- Southeast Atlantic Sea Surface Temperature, 41 - 10 KYrBP, Sachs et al. 2001,
Text or
Excel.
-
Equatorial East Atlantic SST/SSS, 155,000 Years, Weldeab et al. 2007.
-
Equatorial East Atlantic SST, 275,000 Years, Nürnberg et al. 2000.
- South-east Atlantic Sea Surface Temperature, 1.5 - 0.5 MMYrBP, McClymont et al. 2005.
- Alboran Sea, Western Mediterranean Sea Surface Temperature, 52 KYrBP, Cacho et al. 1999,
Text or
Excel.
- Western Mediterranean Sea Surface Temperature, 52 KYrBP, Cacho et al. 2001,
Text or
Excel.
- Equatorial Atlantic Sea Surface Temperature and
Description, 30,000 Years, Sikes and Keigwin 1994.
- Equatorial and North Atlantic SST and
Description, 125,000 Years, Waelbroeck et al. 1998.
- Orca Basin, Gulf of Mexico, 44 - 28 KYrBP, Hill et al. 2006,
Text or
Excel.
- Orca Basin, Gulf of Mexico, 10.5 - 7 KYrBP SST, LoDico et al. 2006,
Text or
Excel.
- Cariaco Basin Sea Surface Temperature, 25,000 Years, Lea et al. 2003.
- Cariaco Basin Sea Surface Temperature, 800 years, Black et al. 2007,
Text or
Excel.
- Northeast Caribbean Sea Surface Temperature, 1,950 Years, Nyberg et al. 2002.
- Northeast Caribbean Sea Surface Temperature, 300 Years, Winter et al. 2000.
- Western Caribbean Sea Surface Temperature, 475,000 Years, Schmidt et al. 2006.
- Indian
- Arabian Sea Surface Temperature Patterns, 20,000 Years, Dahl and Oppo 2006,
Text or
Excel format.
- Indian Ocean Sea Surface Temperature, 131,000 Years, Saraswat et al. 2005,
Text or
Excel format.
- Indian Ocean Sea Surface Temperature, 171,000 Years, Bard et al. 1997.
Other
Earth Surface Conditions
- Global Ice Topography, 21,000 Years, Peltier 1994.
- Global Ice Coverage, 21,000 Years, Peltier 1994.
- Global Relative Sea Level Histories, 21,000 Years, Peltier and Tushingham 1992.
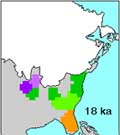
- North American Vegetation, 18,000 Years Before Present, Overpeck et al. 1992.
- European Vegetation (BIOME6000), 6000 Years Before Present, Prentice et al. 1996.
- Tahiti Relative Sea Level History, 13,000 Years, Bard et al. 1996.
- Red Sea Sea Level, Text or
Excel format,
380,000 Years, Siddall et al. 2003.
- Millennial-Scale Sea Level, Text or
Excel format,
83,000 - 13,000 Years BP, Arz et al. 2007.
- Southwest Pacific pH, 300 Years, Pelejero et al. 2005.
Miscellaneous
- Western North Atlantic Intense Hurricane Activity, 5,000 Years, Donnelly and Woodruff 2007.
- Estimated Number of Major Atlantic Hurricanes and Vertical Windshear, 260 Years, Nyberg et al. 2007.
- "Climate Since AD 1500" Collected reconstructions, 500 Years, Bradley and Jones 1992.
|


 The NOAA Paleoclimatology Program archives reconstructions of past climatic conditions derived from
paleoclimate proxies, in addition to the Program's large holdings of primary paleoclimatic proxy data.
Included are reconstructions of past temperature, precipitation, vegetation, streamflow, sea surface
temperature, and other climatic or climate-dependent conditions.
The NOAA Paleoclimatology Program archives reconstructions of past climatic conditions derived from
paleoclimate proxies, in addition to the Program's large holdings of primary paleoclimatic proxy data.
Included are reconstructions of past temperature, precipitation, vegetation, streamflow, sea surface
temperature, and other climatic or climate-dependent conditions.