

| Return to Satellite Data Main Page | ||||
Blended Sea Winds |
||||
| Summary | Data Access | Frequently Asked Questions | Bibliography | Contact |
|
|
||||
Summary |
|
|
The Blended Sea Winds contain globally gridded, high resolution ocean surface vector winds and wind stresses on a global 0.25° grid, and multiple time resolutions of 6-hourly, daily, monthly, and 11-year (1995-2005) climatological monthlies. The period of record is 9 July 1987 - present. The wind speeds were generated by blending observations from multiple satellites (up to six satellites since June 2002; Figure 2). The wind directions came from two sources depending on the products: for the research products the source is the NCEP Reanalysis 2 (NRA-2) and for near-real-time products the source is the ECMWF NWP. The wind directions were interpolated onto the blended speed grids. |
 Figure 1 - Click on image to see latest animation (3mb) Please read disclaimer for the near-real-time products |
|
The blending of multiple-satellite observations fill in the data gaps (in both time and space) of the individual satellite samplings and reduce the subsampling aliases and random errors. The development of these products is in response to the demand for increasingly higher resolution global datasets. For example, scientists want to make more accurate forecasts of ocean and weather conditions. Links to articles on the high resolution feasibility study and the blending methodology are found in the Bibliography section below. |
 Figure 2 - Equator crossing times. Red ascending and black descending. click on image for larger view |
|
Figure 3 shows the evolution of the averaged data sampling time interval by the long-term multiple satellites that observe the sea surface wind speed. Figure 4 shows an example of the blended winds where Hurricane Katrina, in the Gulf of Mexico, and Typhoon Talim, in the western Pacific Ocean, are clearly shown. |
 Figure 3 click on image for larger view |
|
Please note that these are research products, thus, they are considered as experimental in nature. Users are encouraged to register to receive update notices and to provide comments. |
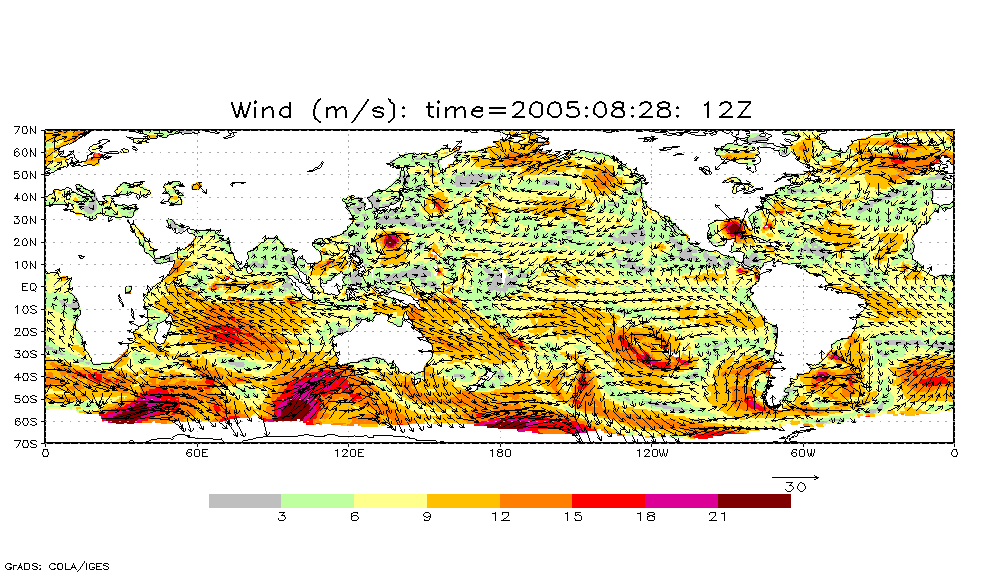 Figure4 - click on image for larger view |
|
|
|
Data Access |
|
|
Note: We encourage users to register to receive product update notices by e-mail. The global 0.25° grid data are available in netCDF and IEEE format for the period of record, July 1987 to present, with time resolutions of 6-hourly, daily, and monthly. There is also a 11-year (1995-2005) monthly climatological data set. Users can use the data with support reading programs in FORTRAN, MATLAB, and GrADS. The data servers below will also allow users to subset, visualize and download data in many formats (e.g. text, graphics, etc.) Users can access the data files via the following methods:
 Disclaimer for the near-real-time products (NRT) Disclaimer for the near-real-time products (NRT)
A version of NRT (about a 24-hour delay) Blended Sea Winds is produced quasi-daily to satisfy the needs of some users. Since the updates are done automatically under a non-operational environment (no 24/7 IT support), timely production is not guaranteed. Also, please note that the NRT data are replaced by the delayed-mode research quality data (Version 1.2) on a monthly basis. The data archive locations are the same for both the NRT and Research Quality products. File naming conventions are very similar, i.e. uv20080101rt.nc (NRT with 'rt'=real time) and uv20080101.nc (Research Quality - ver 1.2). |
|
|
|
|
Frequently Asked Questions |
|
|
Please check out the FAQ file and the Readme file. Should you have further questions, please contact Huai-Min.Zhang@noaa.gov.
|
|
|
|
|
Bibliography |
|
|
Zhang, H.-M., J.J. Bates, and R.W. Reynolds, 2006: "Assessment of composite global sampling: Sea surface wind speed". Geophysical Research Letters, VOL. 33, L17714, doi:10.1029/2006GL027086. Zhang, H.-M., R.W. Reynolds, and J.J. Bates, 2006: "Blended and Gridded High Resolution Global Sea Surface Wind Speed and Climatology from Multiple Satellites: 1987 - Present". American Meteorological Society 2006 Annual Meeting, Paper #P2.23, Atlanta, GA, January 29 - February 2, 2006. |
|
|
|
|
Contact |
|
|
Dr. Huai-Min Zhang |
|
   Downloaded Tuesday, 16-Sep-2008 08:10:10 EDT Last Updated Friday, 11-Apr-2008 15:47:21 EDT Please see the NCDC Contact Page if you have questions or comments. |