![[NCEP Logo]](https://webarchive.library.unt.edu/eot2008/20080916171852im_/http://www.nhc.noaa.gov/graphics/ncep.gif)
Text-only version
(printer friendly)
TROPICAL CYCLONE REPORTS
Tropical Storm Allison
Tropical Depression Two
Tropical Storm Barry
Tropical Storm Chantal
Tropical Storm Dean
Hurricane Erin
Hurricane Felix
Hurricane Gabrielle
Tropical Depression Nine
Hurricane Humberto
Hurricane Iris
Tropical Storm Jerry
Hurricane Karen
Tropical Storm Lorenzo
Hurricane Michelle
Hurricane Noel
Hurricane Olga
|
Tropical Cyclone Report
Hurricane Karen
12 - 15 October 2001
Stacy R. Stewart
National Hurricane Center
26 December 2001
Revised: 17 April 2002
Karen was a category 1 hurricane that originated from a
baroclinic system. The cyclone passed just south of Bermuda as a
powerful extratropical low and subtropical storm, and produced
hurricane force wind gusts and widespread damage on the island.
Karen later made landfall on Nova Scotia as a weak tropical
storm.
a. Synoptic History
Karen originated from a cold frontal system that stalled a
couple hundred miles southeast of Bermuda on 10 October. During the
day, a strong negatively-tilted, difluent upper-level trough dug
sharply southeastward off the east coast of the United States. The
associated strong divergence and upward vertical motion fields east
of the trough interacted with the cold front, increased the
baroclinic characteristics of the boundary, and helped spin up a
deep, extratropical low pressure system about 300 n mi southeast of
Bermuda. Due to the strong baroclinic effects, the occluded low
pressure system continued to deepen and tracked northward at 20 kt.
By 1800 UTC 11 October, the mid- to upper-level circulations became
vertically aligned with the low-level center as the system slowed
down and tracked northwestward at 13 to 15 kt.
An upper-air observation at 2300 UTC from Bermuda indicated the
presence of potentially cold, dry air in the mid- to upper-levels,
which is not typical of the inner-core region of a tropical
cyclone. However, the sounding data also showed that the powerful
low pressure area was beginning to acquire some warm-core
characteristics. The low- to mid-levels had become warmer than the
surrounding environment (compared to the 1100 UTC sounding; data
not shown) and the lapse rate was saturation adiabatic up to about
500 mb. The vertical wind profile was also more characteristic of a
warm-core cyclone with the strongest winds occurring near the top
of the boundary layer with decreasing wind speeds above that.
By 0000 UTC 12 October, the system had strengthened into a
powerful 988 mb low and became Subtropical Storm One about 30 n mi
south of Bermuda. The "best track" chart of the cyclone's path is
given in Figure 1,
while the best track positions and intensities are
listed in Table 1.
Wind and pressure plots are shown in Figure 2 and
Figure 3, respectively.
The cyclone continued to acquire more tropical
characteristics -- strong thunderstorms near the low-level center
by around 1800 UTC. At that time, the low had also become cut off
from the polar westerlies and had turned northward with a marked
decrease in forward speed. The occluded frontal appearance in
satellite imagery also became less distinct, which further
indicated that the system was undergoing a transition from a
subtropical low to a tropical cyclone. An investigative flight by
an Air Force Reserve reconnaissance aircraft near that time
confirmed that the cyclone had warm-core characteristics, at least
in the lower levels of the troposphere where the entire mission
took place.
Deep convection continued to develop and eventually encircled
the low-level center giving the appearance of a banded-eye feature
in satellite imagery. At 0600 UTC 13 October, Advanced Microwave
Sounding Unit (AMSU) satellite-derived temperature data indicated
the system had acquired enough warm-core characteristics throughout
the vertical column to make the transition to a tropical cyclone
and it became Tropical Storm Karen about 170 n mi north of Bermuda.
Karen then intensified very slowly and became a hurricane at 1800
UTC based on Dvorak satellite intensity estimates.
Karen moved in a general northward direction for the
next two days and reached a peak intensity of 70 kt at 0600 UTC 14
October when it was located about 350 n mi south of Halifax, Nova
Scotia. After peaking, Karen slowly weakened until the cyclone
reached the southwest coast of Nova Scotia near Western Head as a
40-kt tropical storm at around 1200 UTC on the 15th. The
cyclone then made a sharp turn to the northeast under the influence
of strong mid-latitude westerlies and became an extratropical low
pressure system again, losing all of its deep convection. The
remnant low-level circulation eventually became absorbed by a
larger extratropical low pressure system located to the west of
Newfoundland over the Gulf of St. Lawrence.
b. Meteorological Statistics
Observations in Karen (Figure 2 and Figure 3)
include satellite-based Dvorak technique intensity estimates from the
Tropical Analysis and Forecast Branch (TAFB), the Satellite
Analysis Branch (SAB) and the U. S. Air Force Weather Agency
(AFWA), as well as flight-level and dropwindsonde observations from
flights of the 53rd Weather Reconnaissance Squadron of
the U. S. Air Force Reserve Command.
Sustained winds to near hurricane strength with wind
gusts ranging from 78 to 85 kt were officially reported on Bermuda.
A gust to 103 kt was reported by the cruise ship Nordic
Empress anchored in a harbor on the west side of Bermuda
at around 2317 UTC 11 October, when the low was near its closest
approach to the island.
An Air Force Reserve reconnaissance aircraft made an
investigative flight into Karen from 1600 UTC to 2100 UTC 12
October. The two center penetrations at 1725 UTC and 1910 UTC
indicated 850 mb flight-level winds of 53 kt and 67 kt,
respectively, which only equates to surface winds of approximately
42 kt and 54 kt, respectively, when using the standard 0.80
reduction factor. However, two dropwindsondes released northwest
and southeast of the center indicated wind speeds of 60 to 63 kt in
the boundary layer with a sharp decrease to less than 45 kt near
the surface. Karen's peak intensity of 70 kt at 0600 UTC 14 October
is based on an objective Dvorak satellite intensity estimate (ODT)
of 70 kt.
It is important to note some of the inner-core
thermodynamic and kinematic characteristics of Karen when the
system passed close to Bermuda as an extratropical low. The 2300
UTC 11 October upper-air sounding (Figure 4) indicates a vertical
wind profile more characteristic of a warm- core tropical cyclone
with the strongest winds (70 kt) present in the lowest layers with
weakening and veering winds in the mid- and upper-levels.
Temperatures at 700, 500, 400, and 300 mb also warmed
7.0° , 7.0°, 6.2°, and
4.2° C, respectively, during the previous 24 h, whereas
temperatures at 250 and 200 mb remained steady or cooled slightly
during the same period. While the vertical temperature and moisture
profiles revealed a moist warm-core up to about 500 mb, this layer
was overlaid by a deep layer of potentially colder and drier air.
In fact, the lapse rate in the mid- and upper-levels were sharply
cooler than the typical saturation adiabatic lapse rate of the
inner-core region of tropical cyclones. This was most pronounced in
the 500-400 mb layer where the lapse rate steepened to nearly dry
adiabatic. While the sounding data indicates a thermodynamic
structure more typical of a cold core, extratropical low pressure
system above 500 mb, the vertical wind profile more closely
resembles that of a warm-core tropical cyclone. Hence, the system
is classified as a subtropical storm immediately after the sounding
time. However, there is presently no definitive criteria for
determining when an extratropical low acquires enough warm-core
characteristics to be classified as a subtropical low or when a
subtropical low becomes a tropical cyclone. It is entirely possible
that at 2300 UTC 11 October, Karen was already near tropical
cyclone status.
Concerning the near-hurricane force sustained winds
observed on Bermuda, the strong pressure difference between the
central pressure (988 mb) and the higher than normal surrounding
environmental pressures (1016-1020 mb) likely created a very tight
pressure gradient across the island. While the Bermuda upper-air
vertical wind profile (Figure 4)
did not indicate any winds greater
than 70 kt, the 103 kt wind gust observed by the Nordic Empress
could have been caused by strong convective
downdrafts emanating from low-topped convection. The downdrafts
could have been created by the entrainment of the potentially cold
(290-295 K theta-e) dry air that was present in the 400-300 mb
layer (see Figure 4).
Ship reports of tropical storm force winds associated
with Karen are given in Table 2.
c. Casualty and Damage Statistics
The strong winds caused considerable
tree and powerline damage on Bermuda. At one point, more than
23,000 people were without power. Three cruise ships weathered the
storm in St. George Harbor without receiving any significant
damage. However, the strong winds ripped out the bollard (a post
for fastening mooring lines) from the wharf and snapped a
three-inch mooring line, which resulted in the Norwegian
Majesty cruise ship being set adrift in the harbor. One
crew member suffered minor abrasions, but no passengers were
injured. A dozen or so smaller vessels or boats broke loose from
their moorings during the height of the storm and ran aground or
were sunk. Fortunately, there were no lives lost. In addition to
the strong winds, Bermuda received nearly three inches of rainfall
which caused some minor street floods.
Some beneficial rainfall of 1.4 to 1.8 inches occurred across portions
of drought-stricken Nova Scotia and New Brunswick. However,
owing to the rapid forward speed and weakening trend at landfall,
most areas of Nova Scotia, New Brunswick, and Prince Edward
Island generally received less than one-half inch of rainfall.
Wind gusts as high as 56 kt only caused minor tree
damage on Nova Scotia. There were no reports of casualties.
d. Forecast and Warning Critique
No meaningful forecast verification statistics are
available due to Karen's short life. However, the few cases that
made up the 12-, 24-, 36-, and 48-h average errors of 56, 84, 112,
and 199 n mi, respectively, were near or slightly above the 10-yr
average.
No tropical cyclone
watches or warnings were required for Hurricane Karen since it did
not become a tropical system until after it passed northwest of
Bermuda.However, the governments of
Bermuda and Canada issued extratropical marine storm warnings at
least 24 h in advance for Bermuda and Nova Scotia, respectively.
The Marine Prediction Center and the TPC's Tropical Analysis and
Forecast Branch also issued marine gale and storm warnings for
their respective Atlantic High Seas Forecast areas of
responsibility more than 24 h before the development of the
powerful pre-Karen extratropical low.
Table 1: Best track for Hurricane Karen, 12 - 15 October 2001.
Date/Time
(UTC) | Position | Pressure
(mb) | Wind Speed
(kt) | Stage |
| Lat. (°N) | Lon. (°W) |
| 11 / 0600 | 27.5 | 63.0 | 1009 | 30 | extratropical low |
| 11 / 1200 | 29.8 | 62.5 | 1003 | 35 | " |
| 11 / 1800 | 30.8 | 63.5 | 998 | 45 | " |
| 12 / 0000 | 31.8 | 64.7 | 991 | 60 | subtropical storm |
| 12 / 0600 | 32.2 | 65.8 | 988 | 60 | " |
| 12 / 1200 | 32.8 | 65.8 | 988 | 60 | " |
| 12 / 1800 | 33.5 | 66.3 | 988 | 60 | " |
| 13 / 0000 | 34.2 | 66.1 | 988 | 60 | " |
| 13 / 0600 | 34.9 | 65.3 | 988 | 60 | tropical storm |
| 13 / 1200 | 36.2 | 64.8 | 986 | 60 | " |
| 13 / 1800 | 37.3 | 64.6 | 985 | 65 | hurricane |
| 14 / 0000 | 37.9 | 64.0 | 985 | 65 | " |
| 14 / 0600 | 38.6 | 63.7 | 982 | 70 | " |
| 14 / 1200 | 39.3 | 63.9 | 988 | 60 | tropical storm |
| 14 / 1800 | 40.1 | 64.1 | 992 | 55 | " |
| 15 / 0000 | 40.9 | 64.4 | 995 | 50 | " |
| 15 / 0600 | 42.3 | 65.0 | 997 | 45 | " |
| 15 / 1200 | 44.2 | 64.8 | 998 | 40 | " |
| 15 / 1800 | 48.0 | 62.0 | 1002 | 40 | extratropical low |
| 16 / 0000 | | | | | absorbed by larger extratropical
low |
| 14 / 0600 | 38.6 | 63.7 | 982 | 70 | minimum pressure |
| 15 / 1200 | 44.2 | 64.8 | 998 | 40 | landfall near Western Head, NS |
Table 2: Selected ship observations of tropical storm or greater
winds associated with Hurricane Karen, 12 - 15 October 2001.
| Ship Name or Call Sign | Date/Time (UTC) | Lat. (°N) | Lon. (°W) | Wind dir/speed (deg/kt) | Pressure (mb) |
| ELJV7a,b | 11 / 2308 | 32.3 | 64.8 | 111 / 70 | |
| ELJV7a,b | 11 / 2310 | 32.3 | 64.8 | 111 / 68 | |
| ELJV7a,b | 11 / 2315 | 32.3 | 64.8 | 111 / 65 | |
| ELJV7a,b | 11 / 2317 | 32.3 | 64.8 | 111 / 79 103G | 991.0 |
| ELOU5 | 12 / 1500 | 34.8 | 71.3 | 030 / 38 | 1015.0 |
| ELOU5 | 12 / 1800 | 35.3 | 72.2 | 030 / 38 | 1015.0 |
| LAQT4 | 13 / 1800 | 37.5 | 66.9 | 060 / 35 | |
| GBRP | 14 / 1200 | 48.4 | 62.0 | 180 / 39 | 1027.7 |
| PDHW | 15 / 0000 | 38.2 | 61.5 | 210 / 37 | 1015.8 |
| GBRP | 15 / 1800 | 42.2 | 59.9 | 180 / 37 | 1017.9 |
aAnchored in port on west side of Bermuda
bAnemometer height 153 ft ASL
Grecorded wind gust |
Table 3: Hurricane Karen selected surface observations, 12 - 15 October 2001.
| | Minimum
Sea-level
Pressure | Maximum Surface Wind Speed
(kt) | |
| Location | Date/
Time
(UTC) | Press.
(mb) | Date/
Timea
(UTC) | Sust.
Windb
(kts) | Peak
Gust (kts) | Storm
Surgec
(ft) | Storm
Tided
(ft) | Rain
(storm total)
(in) |
| Bermuda |
| Bermuda IAP (TXKF) | 12/0030 | 992.0e | | | | | | |
| Bermuda IAP (TXKF) | 12/0055 | 992.7 | 12/0135 | 58 | 78 | | | |
| Bermuda IAP (TXKF) | | | 12/0230 | | 70 | | | |
| Bermuda IAP (TXKF) | | | 12/0310 | | 78 | | | |
| Bermuda IAP (TXKF) | | | 12/1200 | | | | | 2.70 |
| Devonshireg | | | 12/0142 | | 87 | | | |
| Fort Georgeh | | | 11/2229 | 64 | 83 | | | |
| Fort Georgeh | | | 11/2239 | 65 | 84 | | | |
| Fort Georgeh | | | 11/2249 | 64 | 85 | | | |
| Fort Georgeh | | | 11/2329 | 66 | 79 | | | |
| Fort Georgeh | | | 12/0019 | 66 | 82 | | | |
| Fort Georgeh | | | 12/0039 | 63 | 84 | | | |
| North Rocki | | | 11/2330 | | 76 | | | |
| Canada |
| Baccaro Pt, NS (WCP) | | | 15/0730 | 32 | 41 | | | |
| Beaver Island, NS (WBV) | | | 15/1545 | 39 | 47 | | | |
| Cape George, NS (WGU) | | | 15/1630 | 41 | 56 | | | |
| Caribou Pt, NS (WBK) | | | 15/1545 | 31 | 39 | | | |
| Charlottetown, PEI (CYYG) | | | 15/1845 | 23 | 34 | | | |
| Grand Etang, NS (WZQ) | | | 15/1000 | 36 | 47 | | | |
| Grindstone Is, QB (CYGR) | | | 15/2000 | 27 | 40 | | | |
| Halifax IAP, NS (CYHZ) | | | 15/1400 | 30 | 39 | | | |
| Hart Island, NS (WRN) | | | 15/1745 | 31 | 42 | | | |
| McNabs Island, NS (XMI) | | | 15/1330 | 38 | 56 | | | |
| Saint John, NB (CYSJ) | | | | | | | | 1.40 |
| Shearwater, NS (CYAW) | | | 15/1330 | 30 | 39 | | | |
| Sydney, NS (CYQY) | | | 15/1900 | 24 | 34 | | | |
| Yarmouth, NS (CYQI) | | | | | | | | 1.80 |
| Western Head, NS | | | 15/1400 | 20 | 37 | | | |
| 44142f (42.5N 64.0W) | | | 15/0800 | 34 | 40 | | | |
| 44258f (44.5N 63.3W) | | | 15/1500 | 29 | 34 | | | |
aDate/time is for wind gust when both sustained and gust are listed.
bExcept as noted, sustained wind averaging periods for C-MAN and land-based ASOS reports are
2 min; buoy averaging periods are 8 min.
cStorm surge is water height above normal astronomical tide level.
dStorm tide is water height above National Geodetic Vertical Datum (1929 mean sea level).
eestimated.
f10-min average; moored buoys.
gDevonshire, Cable and Wireless Mast
anemometer, 300 ft ASL, 5 n mi southwest of TXKF.
hFort George (Harbour Radio) anemometer,
230 ft ASL, 1.25 n mi north of TXKF.
iNorth Rock (northern reef) anemometer,
80 ft ASL, approx. 10 n mi north of TXKF. |

Figure 1:
Best track positions for Hurricane Karen, 12-15 October 2001.
Figure 2:
Best track maximum sustained surface wind speed curve for Hurricane Karen,
12-15 October 2001, and the observations on which the best track curve is
based. Aircraft observations have been adjusted for elevation using 90%,
80%, and 80% reduction factors for observations from 700 mb, 850 mb, and
1500 ft, respectively. Dropwindsonde observations include actual 10 m winds
(sfc), as well as surface estimates derived from the mean wind over the
lowest 150 m of the wind sounding (LLM), and from the sounding boundary
layer mean (MBL).
Figure 3:
Best track minimum central pressure curve for Hurricane Karen, 12-15 October
2001, and the observations on which the best track curve is based.
Figure 4:
Sounding from Bermuda (XKF) at 2300 UTC 11 October 2001.
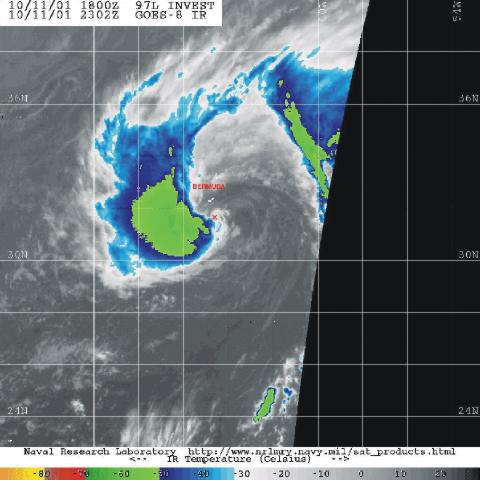
Figure 5:
Infrared satellite image at 2302 UTC 11 October at approximately the same
time as the sounding data when the center of the pre-Karen extratropical low
was located (X) about 30 n mi south of the island. The decreasing vertical
wind profile above the 850 mb-level is characteristic of a warm-core low
pressure system. However, note the presence of cool, dry air and the steeper
than saturation-adiabatic lapse rate in the mid- and upper-levels (i.e.,
above 500 mb level) of the sounding plot (note: temperature spike at 210 mb
is due to a program plotting error). Wind gusts above hurricane force, with
some as high as 103 kt, occurred on Bermuda within the next 2 hours. The
sounding plot is courtesy of the NOAA Forecast Systems Laboratory and the
NOAA National Climatic Data Center. The satellite image is courtesy of the
Naval Research Laboratory .
|