|
 |
 |
| Home | News | Organization |
|
|
Station List Observations Recent Historical Obs Search Ship Obs Report NOAA Obs APEX DART MMS ADCP TAO DODS HF Radar OSMC Dial-A-Buoy RSS Feeds Email Access Station Status NDBC Maintenance NDBC Platforms Partner Platforms Program Info About NDBC Met/Ocean Moored Buoy C-MAN TAO DART VOS CSP IOOS DAC Publications Hurricane Data Plots Mariners Weather Log Observing Handbook No. 1 Science Education FAQ Contact Us Links |
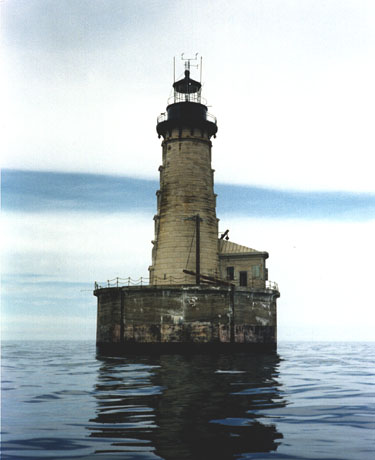
Station STDM4 - Stannard Rock, MI
|
|||||||||||||||||||||||||||||||||||||||||||||||||||||||||||||||||||||||||||||||||||||||||||||||||||||||||||||||||||||||||||||||||||||||||||||||||||||||||||||||||||||||||||||||||||||||||||||||||||||||||||||||||||||||||||||||||||||||||||||||||||||||||||||||||||||||||||||||||||||||||||||||||||||||||||||||||||||||||||||||||||||||||||||||||||||||||||||||||||||||||||||||||||||||||||||||||||||||||||||||||||||||||||||||||||||||||||||||||||||||||||||||||||||||||||||||||||||||||||||||||||||||||||||||||||||||||||||||||
Owned and maintained by National Data Buoy Center For Great Lakes marine forecasts, select: GREAT LAKES FORECASTS |
|
Click on the graph icon in the table below to see a time series plot of the last five days of that observation. | ||
 | Wind Direction (WDIR): | SSW ( 200 deg true ) |
| Wind Speed (WSPD): | 17 kts |
| Wind Gust (GST): | 17 kts |
| Atmospheric Pressure (PRES): | 30.08 in |
| Pressure Tendency (PTDY): | -0.02 in ( Falling ) |
| Air Temperature (ATMP): | 55.9 °F |
| Dew Point (DEWP): | 46.4 °F |
| Combined plot of Wind Speed, Gust, and Air Pressure | |
|
| MM | DD | TIME (EDT) | WDIR | WSPD kts |
GST kts |
WVHT ft |
DPD sec |
APD sec |
MWD | PRES in |
PTDY in |
ATMP °F |
WTMP °F |
DEWP °F |
SAL psu |
VIS mi |
TIDE ft | |
|---|---|---|---|---|---|---|---|---|---|---|---|---|---|---|---|---|---|---|
| 09 | 16 | 12:00 am | SSW | 17 | 18 | - | - | - | - | 30.09 | - | 55.8 | - | 48.7 | - | - | - | |
| 09 | 15 | 11:00 pm | SSW | 16 | 17 | - | - | - | - | 30.09 | +0.00 | 55.6 | - | 46.6 | - | - | - | |
| 09 | 15 | 10:00 pm | SSW | 14 | 15 | - | - | - | - | 30.10 | +0.00 | 55.8 | - | 46.8 | - | - | - | |
| 09 | 15 | 9:00 pm | WSW | 11 | 12 | - | - | - | - | 30.10 | +0.00 | 56.1 | - | 43.7 | - | - | - | |
| 09 | 15 | 8:00 pm | WSW | 12 | 14 | - | - | - | - | 30.09 | - | 55.8 | - | 43.3 | - | - | - | |
| 09 | 15 | 7:00 pm | WSW | 9 | 10 | - | - | - | - | 30.10 | -0.01 | 55.0 | - | 44.8 | - | - | - | |
| 09 | 15 | 6:00 pm | WSW | 5 | 6 | - | - | - | - | 30.10 | -0.01 | 54.3 | - | 41.9 | - | - | - | |
| 09 | 15 | 5:00 pm | WNW | 8 | 9 | - | - | - | - | 30.10 | -0.02 | 53.2 | - | 41.4 | - | - | - | |
| 09 | 15 | 4:00 pm | W | 12 | 13 | - | - | - | - | 30.11 | -0.03 | 52.3 | - | 39.9 | - | - | - | |
| 09 | 15 | 3:00 pm | WNW | 14 | 17 | - | - | - | - | 30.11 | -0.02 | 51.8 | - | 39.7 | - | - | - | |
| 09 | 15 | 2:00 pm | WNW | 12 | 13 | - | - | - | - | 30.12 | +0.00 | 51.8 | - | 40.3 | - | - | - | |
| 09 | 15 | 1:00 pm | NW | 7 | 9 | - | - | - | - | 30.13 | +0.02 | 51.1 | - | 39.2 | - | - | - | |
| 09 | 15 | 12:00 pm | NW | 12 | 16 | - | - | - | - | 30.14 | +0.05 | 50.4 | - | 38.7 | - | - | - | |
| 09 | 15 | 11:00 am | N | 11 | 13 | - | - | - | - | 30.13 | - | 49.8 | - | 38.3 | - | - | - | |
| 09 | 15 | 10:00 am | NNW | 12 | 14 | - | - | - | - | 30.11 | +0.05 | 49.6 | - | 39.2 | - | - | - | |
| 09 | 15 | 9:00 am | NW | 11 | 12 | - | - | - | - | 30.09 | +0.04 | 49.8 | - | 37.6 | - | - | - | |
| 09 | 15 | 8:00 am | N | 9 | 14 | - | - | - | - | 30.06 | +0.04 | 49.8 | - | 39.2 | - | - | - | |
| 09 | 15 | 7:00 am | N | 12 | 15 | - | - | - | - | 30.06 | - | 49.5 | - | 39.2 | - | - | - | |
| 09 | 15 | 6:00 am | N | 12 | 16 | - | - | - | - | 30.05 | +0.06 | 49.6 | - | 38.5 | - | - | - | |
| 09 | 15 | 5:00 am | N | 16 | 18 | - | - | - | - | 30.03 | +0.05 | 49.5 | - | 39.9 | - | - | - | |
| 09 | 15 | 4:00 am | NNE | 17 | 20 | - | - | - | - | 30.01 | +0.05 | 49.3 | - | 38.8 | - | - | - | |
| 09 | 15 | 3:00 am | NNE | 16 | 18 | - | - | - | - | 29.99 | +0.04 | 49.5 | - | 39.7 | - | - | - | |
| 09 | 15 | 2:00 am | NNE | 20 | 22 | - | - | - | - | 29.98 | +0.04 | 49.6 | - | 41.5 | - | - | - |
Links which are specific to this station are listed below:
Real Time Data in tabular form for the last forty-five days.
Historical Data & Climatic Summaries for quality controlled data for the current month, previous months, and previous years.
The weekly status report and the weekly maintenance report also provide valuable station information.
Note that the payload types and the station locations occasionally change.
Please refer to the NDBC data inventory
for the data history of each station.
| U.S. Dept. of Commerce National Oceanic and Atmospheric Administration National Weather Service National Data Buoy Center 1007 Balch Blvd. Stennis Space Center, MS 39529 Feedback Page last modified: September 5, 2008 |
Disclaimer Credits Glossary |
Privacy Policy About Us Career Opportunities |