

|
|
|

|
|

|
|
|
The World Data Center for Paleoclimatology features newly archived paleoclimatic data
and climate reconstructions relevant to important issues in paleoclimatology,
plus new services we offer to the scientific community. For a complete listing of
recent data contributions, please click the "most recent ten contributions" link on our
Contribution Series Search page
Please check our archived pages for What's New sections for the years: 2007, 2006, 2005, 2004, 2003, 2002, 2001, 2000, 1999, 1998, 1997, 1996, and 1995. What's New for 2008: |
|
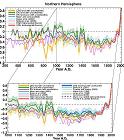
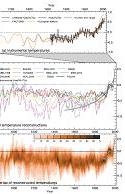
Proxy-based reconstructions of hemispheric
and global surface temperature variations
over the past two millennia
Mann et al. Proceedings of the National Academy of Sciences Vol. 105, No. 36, pp. 13252-13257, Sept. 9, 2008. doi:10.1073/pnas.0805721105 Following the suggestions of a recent National Research Council report [NRC (National Research Council) (2006) Surface Temperature Reconstructions for the Last 2,000 Years (Natl Acad Press, Washington, DC).], we reconstruct surface temperature at hemispheric and global scale for much of the last 2,000 years using a greatly expanded set of proxy data for decadal-to-centennial climate changes, recently updated instrumental data, and complementary methods that have been thoroughly tested and validated with model simulation experiments. Our results extend previous conclusions that recent Northern Hemisphere surface temperature increases are likely anomalous in a long-term context. Recent warmth appears anomalous for at least the past 1,300 years whether or not tree-ring data are used. If tree-ring data are used, the conclusion can be extended to at least the past 1,700 years, but with additional strong caveats. The reconstructed amplitude of change over past centuries is greater than hitherto reported, with somewhat greater Medieval warmth in the Northern Hemisphere, albeit still not reaching recent levels. |

|
Regional tree growth and inferred summer climate in the
Winnipeg River basin, Canada since AD 1783
St. George et al. Quaternary Research doi:10.1016/j.yqres.2008.04.009 A network of 54 ring-width chronologies is used to estimate changes in summer climate within the Winnipeg River basin, Canada, since AD 1783. The basin drains parts of northwestern Ontario, northern Minnesota and southeastern Manitoba, and is a key area for hydroelectric power production. Tree growth is significantly, but weakly, correlated with both temperature (negatively) and precipitation (positively) during summer. Simulated ring-width chronologies produced by a process model of tree-ring growth exhibit similar relationships with summer climate. High and low growth across the region is associated with cool/wet and warm/dry summers, respectively; this relationship is supported by comparisons with archival records from early 19th century fur-trading posts. The tree-ring record indicates that summer droughts were more persistent in the 19th and late 18th century, but there is no evidence that drought was more extreme prior to the onset of direct monitoring. |
|
High-resolution carbon dioxide concentration record
650,000-800,000 years before present
Lüthi et al. Nature Vol. 453, No. 7193, pp. 379-382, 15 May 2008. doi: 10.1038/nature06949 Changes in past atmospheric carbon dioxide concentrations can be determined by measuring the composition of air trapped in ice cores from Antarctica. So far, the Antarctic Vostok and EPICA Dome C ice cores have provided a composite record of atmospheric carbon dioxide levels over the past 650,000 years. Here we present results of the lowest 200m of the Dome C ice core, extending the record of atmospheric carbon dioxide concentration by two complete glacial cycles to 800,000 yr before present. From previously published data and the present work, we find that atmospheric carbon dioxide is strongly correlated with Antarctic temperature throughout eight glacial cycles but with significantly lower concentrations between 650,000 and 750,000 yr before present. Carbon dioxide levels are below 180 parts per million by volume (p.p.m.v.) for a period of 3,000 yr during Marine Isotope Stage 16, possibly reflecting more pronounced oceanic carbon storage. We report the lowest carbon dioxide concentration measured in an ice core, which extends the pre-industrial range of carbon dioxide concentrations during the late Quaternary by about 10 p.p.m.v. to 172-300 p.p.m.v. |
|
Orbital and millennial-scale features of atmospheric CH4 over the past
800,000 years.
Loulergue et al. Nature Vol. 453, No. 7193, pp. 383-386, 15 May 2008. doi: 10.1038/nature06950 Atmospheric methane is an important greenhouse gas and a sensitive indicator of climate change and millennial-scale temperature variability. Its concentrations over the past 650,000 years have varied between ~350 and ~800 parts per 109 by volume (p.p.b.v.) during glacial and interglacial periods, respectively. In comparison, present-day methane levels of ~1,770 p.p.b.v. have been reported. Insights into the external forcing factors and internal feedbacks controlling atmospheric methane are essential for predicting the methane budget in a warmer world. Here we present a detailed atmospheric methane record from the EPICA Dome C ice core that extends the history of this greenhouse gas to 800,000 yr before present. The average time resolution of the new data is ~380 yr and permits the identification of orbital and millennial-scale features. Spectral analyses indicate that the long-term variability in atmospheric methane levels is dominated by ~100,000 yr glacial-interglacial cycles up to ~400,000 yr ago with an increasing contribution of the precessional component during the four more recent climatic cycles. We suggest that changes in the strength of tropical methane sources and sinks (wetlands, atmospheric oxidation), possibly influenced by changes in monsoon systems and the position of the intertropical convergence zone, controlled the atmospheric methane budget, with an additional source input during major terminations as the retreat of the northern ice sheet allowed higher methane emissions from extending periglacial wetlands. Millennial-scale changes in methane levels identified in our record as being associated with Antarctic isotope maxima events are indicative of ubiquitous millennial-scale temperature variability during the past eight glacial cycles. |

|
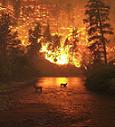
Changes in fire regimes since the Last Glacial Maximum: an assessment
based on a global synthesis and analysis of charcoal data
Power et al. Climate Dynamics Volume 30, Numbers 7-8, June 2008. doi:10.1007/s00382-007-0334-x Fire activity has varied globally and continuously since the last glacial maximum (LGM) in response to long-term changes in global climate and shorter-term regional changes in climate, vegetation, and human land use. We have synthesized sedimentary charcoal records of biomass burning since the LGM and present global maps showing changes in fire activity for time slices during the past 21,000 years (as differences in charcoal accumulation values compared to pre-industrial). There is strong broadscale coherence in fire activity after the LGM, but spatial heterogeneity in the signals increases thereafter. |
|
Dust-climate couplings over the past 800,000 years from the EPICA Dome C ice core.
Lambert et al. Nature Vol. 452, No. 7187, pp. 616-619, 3 April 2008. doi: 10.1038/nature06763 Dust can affect the radiative balance of the atmosphere by absorbing or reflecting incoming solar radiation; it can also be a source of micronutrients, such as iron, to the ocean. It has been suggested that production, transport and deposition of dust is influenced by climatic changes on glacial-interglacial timescales. Here we present a high- resolution record of aeolian dust from the EPICA Dome C ice core in East Antarctica, which provides an undisturbed climate sequence over the past eight climatic cycles. We find that there is a significant correlation between dust flux and temperature records during glacial periods that is absent during interglacial periods. Our data suggest that dust flux is increasingly correlated with Antarctic temperature as the climate becomes colder. We interpret this as progressive coupling of the climates of Antarctic and lower latitudes. Limited changes in glacial-interglacial atmospheric transport time suggest that the sources and lifetime of dust are the main factors controlling the high glacial dust input. We propose that the observed ~25-fold increase in glacial dust flux over all eight glacial periods can be attributed to a strengthening of South American dust sources, together with a longer lifetime for atmospheric dust particles in the upper troposphere resulting from a reduced hydrological cycle during the ice ages. |
|
Palaeoclimate
Jansen et al. IPCC Fourth Assessment, Working Group 1 In Solomon et al. Climate Change 2007: The Physical Science Basis. Cambridge University Press, Cambridge, UK and New York, NY, USA. This chapter assesses palaeoclimatic data and knowledge of how the climate system changes over interannual to millennial time scales, and how well these variations can be simulated with climate models. Additional palaeoclimatic perspectives are included in other chapters. Palaeoclimate science has made significant advances since the 1970s, when a primary focus was on the origin of the ice ages, the possibility of an imminent future ice age, and the first explorations of the so-called Little Ice Age and Medieval Warm Period. Even in the first IPCC assessment (IPCC, 1990), many climatic variations prior to the instrumental record were not that well known or understood. Fifteen years later, understanding is much improved, more quantitative and better integrated with respect to observations and modelling. |
|
A European pattern climatology 1766-2000
Casty et al. Climate Dynamics Volume 29, Numbers 7-8, December, 2007. doi:10.1007/s00382-007-0257-6 Using monthly independently reconstructed gridded European fields for the 500 hPa geopotential height, temperature, and precipitation covering the last 235 years we investigate the temporal and spatial evolution of these key climate variables and assess the leading combined patterns of climate variability. Seasonal European temperatures show a positive trend mainly over the last 40 years with absolute highest values since 1766. Precipitation indicates no clear trend. Spatial correlation technique reveals that winter, spring, and autumn covariability between European temperature and precipitation is mainly influenced by advective processes, whereas during summer convection plays the dominant role. The dominant patterns of climate variability for winter, spring, and autumn resemble the North Atlantic Oscillation and show a distinct positive trend during the past 40 years for winter and spring. A positive trend is also detected for summer pattern 2, which reflects an increased influence of the Azores High towards central Europe and the Mediterranean coinciding with warm and dry conditions. |
|
Fire Climatology
Swetnam and Anderson eds. International Journal of Wildland Fire Special Issue Vol. 17. No. 1. February 2008 This issue of the International Journal of Wildland Fire highlights significant work presented at a session on fire climatology at the 3rd International Fire Ecology and Management Congress in San Diego, USA, in 2006. Manuscripts in this special issue have passed rigorous peer-review and offer more detail that presented at the Congress. A defining feature of this collection is the inclusion of both modern and palaeofire perspectives, working with a broad range of data over a range of temporal and spatial scales. Three themes therefore are: modern fire climatology from documentary records; palaeofire climatology from tree rings and fire scars; and palaeofire climatology from sedimentary charcoal and pollen. These themes provide contrasting or complementary insights about fire regime changes and responses to climate. |

|
Grape harvest dates as a proxy for Swiss April to August temperature
reconstructions back to AD 1480
Meier et al. Geophysical Research Letters Vol. 34, L20705, doi:10.1029/2007GL031381 We present an annually resolved record of grape harvest dates for Switzerland. The strong negative relationship between grape harvest dates and April-August temperatures allowed a new reconstruction, with associated uncertainties, to be derived back to 1480. Calibration (1928-1979) was performed with monthly data from the Basel and Geneva stations and verified over 1980-2006. Twelve days of grape harvest difference correspond to around 1°C April-August temperature difference. Periods cooler (late grape harvest dates) than the 1961-1990 mean are reconstructed during the 17th century and at the beginning of the 19th century. Warmer conditions were experienced in the early 18th century and during the recent decades, in agreement with grape harvest temperature reconstructions from France and other independent temperature estimates. On decadal (annual) time-scales the earliest harvests were in the 1580s (2003) and the latest vintages in the 1740s (1816). Large tropical volcanic eruptions led to significantly later grape harvest dates (cooling) one to two years after the event. |
What's New for 2007:
|
What's New for 2006:
|
What's New for 2005:
|
What's New for 2004:
|
What's New for 2003:
|
What's New for 2002:
|
What's New for 2001:
|
What's New for 2000:
|
What's New for 1999:
|
What's New for 1998:
|
What's New for 1997:
|
What's New for 1996:
|
What's New for 1995:
|
|
|
||

|

|

|
|
|
||
|
http://www.ncdc.noaa.gov/paleo/whatsnew.html Downloaded Tuesday, 16-Sep-2008 07:12:16 EDT Last Updated Tuesday, 09-Sep-2008 17:59:17 EDT by paleo@noaa.gov Please see the Paleoclimatology Contact Page or the NCDC Contact Page if you have questions or comments. |