Summary
of 10 Year Time Scale
 Over
a span of a decade,
we have a more expanded
perspective of climate variability than one annual cycle. Longer term
patterns of climate variability are revealed that cannot be seen over
the course of one year, such as those related to ENSO (El Niño-Southern
Oscillation), a powerful force on climate variability explored in
more detail in Climate Science. In Climate
History, we look at the 1990s and how the costs of contending
with natural hazards such as floods and extreme weather events have
increased significantly even though the frequency of such storms didn't
increase. In the Resources section there
are links to additional resources on ENSO and
streamflows and the stories they tell.
Over
a span of a decade,
we have a more expanded
perspective of climate variability than one annual cycle. Longer term
patterns of climate variability are revealed that cannot be seen over
the course of one year, such as those related to ENSO (El Niño-Southern
Oscillation), a powerful force on climate variability explored in
more detail in Climate Science. In Climate
History, we look at the 1990s and how the costs of contending
with natural hazards such as floods and extreme weather events have
increased significantly even though the frequency of such storms didn't
increase. In the Resources section there
are links to additional resources on ENSO and
streamflows and the stories they tell.
Here's
a look at the climate-related events of the past and their impact on
human activities
| Year |
Climate
Related Events
|
| 2001 |
 -Severe
flooding impacts hundreds of thousands in Mozambique and other
southeastern African nations in February-April. -Severe
flooding impacts hundreds of thousands in Mozambique and other
southeastern African nations in February-April.
-Active hurricane season with 15 storms in Atlantic.
-Tropical
Storm Allison drenches Louisiana and southeast Texas;
$5 billion dollars in damages and 41 lives lost.
-Southeast Asian drought centered in Afganistan that began in
1998 continues.
-Millions in Vietnam and Cambodia effected by flooding in August-October.
|
| 2000 |

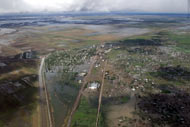
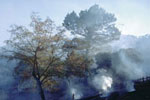
-Wildfires
in the Western US
burn over 6 million acres and cost over $1 billion to fight.
-Severe
drought affects parts of US and Asia, while flooding occurs in
SW Asia.
Image of wildfire aftermath from FEMA.
|
| 1999 |
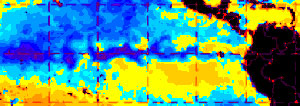 -La
Niña linked to droughts conditions in much of US and higher
than normal precipitation in Pacific Northwest. -La
Niña linked to droughts conditions in much of US and higher
than normal precipitation in Pacific Northwest.
-December- Severe windstorms
uproot trees in France in December.
-Global mean temperature (Land and Ocean combined) for year is
5th
warmest on record since 1880 and second warmest for US, with 1998
being the warmest.
|
| 1998 |
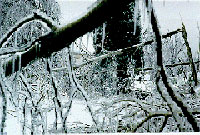 -January-
Severe
Ice Storm hits NE US and Canada, leaving millions without
electricity, triggering flooding. -January-
Severe
Ice Storm hits NE US and Canada, leaving millions without
electricity, triggering flooding.
-November- Hurricane
Mitch devastates Central America, killing estimated
11,000, the greatest loss of life in the western hemisphere from
a tropical system since 1780.
|
| 1997 |
 -Impact
of 1997-1998
ENSO warm event estimated at $25 to $33 billion. -Impact
of 1997-1998
ENSO warm event estimated at $25 to $33 billion.
-Flooding in California and Dakotas cost $6.7 billion.
|
| 1996 |
 -Hurricanes
Bertha and Fran
hit the North Carolina resulting in major flooding. Total damages
in the United States over $3.5 billion. -Hurricanes
Bertha and Fran
hit the North Carolina resulting in major flooding. Total damages
in the United States over $3.5 billion. |
| 1995 |
 -Atlantic
Hurricane Season second busiest hurricane season since 1871. 19
named storms, with 11 of which reached hurricane strength causing
$8 billion in damage. -Atlantic
Hurricane Season second busiest hurricane season since 1871. 19
named storms, with 11 of which reached hurricane strength causing
$8 billion in damage.
-July - Heat
wave hits central US, causing 830 deaths, 525 of them
in Chicago.
-December- Intense storm with heavy rains strikes Pacific Northwest,
causing 6 deaths.
|
| 1994 |

-March- Severe
ice storm in
southeast US causes an estimated $3 billion in damages. |
| 1993 |
 -March-
"Storm
of the Century" hits US east coast with 270 missing,
including 14 in Florida who die in tornadoes. -March-
"Storm
of the Century" hits US east coast with 270 missing,
including 14 in Florida who die in tornadoes.
-Summer- U. S. Midwest Flood of 1993 reported 48 deaths and $18
billion in damages. |
| 1992 |
 -August-
Hurricane
Andrew hits Florida, killing 54, costing $25 billion.
Had the eye of the storm been a few miles further north, downtown
Miami might have been hit and the death toll and destruction far
higher. -August-
Hurricane
Andrew hits Florida, killing 54, costing $25 billion.
Had the eye of the storm been a few miles further north, downtown
Miami might have been hit and the death toll and destruction far
higher.
-Sept. - Hurricane Iniki affects three Hawaiian Islands and results
in over $1 billion in damage.
|
| 1991 |
 -April-
Bangladesh Cyclone kills over 138,000. -April-
Bangladesh Cyclone kills over 138,000.
-October- Typhoon Thelma, hits Philippines and 6000 people die.
-October- Oakland Firestorm kills 25 and costs $2.5 billion
-November- "Halloween Nor'Easter" later called the "Perfect
Storm" develops off Nova Scotia.
|