Annual Coal Report
Next Release Date: October 2008
Executive Summary
Coal production in the United States reached another record level in 2006, ending the year at 1,162.8 million short tons according to data from the Energy Information Administration (Table ES1). Production in 2006 was 31.3 million short tons higher than the prior record set in 2005 of 1,131.5 million short tons. Although coal production rose in 2006, U.S. total coal consumption declined for the year with lower demand by all sectors. Coal consumption decreased in the electric power sector by 1.0 percent, the coking coal sector by 2.0 percent, and the other industrial sector by 1.4 percent. (Note: All percentage change calculations are done at the short-tons level.) The excess production over consumption allowed total coal stocks to increase significantly during the year, as electric generators rebuilt their stockpiles that had fallen substantially in 2005 due to missed shipments in the second half of that year.
The weather in 2006 was the primary driver for the decline in consumption of coal during the year, but the drop was also partially due to declining natural gas prices during the year. Data show that total generation in the electric power sector (electric utilities and independent power producers) in the United States increased slightly in 2006. However, coal-based generation declined, resulting in a 10.8- million-short-ton decrease in coal consumed in the electric power sector. Coal use in the non-electricity sector decreased by 3.2 percent to a level of 85.7 million short tons.
For a third consecutive year, the average delivered price of coal increased in all markets in 2006, but the increases were smaller than those experienced in 2005. In the domestic markets, the delivered price-per-short-ton for electric utilities increased 9.7 percent, while the increase was 6.5 percent for independent power producers. Delivered coking coal prices increased by 10.8 percent, while the delivered price for the other industrial sector increased by 8.5 percent in 2006. The average open market minemouth coal price increased in 2006 by 6.7 percent.
Production
U.S. coal production increased in 2006 by 2.8 percent to reach a record level of 1,162.8 million short tons (Figure ES1 and Table ES1), 31.3 million short tons higher than the 2005 production. Although total U.S. coal production was higher in 2006, not all of the coal-producing regions shared in the increase. Exclusive of refuse production, the Interior and Western Regions had an increase in their production levels in 2006 of 1.5 percent and 5.9 percent respectively, while Appalachian coal production declined by 1.4 percent (Figure ES1 and Table ES1). In the amount of tons of coal produced, the increase in the Western Region production was more than six times the decrease in Appalachian Region production in 2006.
One of the most important aspects for the coal industry in 2006 was the lack of any major transportation issues related to coal moving from the mines to the consumers. Although there were some partial train derailments and sunken barges during the year, and the continuing rail track improvements and river lock repairs that slowed some coal shipments, 2006 was free of the major transportation problem that the coal industry experienced in 2005 (track maintenance work on rail lines in the Powder River Basin).
For the second time in four years, the coal industry was brought to the forefront of the Nation’s consciousness in 2006, as two separate events unfolded which involved coal miners trapped underground. Unfortunately, the tragic results of the 2006 incidents were not the same as in 2002 when the trapped miners were all successfully rescued. In January, two different incidents, both in West Virginia, focused the public’s attention on the dangers that miners face on a daily basis. As a result of these unfortunate events, new legislation requiring improvement in safety in underground mines passed at both the Federal and state levels. For the year 2006, a total of 47 miners died on the job, matching the total number that occurred in 1995, and more than double the 22 killed in 2005.
Appalachian Region
Coal production in the Appalachian Region decreased in 2006 by 5.5 million short tons, to end the year at 391.2 million short tons, a decline of 1.4 percent, making it the fifth year in a row that the region has experienced coal production of less than 400 million short tons. The decrease in 2006 in coal production in the region was in part, a response to the drop in coal consumption for electricity generation, the slight decrease in coal exports, which are primarily produced in the East, and the increase in coal imports, which are in competition with Appalachian production. The decline in the Appalachian Region in 2006 brought the production level down to the 2004 level.
West Virginia, the largest coal-producing State in the Appalachian Region and the second largest in the U.S., decreased its production 0.8 percent in 2006 to end the year with 152.4 million short tons of production, 1.3 million short tons under the 2005 level. The decline in coal production in West Virginia was in part a result of the suspensions of production after accidents that occurred in January at two new mines in the state: Sago and Aracoma mines. Although there were a few new mines in 2006 and a full year’s production from mines that came on line during 2005 (Toney’s Fork, Grapevine South, Camp Branch, and No. 130 mines), those increases in coal production were more than offset by the declines in production at other mines in the State (Upper Big Branch, American Eagle, Harris No. 1, and Alex Energy’s No. 1) in combination with the idling of the Shoemaker mine in April of 2006.
|
||||||||||||||||||||||||||||||||||||||||||||||||||||||||||||||||||||||||||||||||||||||||||||||||||||||||||||||||||||||||||||||||||||||||||||
|
Historical Coal Files
|

Table ES1. U.S. Coal Supply, Disposition, and Prices, 2005-2006 |
||
| Item | 2005 | 2006 |
| Production by Region | ||
| Appalachian | 396.7 | 391.2 |
| Interior | 149.2 | 151.4 |
| Western | 585.0 | 619.4 |
| Refuse Recovery | 0.7 | 0.8 |
| Total | 1,131.5 | 1,162.8 |
| Consumption by Sector | ||
| Electric Power | 1,037.5 | 1,026.6 |
| Coke Plants | 23.4 | 23.0 |
| Other Industrial Plants | 60.3 | 59.5 |
| Residential/Commercial | 4.7R | 3.2 |
| Total | 1,126.0R | 1,112.3 |
| Year-End Coal Stocks | ||
| Electric Power | 101.1 | 141.0 |
| Coke Plants | 2.6 | 2.9 |
| Other Industrial Plants | 5.6 | 6.5 |
| Producers/Distributors | 35.0 | 36.5 |
| Total | 144.3 | 186.9 |
| Average Delivered Price | ||
| Electric Utilities | $31.22 | $34.26 |
| Independent Power Producers | $30.39 | $32.38 |
| Coke Plants | $83.79 | $92.87 |
| Other Industrial Plants | $47.63 | $51.67 |
| Average U.S. Open Market Mine Price | $23.59 | $25.16 |
| R = Revised data. Notes: Totals may not equal sum of components due to independent rounding. Sum of stock changes and consumption may not equal production, primarily because the supply and disposition data are obtained from different surveys. Sources: Energy Information Administration, Annual Coal Report 2006, tables 1; 26; 27; 28; and 34; DOE/EIA-0584 (2006) (Washington, DC, October 2007). |
||
Eastern Kentucky produced 93.6 million short tons of coal in 2006, a slight increase of 0.3 million short tons or 0.3 percent. Although there were six mines in eastern Kentucky that had an increase in coal production of at least a half-a-million short tons, production decreases by numerous other mines mostly offset those increases resulting in a slight increase in annual production. Two mines with lower 2006 coal production in Eastern Kentucky, the Halfway Branch Surface and the Branham mine, were placed into non-producing status during the year. Pennsylvania produced 66.0 million short tons, a decrease of 2.2 percent, or 1.5 million short tons from 2005. The decrease in coal production level at Consol’s Bailey mine and the idling of ANR’s Ridge Deep mine accounted for most of the drop in production in 2006.
Coal production in Virginia increased in 2006, the only state in the Appalachian Region to have substantially higher production than 2005. Virginia produced a total of 29.7 million short tons, an increase of 7.2 percent. The increase in coal production in Virginia was primarily a result of the resumption of production at Consol’s Buchanan mine that had experienced both a fire and later mechanical problems in 2005 that had substantially reduced production. Ohio’s coal production declined in 2006 by 8.1 percent to end the year at 22.7 million short tons. The lower production was a result of the drop in production at Ohio Valley’s Powhatan longwall mine and Consol’s Mahoning Valley No. 36 mine, which only had production in the first quarter of 2006. Coal production decreased in Alabama in 2006 by 11.8 percent to 18.8 million short tons. The Jim Walter Resources No. 4 mine had lower production in 2006 as a result of a longwall move combined with some roof control issues. Production also decreased in 2006 at Drummond’s Shoal Creek mine due to a series of methane ignitions in February that resulted in suspension of production for an extended period of time during the year. Maryland and Tennessee both had slightly decreased coal production in 2006 from their prior year levels.
| Figure ES1. Coal Production by Coal-Producing Region, 2006 (Million Short Tons and Percent Change from 2005) |
Regional totals do not include refuse recovery
U.S. Total: 1,162.8 Million Short Tons (2.8%) 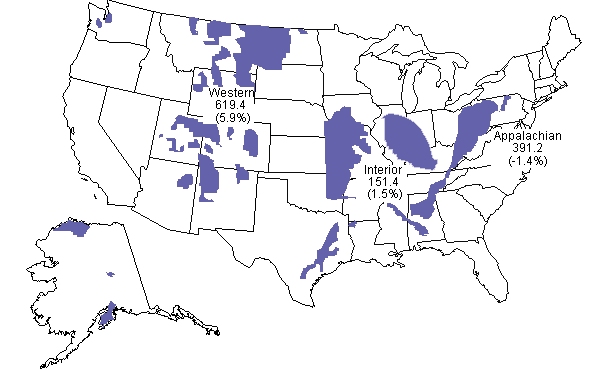 |
| Source: Energy Information Administration, Annual Coal Report, 2006, DOE/EIA-0584(2006) (Washington, DC, October 2007). |
Interior Region
The Interior Region experienced an increase in coal production in 2006 of 2.2 million short tons, or 1.5 percent to achieve a total of 151.4 million short tons, the highest level seen in the region since 1999. The increase in coal production in the Interior Region was primarily a result of the increased coal production in Indiana and Western Kentucky, which accounted for almost two-thirds of the total regional increase. Indiana coal production rose 0.7 million short tons in 2006 to end the year at 35.1 million short tons, an increase of 1.9 percent.
Most of the increase in Indiana’s coal production in 2006 can be attributed to Black Beauty Coal Company’s Miller Creek Mine - Knox Pit that began production in the fourth quarter of 2005. Western Kentucky coal production in 2006 was 27.2 million short tons, an increase of 0.8 million short tons or 3.1 percent. While a few mines in Western Kentucky ceased production in 2006, a full year’s production by two mines that started in the last half of 2005, Advent Mining’s Onton No. 9 and Hopkins County Coal’s Elk Creek mine, accounted for the majority of the production increase for the year.
Texas is the largest coal-producing State in the Interior Region and in 2006 it accounted for slightly less than one-third of the region’s coal production with a total of 45.5 million short tons, a slight decrease of 0.9 percent from 2005. Coal production in Illinois rose by 2.2 percent to end the year at 32.7 million short tons, an increase of 0.7 million short tons. The other States in the Interior Region (Arkansas, Kansas, Louisiana, Mississippi, Missouri, and Oklahoma), which together produced 10.8 million short tons of coal and accounted for a total of 7.1 percent of the entire region’s production in 2006, all fluctuated some from their 2005 coal production levels.
Table ES2. U.S. Coal Production by Coal-Producing Region and State, 2005-2006 |
||
| Coal-Producing Region and State |
2005 | 2006 |
| Appalachian Total | 396.7 | 391.2 |
| Alabama | 21.3 | 18.8 |
| Kentucky, Eastern | 93.3 | 93.6 |
| Maryland | 5.2 | 5.1 |
| Ohio | 24.7 | 22.7 |
| Pennsylvania Total | 67.5 | 66.0 |
| Anthracite | 1.6 | 1.5 |
| Bituminous | 65.8 | 64.5 |
| Tennessee | 3.2 | 2.8 |
| Virginia | 27.7 | 29.7 |
| West Virginia | 153.6 | 152.4 |
| Northern | 42.6 | 42.4 |
| Southern | 111.0 | 110.0 |
| Interior Total | 149.2 | 151.4 |
| Arkansas | s | s |
| Illinois | 32.0 | 32.7 |
| Indiana | 34.5 | 35.1 |
| Kansas | 0.2 | 0.4 |
| Kentucky, Western | 26.4 | 27.2 |
| Louisiana | 4.2 | 4.1 |
| Mississippi | 3.6 | 3.8 |
| Missouri | 0.6 | 0.4 |
| Oklahoma | 1.9 | 2.0 |
| Texas | 45.9 | 45.5 |
| Western Total | 585.0 | 619.4 |
| Alaska | 1.5 | 1.4 |
| Arizona | 12.1 | 8.2 |
| Colorado | 38.5 | 36.3 |
| Montana | 40.4 | 41.8 |
| New Mexico | 28.5 | 25.9 |
| North Dakota | 30.0 | 30.4 |
| Utah | 24.5 | 26.0 |
| Washington | 5.3 | 2.6 |
| Wyoming | 404.3 | 446.7 |
| Refuse Recovery | 0.7 | 0.8 |
| U.S. Total | 1,131.5 | 1,162.8 |
| s Value is less than 0.5 of the table metric, but value is included in any associated totals. Note: Totals may not equal the sum of the components due to independent rounding. Sources: U.S. Department of Labor, Mine Safety and Health Administration, Form 7000-2, “Quarterly Mine Employment and Coal Production Report." |
||
Western Region
Coal production in the Western Region increased in 2006 by 5.9 percent to a total of 619.4 million short tons, and accounted for over 53 percent of total U.S. coal production for the year. The increase of 34.5 million short tons resulted in another record level for the region, the third year in a row that the region achieved a record. Despite the record level of coal production, only four of the nine States in the Western Region had higher production levels in 2006: Montana, North Dakota, Utah, and Wyoming. Wyoming is by far the largest coal-producing State in the Nation, a position it has held since 1988.
In 2006, Wyoming produced 446.7 million short tons of coal, an increase of 42.4 million short tons or 10.5 percent for the year. Although five of the twenty-one mines in Wyoming had slight decreases in coal production in 2006, the increased production levels at the rest of the mines pushed the State to a new record level for the year. The dominance of Wyoming in U.S. coal production is reflected by the fact that the largest mine in the State (and the United States) is the Black Thunder mine which produced 92.7 million short tons in 2006. This Wyoming mine alone produced more coal than 23 other individual coal-producing states. Other examples of Wyoming’s dominance are: in 2006, it accounted for about 72 percent of the Western Region production total; was 55.5 million short tons more than the entire Appalachian Region; was almost three times the Interior Region; and was 38.4 percent of the total U.S. coal production for the year. Also, if the 26 States that produced coal in 2006 were ranked by descending total production levels, Wyoming produced 108.1 million short tons more than the next three largest coal-producing States (West Virginia, Kentucky, and Pennsylvania), and 70.1 million short tons more coal than the summation of the States ranked 5th through 26th. Wyoming was able to transport more coal by rail in 2006. Improved railroad capacity in Wyoming resulted in increased shipments which allowed utilities to rebuild stockpiles during the year and was able to alleviate the pent-up demand caused by the restrictions the railroads experienced during the repair and maintenance work on the southern Powder River Basin (PRB) rail line in 2005.
In 2006, Montana, the second largest coal-producing State in the Western Region, produced a total of 41.8 million short tons, an increase of 3.6 percent. Although there was a decrease in production at Western Energy’s Rosebud mine, the increase in coal production at Spring Creek Coal’s Spring Creek mine due to the completion of an expansion project more than offset the decline. Total coal production in North Dakota increased in 2006 by 1.5 percent to end the year at 30.4 million short tons. Declines in production by two of the four North Dakota mines, Beulah and Center, were offset by increases in the other two mines, Falkirk and Freedom. Coal production in Utah in 2006 increased by 6.1 percent to a level of 26.0 million short tons. The 1.5-million-short-ton increase in Utah was primarily a result of the increase in production at Canyon Fuel’s Skyline No. 3 mine.
Colorado had a decline in coal production in 2006, ending the year with a total of 36.3 million short tons, a decrease of 2.2 million short tons, due in part to the closing of HNR’s Bowie No. 3 mine at the end of 2005 and the idling of Peabody’s Seneca mine at the beginning of 2006. New Mexico had a decrease of 2.6 million short tons in 2006 to end the year with a total of 25.9 million short tons, a decline of 9.1 percent, which was attributable to the decreased production levels at BHP’s Navajo and San Juan South mines. Coal production in 2006 in Alaska was 1.4 million short tons, slightly below the prior year total.
Arizona and Washington both had major declines in coal production in 2006 as a consequence of mine closures. Coal production in Arizona in 2006 was 8.2 million short tons, a decrease of 3.9 million short tons, or 31.9 percent. This decline was due to the idling of the Peabody’s Black Mesa mine which had provided coal to the jointly-owned Mohave electric generation facility that closed at the end of 2005, due to an agreement with several organizations that required the plant to install environmental equipment or cease operation. Coal production in Washington in 2006 declined by 51.0 percent to 2.6 million short tons. The only mine in the State, TransAlta’s Centralia mine, had deteriorating mining conditions and escalating mining costs that resulted in the company deciding to close the mine at the end of November 2006.
Employment
The number of employees in U.S. coal mines increased in 2006 by 4.6 percent to a level of 82,959. Increases in the number of employees were experienced in both underground and surface mining in 2006 at the national level. The largest increase in total employees in a State was in West Virginia, which added 1,465 employees to the payroll. However, not all States had increases in the number of total employees working in 2006. Arizona had the biggest decrease in employment as one of the two mines in the State shut down at the end of 2005 resulting in a decline of 149 employees.
Productivity
Productivity at coal mines in 2006 decreased by 1.5 percent to a level of 6.26 tons per miner per hour. Although total productivity declined for the year, surface productivity actually increased from 2005 by 1.5 percent to a level of 10.19 short tons per miner per hour. Underground productivity dropped in 2006 by 7.0 percent to a level of 3.37 short tons per miner per hour resulting in the decrease in total productivity for the year. Part of the decline in underground productivity was a result of miners having increasing hours used in safety and health work in compliance with the MINER Act of 2006 that affected the ability to mine coal.
Changes in regional productivity varied across the U.S. in 2006, with the largest decline in the Appalachian Region and the smallest in Western Region. Total productivity in the Appalachian Region decreased by 4.6 percent in 2006 to a level of 3.13 short tons per miner per hour. This drop was a reflection of the decrease in underground productivity in the region, which declined by 7.6 percent, while the surface productivity actually increased slightly by 0.4 percent in 2006. Total productivity in the Interior Region declined by 3.7 percent to a level of 5.10 short tons per miner per hour in 2006, with declines in both underground and surface productivity. Underground productivity in the Interior Region decreased in 2006 by 4.3 percent to a level of 3.54 short tons per miner per hour while surface productivity decreased by 1.0 percent to a level of 7.35 short tons per miner per hour. Reflecting the large number of surface mines in the region, the Western Region had the smallest drop in total productivity in 2006, 1.4 percent to 20.19 short tons per miner per hour. Productivity in underground mines in the Western Region dropped by 10.1 percent to 6.77 short tons per miner per hour, while surface productivity increased slightly by 0.3 percent to a level of 25.70 short tons per miner per hour.
| Figure ES2. Electric Power Sector Consumption of Coal by Census Division, 2006 (Million Short Tons and Percent Change from 2005) |
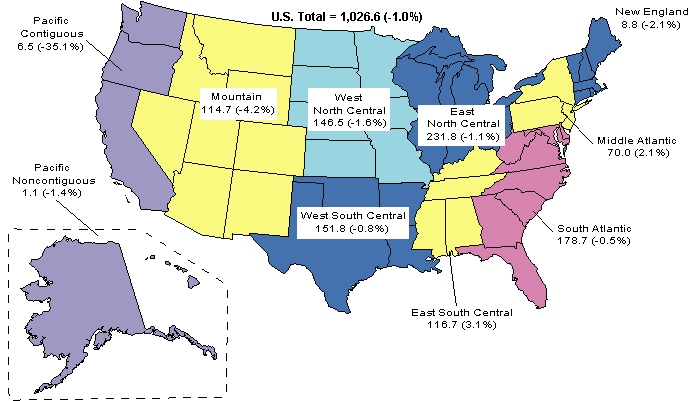 |
| Source: Energy Information Administration, Form EIA-906, “Power Plant Report.” |
Consumption
The combination of moderate weather and declining natural gas prices resulted in lower coal consumption in the electric power sector, which in turn reduced total coal consumption in the United States in 2006. Total U.S. coal consumption decreased 13.7 million short tons to a level of 1,112.3 million short tons, a decline of 1.2 percent. The electric power sector (electric utilities and independent power producers) accounts for about 92 percent of all coal consumed in the United States and is the driving force for the Nation’s coal consumption. The other coal consuming sectors (coking coal, other industrial, and residential and commercial sectors) had minor changes in their consumption totals. The other industrial sector had a decrease in coal consumption in 2006 of 1.4 percent, while the coking coal sector had a decrease of 2.0 percent. The residential and commercial sector (which is the smallest of all coal consuming sectors, accounting for less than one-half of one percent of total consumption), declined by 1.5 million short tons in 2006.
Coal consumption in the electric power sector decreased by 1.0 percent or 10.8 million short tons to end 2006 at 1,026.6 million short tons (Figure ES2). However, coal-based generation decreased at a slightly higher rate of 1.1 percent for the year. This apparent inconsistency is explained by the increased usage of lower-Btu western coals (subbituminous and lignite) to generate electricity.
Generation
Nationally, total generation in the electric power sector from all fuels increased marginally in 2006 by 0.2 percent. However, there were substantial gains in electricity generation by natural gas and hydroelectric generation facilities in the United States (Figure ES3). The increase of 7.4 percent in electricity generation by hydroelectric facilities in the United States was a direct result of the increased precipitation during the year. The increase in electric generation by natural gas plants of 7.5 percent in 2006 was due in part to the decreasing costs of natural gas during the year combined with the numerous new gas-fired generating facilities that opened during the last several years. In 2006, 71 percent of the new capacity to come on line during the year was natural gas-fired, while new coal-fired capacity was less than 5 percent. The average cost of natural gas delivered to the electricity sector in 2006 compared to 2005 decreased by 15.7 percent, while the cost of coal increased by 8.9 percent in the same time period although the average cost of coal continued to be much lower than that of natural gas.
There are two major factors that influence total electric generation: economic growth and weather. Even though economic growth continued throughout 2006, with the gross domestic product (GDP) of the United States increasing by 3.3 percent for the year, the moderate weather across the country for most of the year was enough to dampen the demand for electricity. According to data from the National Weather Service Climate Prediction Center of the National Oceanic and Atmospheric Administration (NOAA), compared to 2005, cooling degree-days in 2006 were slightly lower for the country as a whole (2.4 percent), while heating degree-days were 8.0 percent lower. Although the summer weather in 2006 was hotter than normal (30-year average) for the Nation by 15.8 percent, the winter weather (warmest January ever recorded) was warmer than normal and the heating degree-days for 2006 were 13.3 percent below normal.
| Figure ES3. Share of Electric Power Sector Net Generation by Energy Source, 2005 vs. 2006 |
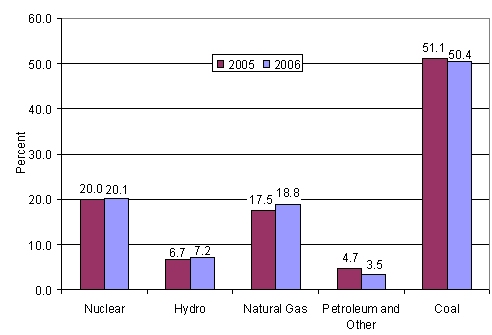 |
| Source: Energy Information Administration, Form EIA-906, "Power Plant Report." |
Of the nine Census Divisions, coal is less than 20 percent of the fuel mix for electricity generation in two divisions, New England and Pacific, and more than 50 percent of the fuel mix in five divisions, East North Central, West North Central, South Atlantic, East South Central, and Mountain. In the other two divisions, coal is one of two main fuel sources for the electric power sector. In the Middle Atlantic, coal competes with nuclear power for dominance, while in the West South Central coal competes with natural gas.
Seven of the nine Census Divisions had decreases in coal consumption in the electric power sector in 2006, with six of those seven having a decline of at least half a million short tons. One of the Census Divisions, the Mountain, accounted for almost 50 percent of the decrease in total coal consumption in the electric power sector. Total generation in the Mountain Census Division increased slightly in 2006 by 0.9 percent (Table ES3). Coal is the primary fuel for electricity generation in the Mountain division and it accounted for 60.0 percent of total generation for the year. The combination of increases in generation of both natural gas, up 15.2 percent, and hydroelectric facilities, up 14.8 percent in 2006, resulted in a decline in coal consumption for the division of 5.0 million short tons, a drop of 4.2 percent.
The Pacific Census Division (Pacific Contiguous and Pacific Non-contiguous) was one of five divisions to have an increase in total generation in the electric power sector in 2006, increasing by 7.9 percent. However, coal is a small portion of total generation, usually less than 5 percent. Even though coal is such a small part of the total generation for the division, the decrease in coal consumption for the electric power sector was the second-largest in the Nation in 2006. Total coal consumption for the electric power sector in the Pacific Census Division declined by 3.5 million short tons or 31.6 percent. Increases in generation by natural gas and hydroelectric facilities in the division of 9.6 percent and 17.4 percent respectively, helped push down the need for coal to generate electricity. In the East North Central Census Division, coal accounts for about 70 percent of total generation in the electric power sector. For 2006, total electricity generation in this division decreased by 1.9 percent from the 2005 level, while the coal-based generation declined by 1.6 percent. The drop in coal-based generation resulted in a decrease in coal consumption for the electric power sector of 2.6 million short tons for the year.
In the West North Central Census Division, where coal accounts for about three-fourths of generation, total generation in the electric power sector in 2006 was about the same as the prior year, increasing by 0.6 percent. However, a large increase in generation by nuclear plants resulted in a decrease in generation by coal plants. Total coal-fired generation in the West North Central division declined by 1.0 percent while coal consumption for generation decreased by 1.6 percent, or 2.4 million short tons. In the West South Central Census Division coal competes with natural gas as the primary fuel for electricity generation, both typically accounting for over 40 percent of total generation. In 2006, total generation in the West South Central division increased by 0.6 percent, with natural gas generation increasing by 0.3 percent and nuclear-powered generation increasing by 8.3 percent. As a consequence of the increases in generation by those fuels in the division, coal-based generation declined by 0.3 percent with coal consumption for electric power generation decreasing in 2006 by 1.2 million short tons.
In the South Atlantic Census Division total generation in the electric power sector declined in 2006 by 1.6 percent. Coal typically accounts for over half of the generation in the South Atlantic division and in 2006 coal-based generation decreased by 0.4 percent resulting in a decrease in coal consumption for electric power generation of 0.8 million short tons. Coal accounts for less than one-sixth of total generation in the New England Census Division, and in 2006 total coal consumption for electricity generation decreased by 0.2 million short tons, or 2.1 percent.
| Table ES3. Electric Power Sector Net Generation, 2005-2006 (Million Kilowatthours) |
||||
| Census Division | 2005 | 2006 | Percent Change | |
| New England | ||||
Coal |
20,220 | 19,375 | -4.2 | |
Total |
129,550 | 125,446 | -3.2 | |
| Middle Atlantic | ||||
Coal |
151,190 | 152,166 | 0.6 | |
Total |
418,614 | 413,932 | -1.1 | |
| East North Central | ||||
Coal |
459,062 | 450,664 | -1.8 | |
Total |
651,726 | 637,690 | -2.2 | |
| West North Central | ||||
Coal |
230,271 | 227,636 | -1.1 | |
Total |
299,713 | 300,897 | 0.4 | |
| South Atlantic | ||||
Coal |
424,999 | 424,602 | -0.6 | |
Total |
801,066 | 786,645 | -1.8 | |
| East South Central | ||||
Coal |
241,173 | 245,857 | 1.9 | |
Total |
367,904 | 368,924 | 0.3 | |
| West South Central | ||||
Coal |
227,675 | 226,512 | -0.5 | |
Total |
540,497 | 543,215 | 0.5 | |
| Mountain | ||||
Coal |
219,829 | 208,844 | -5.0 | |
Total |
345,705 | 348,284 | 0.7 | |
| Pacific | ||||
Coal |
17,641 | 12,399 | -29.7 | |
Total |
347,415 | 373,912 | 7.6 | |
| U.S. Total | ||||
Coal |
1,992,060 | 1,966,054 | -1.3 | |
Total |
3,902,192 | 3,898,945 | -0.1 | |
| Source: Energy Information Administration, Form EIA-906, "Power Plant Report." | ||||
Of the two Census Divisions (the East South Central and the Middle Atlantic) that had increases in coal consumption for electricity generation, the East South Central Division accounted for 70 percent of the total increase. Coal is the primary fuel for generation in the East South Central division, typically accounting for over two-thirds of total generation in a year, while nuclear power accounts for just under 20 percent. Total electricity generation in the East South Central division increased slightly by 0.5 percent in 2006. Nuclear power generation declined in the division by 3.7 percent while coal-based generation increased by 2.1 percent for the year. This resulted in an increase in coal consumption of 3.5 million short tons over the 2005 level.
The Middle Atlantic Census Division had a decrease in electric power sector generation in 2006 of 0.8 percent. Natural gas generation increased by 24.2 percent while coal-based generation increased by only 0.8 percent in 2006. This resulted in an increase in coal consumption for electric power generation in the Middle Atlantic division of 1.5 million short tons.
Coal consumption in the non-electric power sector declined in 2006. Coal consumption at coke plants decreased by 0.5 million short tons to end the year at 23.0 million short tons, a decline of 2.0 percent. Although there was a decline in U.S. coke production in 2006 due to a slowing in the demand for coke both domestically and internationally, a previously announced expansion at the newest coke plant (another 100 batteries to be built) is still planned but the start of the construction has been delayed.
Although the Gross Domestic Product grew by 3.3 percent, the economic growth did not extend into the entire manufacturing sector in 2006, and as a result, coal consumption in the other industrial sector decreased by only 0.9 million short tons to end the year at 59.5 million short tons. The increases in coal consumption in 2006 experienced in some of the manufacturing sectors (nonmetallic mineral products and primary metal manufacturing) offset the decreases in other manufacturing sectors (food, beverage, textile, paper, chemical, fabricated metal, and transportation equipment). Coal consumption in the residential and commercial sector decreased in 2006.
Coal Prices
For the third consecutive year, coal prices rose across the board. The average open market f.o.b. (free on board) mine price increased in 2006 to $25.16 per ton, an increase of 6.7 percent over 2005, a price level not seen since the mid-1980’s. Even though spot coal prices for some of the producing regions declined in 2006, average delivered prices in the consuming sectors increased for the year. The majority of coal sold in the electric power sector is through long-term contracts, in conjunction with spot purchases to supplement the demand. Average delivered coal prices at electric utilities (a subset of the electric power sector) increased for a sixth consecutive year, to $34.26 per short ton ($1.69 per million Btu), an increase of 9.7 percent over the 2005 price. Delivered coal prices at independent power producers increased to $32.38 per short ton ($1.68 per million Btu), an increase of 6.8 percent. The delivered price of coal to the other coal-consuming sectors also increased in 2006. The average delivered price of coal to the other industrial sector increased by 8.5 percent to an average price of $51.67 per short ton in 2006. However, the largest increase in consumer prices was in the coking coal sector. The limited availability and the tight specifications needed for coal to produce coke influence the price. High international prices for metallurgical coal in 2006 also affected prices in the U.S. market. In 2006 the average delivered price of coal to U.S. coke plants increased by 10.8 percent to reach an average price of $92.87 per short ton.
Coal Stocks
Total coal stocks at the end of 2006 were 186.9 million short tons, an increase of 42.6 million short tons from the prior year. Coal stocks held by producers and distributors increased by 1.6 million short tons. Industrial users, including coke plants, held a total of 9.4 million short tons at the end of 2006, 1.2 million short tons more than the level at the start of the year. Coal stocks in the electric power sector, which by the end of 2005 had dropped to its lowest level since 1997, increased substantially in 2006. As no atypical transportation problems arose during the year, coal stocks in the electric power sector increased by 39.8 million short tons, or 39.4 percent to end 2006 at a level of 141.0 million short tons.