|
 |
 |
| Home | News | Organization |
|
|
Station List Observations Recent Historical Obs Search Ship Obs Report NOAA Obs APEX DART MMS ADCP TAO DODS HF Radar OSMC Dial-A-Buoy RSS Feeds Email Access Station Status NDBC Maintenance NDBC Platforms Partner Platforms Program Info About NDBC Met/Ocean Moored Buoy C-MAN TAO DART VOS CSP IOOS DAC Publications Hurricane Data Plots Mariners Weather Log Observing Handbook No. 1 Science Education FAQ Contact Us Links |
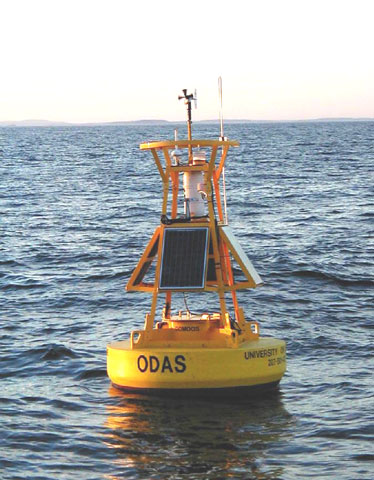
Station 44032 - Buoy E0104 - Central Maine Shelf
|
||||||||||||||||||||||||||||||||||||||||||||||||||||||||||||||||||||||||||||||||||||||||||||||||||||||||||||||||||||||||||||||||||||||||||||||||||||||||||||||||||||||||||||||||||||||||||||||||||||||||||||||||||||||||||||||||||||||||||||||||||||||||||||||||||||||||||||||||||||||||||||||||||||||||||||||||||||||||||||||||||||||||||||||||||||||||||||||||||||||||||||||||||||||||||||||||||||||||||||||||||||||||||||||||||||||||||||||||||||||||||||||||||||||||||||||||||||||||||||||||||||||||||||||||||||||||||||||||||||||||||||||||||||||||||||||||||||||||||||||||||||||||||||||||||||||||||||||||||||||||||||||||||||||||||||||||||||||||||||||||||||||||||||||||||||||||||||||||||||||||||||||||||||||||||||||||||||||||||||||||||||||||||||||||||||||||||||||||||||||||||||
Owned and maintained by Gulf of Maine Ocean Observing System Caution: Right whales may be active in northeast waters year-round. NOAA recommends vessels reduce speeds below 10 knots, when consistent with safe navigation. For latest sightings, go to: http://rwhalesightings.nefsc.noaa.gov/ Meteorological Observations from Nearby Stations and Ships |
|
Click on the graph icon in the table below to see a time series plot of the last five days of that observation. | ||
 | Wind Direction (WDIR): | SSW ( 210 deg true ) |
| Wind Speed (WSPD): | 9.7 kts |
| Wind Gust (GST): | 11.7 kts |
| Wave Height (WVHT): | 2.6 ft |
| Dominant Wave Period (DPD): | 11 sec |
| Atmospheric Pressure (PRES): | 30.05 in |
| Pressure Tendency (PTDY): | -0.04 in ( Falling ) |
| Air Temperature (ATMP): | 59.4 °F |
| Water Temperature (WTMP): | 59.4 °F |
| Visibility (VIS) (0 to 1.9 mi): | 1.2 mi |
| Combined plot of Wind Speed, Gust, and Air Pressure | |
| MM | DD | TIME (EDT) | WDIR | WSPD kts |
GST kts |
WVHT ft |
DPD sec |
APD sec |
MWD | PRES in |
PTDY in |
ATMP °F |
WTMP °F |
DEWP °F |
SAL psu |
VIS mi |
TIDE ft | |
|---|---|---|---|---|---|---|---|---|---|---|---|---|---|---|---|---|---|---|
| 09 | 17 | 4:04 pm | SSW | 9.7 | 11.7 | 2.0 | 11 | - | - | 30.05 | -0.04 | 59.2 | 59.4 | - | - | 1.9 | - | |
| 09 | 17 | 3:04 pm | SSW | 9.7 | 11.7 | 2.0 | 11 | - | - | 30.06 | -0.05 | 59.2 | 59.7 | - | 31.00 | 1.9 | - | |
| 09 | 17 | 2:04 pm | S | 7.8 | 7.8 | 2.0 | 11 | - | - | 30.09 | -0.03 | 58.8 | 60.1 | - | 31.00 | 1.9 | - | |
| 09 | 17 | 1:04 pm | S | 5.8 | 5.8 | 2.0 | 11 | - | - | 30.09 | -0.04 | 58.8 | 59.7 | - | 31.00 | 1.9 | - | |
| 09 | 17 | 12:04 pm | S | 5.8 | 5.8 | 2.0 | 11 | - | - | 30.11 | -0.02 | 58.3 | 59.9 | - | - | 1.9 | - | |
| 09 | 17 | 11:04 am | S | 3.9 | 3.9 | 1.6 | 11 | - | - | 30.12 | -0.01 | 57.2 | 59.2 | - | 31.10 | 1.9 | - | |
| 09 | 17 | 10:04 am | - | 0.0 | 1.9 | 2.0 | 11 | - | - | 30.13 | - | 55.8 | 58.6 | - | 31.10 | 0.7 | - | |
| 09 | 17 | 9:04 am | N | 3.9 | 5.8 | 1.6 | 11 | - | - | 30.13 | - | 55.0 | 58.5 | - | 31.10 | 1.4 | - | |
| 09 | 17 | 8:04 am | NNE | 1.9 | 3.9 | 2.0 | 11 | - | - | 30.13 | +0.01 | 56.3 | 58.1 | - | 31.00 | 1.9 | - | |
| 09 | 17 | 7:04 am | N | 3.9 | 5.8 | 1.6 | 11 | - | - | 30.13 | +0.00 | 57.0 | 57.9 | - | 30.90 | 1.9 | - | |
| 09 | 17 | 6:04 am | N | 3.9 | 5.8 | 1.6 | 11 | - | - | 30.12 | +0.00 | 56.8 | 57.9 | - | 30.90 | 1.9 | - | |
| 09 | 17 | 5:04 am | NNW | 1.9 | 3.9 | 2.0 | 11 | - | - | 30.12 | - | 57.0 | 57.9 | - | 30.90 | 1.9 | - | |
| 09 | 17 | 4:04 am | - | 0.0 | 1.9 | - | - | - | - | 30.12 | +0.00 | 57.4 | - | - | - | 1.9 | - | |
| 09 | 17 | 3:04 am | SW | 1.9 | 3.9 | 1.6 | 11 | - | - | 30.12 | +0.00 | 57.6 | 58.5 | - | 31.10 | 1.9 | - | |
| 09 | 17 | 2:04 am | WSW | 3.9 | 3.9 | 1.6 | 6 | - | - | 30.12 | +0.00 | 57.6 | 58.3 | - | 31.10 | 1.9 | - | |
| 09 | 17 | 1:04 am | SSW | 5.8 | 5.8 | 1.6 | 8 | - | - | 30.12 | -0.01 | 57.6 | 58.3 | - | - | 1.9 | - | |
| 09 | 17 | 12:04 am | SSW | 5.8 | 5.8 | 1.3 | 6 | - | - | 30.12 | -0.02 | 57.4 | 58.3 | - | 31.20 | 1.9 | - | |
| 09 | 16 | 11:04 pm | S | 5.8 | 7.8 | 1.3 | 6 | - | - | 30.13 | +0.00 | 57.0 | 58.3 | - | 31.20 | 1.9 | - | |
| 09 | 16 | 10:04 pm | S | 7.8 | 7.8 | 1.6 | 6 | - | - | 30.14 | +0.02 | 57.0 | 58.3 | - | 31.20 | 1.9 | - | |
| 09 | 16 | 9:04 pm | S | 7.8 | 9.7 | 1.6 | 6 | - | - | 30.14 | +0.04 | 57.2 | 58.3 | - | - | 1.9 | - | |
| 09 | 16 | 8:04 pm | S | 9.7 | 11.7 | 1.6 | 6 | - | - | 30.13 | +0.02 | 57.2 | 58.5 | - | - | 1.9 | - | |
| 09 | 16 | 7:04 pm | S | 9.7 | 11.7 | 1.6 | 6 | - | - | 30.12 | +0.01 | 57.2 | 58.8 | - | 31.10 | 1.9 | - | |
| 09 | 16 | 6:04 pm | S | 7.8 | 7.8 | 1.6 | 6 | - | - | 30.10 | -0.01 | 57.7 | 58.8 | - | 31.10 | 1.9 | - | |
| 09 | 16 | 5:04 pm | SSW | 5.8 | 7.8 | 1.6 | 8 | - | - | 30.11 | -0.01 | 57.7 | 59.0 | - | 31.10 | 1.9 | - |
|
These oceanographic data are displayed in rounded times. Click on the graph icon in the table below to see a time series plot of the last five days of that observation. | ||
| Depth (DEPTH): | 3.3 ft | |
| Ocean Temperature (OTMP): | 59.72 °F |
| Salinity (SAL): | 31.00 psu |
| MM | DD | TIME (EDT) |
DEPTH ft |
OTMP °F |
COND mS/cm |
SAL psu |
O2% % |
O2PPM ppm |
CLCON ug/l |
TURB FTU |
PH | EH mv |
|---|---|---|---|---|---|---|---|---|---|---|---|---|
| 09 | 17 | 2:00 pm | 3.3 | 60.08 | - | 31.00 | - | - | - | - | - | - |
| 09 | 17 | 1:00 pm | 3.3 | 59.72 | - | 31.00 | - | - | - | - | - | - |
| 09 | 17 | 11:00 am | 3.3 | 59.18 | - | 31.10 | - | - | - | - | - | - |
| 09 | 17 | 10:00 am | 3.3 | 58.64 | - | 31.10 | - | - | - | - | - | - |
| 09 | 17 | 9:00 am | 3.3 | 58.46 | - | 31.10 | - | - | - | - | - | - |
| 09 | 17 | 8:00 am | 3.3 | 58.10 | - | 31.00 | - | - | - | - | - | - |
| 09 | 17 | 7:00 am | 3.3 | 57.92 | - | 30.90 | - | - | - | - | - | - |
| 09 | 17 | 6:00 am | 3.3 | 57.92 | - | 30.90 | - | - | - | - | - | - |
| 09 | 17 | 5:00 am | 3.3 | 57.92 | - | 30.90 | - | - | - | - | - | - |
| 09 | 17 | 3:00 am | 3.3 | 58.46 | - | 31.10 | - | - | - | - | - | - |
| 09 | 17 | 2:00 am | 3.3 | 58.28 | - | 31.10 | - | - | - | - | - | - |
| 09 | 17 | 12:00 am | 3.3 | 58.28 | - | 31.20 | - | - | - | - | - | - |
| 09 | 16 | 11:00 pm | 3.3 | 58.28 | - | 31.20 | - | - | - | - | - | - |
| 09 | 16 | 10:00 pm | 3.3 | 58.28 | - | 31.20 | - | - | - | - | - | - |
| 09 | 16 | 7:00 pm | 3.3 | 58.82 | - | 31.10 | - | - | - | - | - | - |
| 09 | 16 | 6:00 pm | 3.3 | 58.82 | - | 31.10 | - | - | - | - | - | - |
| 09 | 16 | 5:00 pm | 3.3 | 59.00 | - | 31.10 | - | - | - | - | - | - |
Links which are specific to this station are listed below:
Real Time Data in tabular form for the last forty-five days.
Historical Data & Climatic Summaries for quality controlled data for the current month, previous months, and previous years.
| U.S. Dept. of Commerce National Oceanic and Atmospheric Administration National Weather Service National Data Buoy Center 1007 Balch Blvd. Stennis Space Center, MS 39529 Feedback Page last modified: September 5, 2008 |
Disclaimer Credits Glossary |
Privacy Policy About Us Career Opportunities |