|
 |
 |
| Home | News | Organization |
|
|
Station List Observations Recent Historical Obs Search Ship Obs Report NOAA Obs APEX DART MMS ADCP TAO DODS HF Radar OSMC Dial-A-Buoy RSS Feeds Email Access Station Status NDBC Maintenance NDBC Platforms Partner Platforms Program Info About NDBC Met/Ocean Moored Buoy C-MAN TAO DART VOS CSP IOOS DAC Publications Hurricane Data Plots Mariners Weather Log Observing Handbook No. 1 Science Education FAQ Contact Us Links |
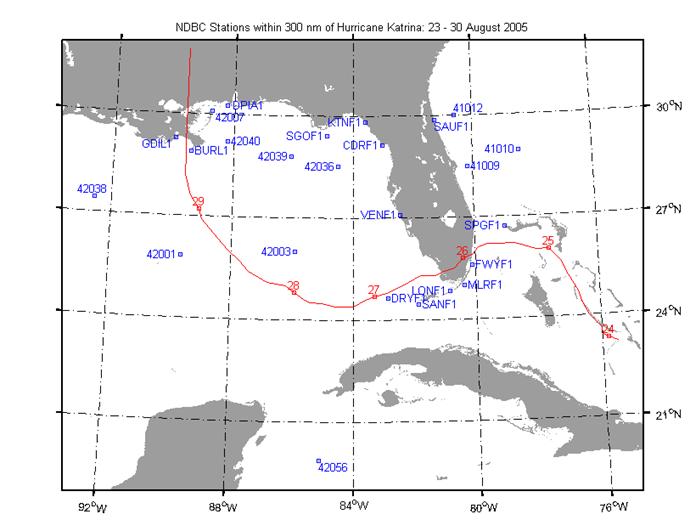
Reports from the National Data Buoy Center's Stations in the Gulf of Mexico During the Passage of Hurricane Katrina27-30 August 2005This report provides a summary of some of the wind speed parameters, the sea-level pressure, and wave parameter reports from the National Data Buoy Center's (NDBC) stations in the Gulf of Mexico in the vicinity of Hurricane Katrina's track.
Figure 1: Hurricane Katrina's Track and NDBC Stations. Katrina's track (in red with the start of each day numbered) is from the current positions of the National Hurricane Center's Forecasts/Advisories Wind Speed: For stations in this report, wind speed is sampled at a rate of 1.0 Hz. For the Coastal-Marine Automated Network (C-MAN) stations, BURL1 and GDIL1, wind speeds are reported in knots to a resolution of 0.1 knots. C-MAN wind speeds have been converted to meters per second (m/s) for this report, where 1 m/s = 1.94 knots. For the buoy stations (42003, 42040, and 42007) wind speeds are reported in meters per second to a resolution of 0.1 m/s. For the plot legends: CWS: The average wind speed over a 10-minute period at the anemometer height. In this report, data are plotted at the time of the end of the valid 10-minute period. MXGT1: The Peak 5-second gust during the past hour at the anemometer height. The time of MXGT1 is reported to the nearest minute, however, in this report data are plotted at the valid time of the hourly report. Pressure: For stations in this report, pressure is sampled at a rate of 1.0 Hz and reported to a resolution of 0.1 hectoPascal (hPa). For the plot legends: BARO1: Sea-level Pressure. Coastal-Marine Automated Network (C-MAN) stations, BURL1 and GDIL1, average the pressure over 2 minutes. The buoy stations (42003, 42040, and 42007) average the pressure over 8-minutes. Wave: For stations 42001, 42003, and 42038, the wave sampling period is 40 minutes and sampled at a rate of 1.7066 Hz. For stations 42036, 42040, 42007, and 42039 the wave sampling period is 20 minutes at a sampling rate of 2.0 Hz. WVHGT: The significant wave height that represents the average of the highest one-third of the waves during the wave sampling period. DOMPD: The Dominant Period that represents the wave period (time from between consecutive passes of the wave crests) of the waves with the most energy. Closest Point of Approach (CPA): Time, bearing (degrees True), and distance (nautical miles) from the station to Hurricane Katrina at CPA are computed using the positions from the National Hurricane Center's advisories that have been interpolated to hourly values for positions, wind speed (intensity), and central pressure.
Figure 2: Station 42003: Winds (Anemometer Height 10m) and Sea-level Pressure
Figure 3: Station 42003: Significant Wave Height and Dominant Period Data was lost after 08/28/05Z because the buoy capsized. This is this first capsizing of a 10-meter buoy in the Gulf of Mexico in NDBC's 30-year history of operation.
Link to Station Page: http://www.ndbc.noaa.gov/station_page.php?station=42003
Figure 4: Station BURL1: Winds (Anemometer Height 30.5 m) and Sea-level Pressure BURL1 (Southwest Pass Louisiana) failed after 08/29/06Z because of storm surge.
Link to Station Page: http://www.ndbc.noaa.gov/station_page.php?station=BURL1
Figure 5: Station GDIL1: Winds (Anemometer Height 15.8 m) and Sea-level Pressure GDIL1 (Grand Isle Louisiana) anemometers failed about 08/29/10Z.
Link to Station Page: http://www.ndbc.noaa.gov/station_page.php?station=GDIL1
Figure 6: Station 42040: Winds (Anemometer Height 5m) and Sea-level Pressure
Figure 7: Station 42040: Significant Wave Height and Dominant Period Station 42040, located at 29°11'03"N 88°12'48"W approximately 64 nautical miles south of Dauphin Island Alabama, reported a significant wave height of 16.91 meters (55.5 feet) at 1100 UTC, August 29, 2005. Station 42040 is a 3-meter diameter discus hull buoy deployed and operated by National Oceanographic and Atmospheric Administration's National Data Buoy Center (NDBC). Although 42040 does not measure maximum wave heights, the maximum wave height may be statistically approximated by 1.9 times the significant wave height (World Meteorological Organization, 1998), which would be 32.1 meters (105 feet). At the time of the report, Hurricane Katrina was approximately 73 nautical miles to the west of 42040 with maximum sustained winds of 145 miles per hour (Public Advisory 26A issued by the National Hurricane Center). In addition to the 55-foot report, 42040 reported seas 12 feet or greater for 47 consecutive hours. The 55-foot report surpasses the previous highest significant wave height reported by an NDBC buoy in the Gulf of Mexico of 15.96 meters (52 feet), also reported by 42040 during Hurricane Ivan in September 2004, and matches the previous highest significant wave height reported by an NDBC buoy of 16.91 meters reported by station 46003 (in the Northeast Pacific Ocean south of the Aleutian Islands) in January 1991. References: Public Advisory 26A is available at http://www.nhc.noaa.gov/archive/2005/pub/al122005.public_a.026.shtml World Meteorological Organization, 1998. Guide to Wave Analysis and Forecasting (2nd Edition), WMO No-702, Geneva, p10.
Link to Station Page: http://www.ndbc.noaa.gov/station_page.php?station=42040
Figure 8: Station 42007: Winds (Anemometer Height 5m) and Sea-level Pressure
Figure 9: Station 42007: Significant Wave Height and Dominant Period Station 42007 broke its mooring and went adrift after 08/29 05Z. Data reported after the buoy went adrift are not archived in the monthly historical files, but are provided here for information.
Link to Station Page: http://www.ndbc.noaa.gov/station_page.php?station=42007
|