|
 |
 |
| Home | News | Organization |
|
|
Station List Observations Recent Historical Obs Search Ship Obs Report NOAA Obs APEX DART MMS ADCP TAO DODS HF Radar OSMC Dial-A-Buoy RSS Feeds Email Access Station Status NDBC Maintenance NDBC Platforms Partner Platforms Program Info About NDBC Met/Ocean Moored Buoy C-MAN TAO DART VOS CSP IOOS DAC Publications Hurricane Data Plots Mariners Weather Log Observing Handbook No. 1 Science Education FAQ Contact Us Links |
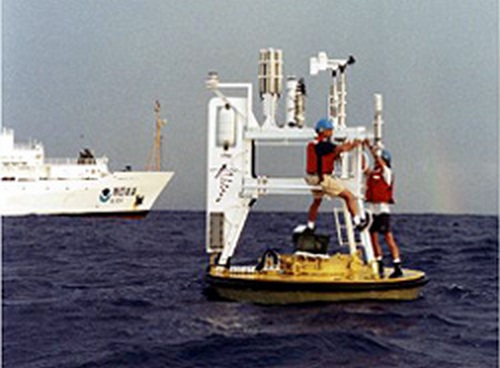
Station 41NT0 - NTAS - Northwest Tropical Atlantic
|
|||||||||||||||||||||||||||||||||||||||||||||||||||||||||||||||||||||||||||||||||||||||||||||||||||||||||||||||||||||||||||||||||||||||||||||||||||||||||||||||||||||||||||||||||||||||||||||||||||||||||||||||||||||||||||||||||||||||||||||||||||||||||||||||||||||||||||||||||||||||||||||||||||||||||||||||||||||||||||||||||||||||||||||||||||||||||||||||||||||||||||||||||||||||||||||||||||||||||||||||||||||||||||||||||||||||||||||||||||||||||||||||||||||||||||||||||||||||||||||||||||||||||||||||||||||||||||||||||||||||||||||||||||||||||||||||||||||||||||||||||||||||||||||||||||||||||||||||||||||||||||||||||||||||||||||||||||||||||||||||||||||||||||||||||||||||||||||||||||||||||||||||||||||||||||||||||||||||||||||||||||||||||||||||||||||||||||||||||||||||||||||||||||||||||||||||||||||||||||||||||||||||||||||||||||||||||||||||||||||||||||||||||||||||||||||||||||||||||||||||||||||||||||||||||||||||||||||||||||||||||||||||||||||||
Owned and maintained by Woods Hole Oceanographic Institution |
|
Click on the graph icon in the table below to see a time series plot of the last five days of that observation. | ||
 | Wind Direction (WDIR): | ENE ( 70 deg true ) |
| Wind Speed (WSPD): | 15.5 kts |
| Atmospheric Pressure (PRES): | 29.88 in |
| Air Temperature (ATMP): | 83.3 °F |
| Water Temperature (WTMP): | 83.8 °F |
| Salinity (SAL): | 36.70 psu |
| Dew Point (DEWP): | 74.7 °F |
| Heat Index (HEAT): | 90.5 °F |
| Combined plot of Wind Speed, Gust, and Air Pressure | |
| MM | DD | TIME (GMT) | WDIR | WSPD kts |
GST kts |
WVHT ft |
DPD sec |
APD sec |
MWD | PRES in |
PTDY in |
ATMP °F |
WTMP °F |
DEWP °F |
SAL psu |
VIS mi |
TIDE ft | |
|---|---|---|---|---|---|---|---|---|---|---|---|---|---|---|---|---|---|---|
| 09 | 17 | 1500 | ENE | 15.5 | - | - | - | - | - | 29.91 | - | 83.3 | 83.7 | 74.8 | 36.80 | - | - | |
| 09 | 17 | 1400 | ENE | 13.6 | - | - | - | - | - | 29.94 | - | 83.5 | 83.7 | 74.1 | 36.70 | - | - | |
| 09 | 17 | 1300 | ENE | 13.6 | - | - | - | - | - | 29.94 | - | 83.3 | 83.5 | 74.3 | 36.80 | - | - | |
| 09 | 17 | 1200 | ENE | 13.6 | - | - | - | - | - | 29.94 | - | 83.1 | 83.5 | 74.3 | 36.80 | - | - | |
| 09 | 17 | 1100 | ENE | 11.7 | - | - | - | - | - | 29.94 | - | 82.2 | 83.5 | 74.5 | 36.80 | - | - | |
| 09 | 17 | 1000 | NE | 13.6 | - | - | - | - | - | 29.91 | - | 79.7 | 83.5 | 73.8 | 36.80 | - | - | |
| 09 | 17 | 0900 | NE | 15.5 | - | - | - | - | - | 29.88 | - | 80.2 | 83.5 | 75.2 | 36.80 | - | - | |
| 09 | 17 | 0800 | ENE | 15.5 | - | - | - | - | - | 29.88 | - | 82.0 | 83.5 | 75.0 | 36.80 | - | - | |
| 09 | 17 | 0700 | ENE | 13.6 | - | - | - | - | - | 29.88 | - | 82.4 | 83.5 | 75.7 | 36.80 | - | - | |
| 09 | 17 | 0600 | E | 13.6 | - | - | - | - | - | 29.88 | - | 82.2 | 83.5 | 75.9 | 36.70 | - | - | |
| 09 | 17 | 0500 | E | 13.6 | - | - | - | - | - | 29.91 | - | 82.8 | 83.7 | 76.1 | 36.70 | - | - | |
| 09 | 17 | 0400 | E | 11.7 | - | - | - | - | - | 29.94 | - | 82.8 | 83.7 | 76.3 | 36.70 | - | - | |
| 09 | 17 | 0300 | E | 13.6 | - | - | - | - | - | 29.94 | - | 83.3 | 83.7 | 76.3 | 36.70 | - | - | |
| 09 | 17 | 0200 | ENE | 11.7 | - | - | - | - | - | 29.97 | - | 83.5 | 83.7 | 76.1 | 36.80 | - | - | |
| 09 | 17 | 0100 | E | 11.7 | - | - | - | - | - | 29.97 | - | 83.7 | 83.7 | 76.6 | 36.80 | - | - | |
| 09 | 17 | 0000 | E | 11.7 | - | - | - | - | - | 29.97 | - | 83.5 | 83.7 | 76.5 | 36.80 | - | - | |
| 09 | 16 | 2300 | ENE | 11.7 | - | - | - | - | - | 29.94 | - | 83.7 | 83.7 | 76.6 | 36.80 | - | - | |
| 09 | 16 | 2200 | ENE | 11.7 | - | - | - | - | - | 29.94 | - | 83.7 | 83.7 | 76.3 | 36.80 | - | - | |
| 09 | 16 | 2100 | ENE | 11.7 | - | - | - | - | - | 29.91 | - | 83.7 | 83.8 | 76.6 | 36.80 | - | - | |
| 09 | 16 | 2000 | ENE | 11.7 | - | - | - | - | - | 29.91 | - | 83.7 | 83.8 | 76.6 | 36.80 | - | - | |
| 09 | 16 | 1900 | ENE | 11.7 | - | - | - | - | - | 29.91 | - | 83.8 | 83.8 | 77.2 | 36.80 | - | - | |
| 09 | 16 | 1800 | ENE | 11.7 | - | - | - | - | - | 29.91 | - | 83.8 | 84.0 | 76.8 | 36.70 | - | - |
|
These oceanographic data are displayed in rounded times. Click on the graph icon in the table below to see a time series plot of the last five days of that observation. | ||
| Depth (DEPTH): | 3.3 ft | |
| Ocean Temperature (OTMP): | 83.84 °F |
| Salinity (SAL): | 36.70 psu |
| MM | DD | TIME (GMT) |
DEPTH ft |
OTMP °F |
COND mS/cm |
SAL psu |
O2% % |
O2PPM ppm |
CLCON ug/l |
TURB FTU |
PH | EH mv |
|---|---|---|---|---|---|---|---|---|---|---|---|---|
| 09 | 17 | 1500 | 3.3 | 83.66 | - | 36.80 | - | - | - | - | - | - |
| 09 | 17 | 1400 | 3.3 | 83.66 | - | 36.70 | - | - | - | - | - | - |
| 09 | 17 | 1300 | 3.3 | 83.48 | - | 36.80 | - | - | - | - | - | - |
| 09 | 17 | 1200 | 3.3 | 83.48 | - | 36.80 | - | - | - | - | - | - |
| 09 | 17 | 1100 | 3.3 | 83.48 | - | 36.80 | - | - | - | - | - | - |
| 09 | 17 | 1000 | 3.3 | 83.48 | - | 36.80 | - | - | - | - | - | - |
| 09 | 17 | 0900 | 3.3 | 83.48 | - | 36.80 | - | - | - | - | - | - |
| 09 | 17 | 0800 | 3.3 | 83.48 | - | 36.80 | - | - | - | - | - | - |
| 09 | 17 | 0700 | 3.3 | 83.48 | - | 36.80 | - | - | - | - | - | - |
| 09 | 17 | 0600 | 3.3 | 83.48 | - | 36.70 | - | - | - | - | - | - |
| 09 | 17 | 0500 | 3.3 | 83.66 | - | 36.70 | - | - | - | - | - | - |
| 09 | 17 | 0400 | 3.3 | 83.66 | - | 36.70 | - | - | - | - | - | - |
| 09 | 17 | 0300 | 3.3 | 83.66 | - | 36.70 | - | - | - | - | - | - |
| 09 | 17 | 0200 | 3.3 | 83.66 | - | 36.80 | - | - | - | - | - | - |
| 09 | 17 | 0100 | 3.3 | 83.66 | - | 36.80 | - | - | - | - | - | - |
| 09 | 17 | 0000 | 3.3 | 83.66 | - | 36.80 | - | - | - | - | - | - |
| 09 | 16 | 2300 | 3.3 | 83.66 | - | 36.80 | - | - | - | - | - | - |
| 09 | 16 | 2200 | 3.3 | 83.66 | - | 36.80 | - | - | - | - | - | - |
| 09 | 16 | 2100 | 3.3 | 83.84 | - | 36.80 | - | - | - | - | - | - |
| 09 | 16 | 2000 | 3.3 | 83.84 | - | 36.80 | - | - | - | - | - | - |
| 09 | 16 | 1900 | 3.3 | 83.84 | - | 36.80 | - | - | - | - | - | - |
| 09 | 16 | 1800 | 3.3 | 84.02 | - | 36.70 | - | - | - | - | - | - |
|
Click on the graph icon in the table below to see a time series plot of the last five days of that observation. | |||
| Short Wave Radiation 2 (SWRAD): | 844.0 | watts/meter2 |
| Long Wave Radiation (LWRAD): | 425.0 | watts/meter2 |
| MM | DD | TIME (GMT) |
SRAD1 w/m2 |
SWRAD w/m2 |
LWRAD w/m2 |
|---|---|---|---|---|---|
| 09 | 17 | 1500 | - | 728.0 | 433.0 |
| 09 | 17 | 1400 | - | 857.0 | 425.0 |
| 09 | 17 | 1300 | - | 591.0 | 427.0 |
| 09 | 17 | 1200 | - | 364.0 | 437.0 |
| 09 | 17 | 1100 | - | 173.0 | 443.0 |
| 09 | 17 | 1000 | - | - | 437.0 |
| 09 | 17 | 0900 | - | 24.0 | 435.0 |
| 09 | 17 | 0800 | - | 2.0 | 431.0 |
| 09 | 17 | 0700 | - | 2.0 | 428.0 |
| 09 | 17 | 0600 | - | 3.0 | 421.0 |
| 09 | 17 | 0500 | - | 2.0 | 416.0 |
| 09 | 17 | 0400 | - | 2.0 | 410.0 |
| 09 | 17 | 0300 | - | 2.0 | 411.0 |
| 09 | 17 | 0200 | - | 3.0 | 417.0 |
| 09 | 17 | 0100 | - | 3.0 | 415.0 |
| 09 | 17 | 0000 | - | 3.0 | 418.0 |
| 09 | 16 | 2300 | - | 3.0 | 419.0 |
| 09 | 16 | 2200 | - | 2.0 | 418.0 |
| 09 | 16 | 2100 | - | 8.0 | 429.0 |
| 09 | 16 | 2000 | - | 89.0 | 434.0 |
| 09 | 16 | 1900 | - | 293.0 | 436.0 |
| 09 | 16 | 1800 | - | 399.0 | 433.0 |
Links which are specific to this station are listed below:
Real Time Data in tabular form for the last forty-five days.
Historical Data & Climatic Summaries for quality controlled data for the current month, previous months, and previous years.
| U.S. Dept. of Commerce National Oceanic and Atmospheric Administration National Weather Service National Data Buoy Center 1007 Balch Blvd. Stennis Space Center, MS 39529 Feedback Page last modified: September 5, 2008 |
Disclaimer Credits Glossary |
Privacy Policy About Us Career Opportunities |