Tropical Cyclone Report
Hurricane Frances
25 August - 8 September 2004
John L. Beven II
National Hurricane Center
17 December 2004
Frances was a Cape Verde-type hurricane
that reached a peak intensity of category 4 on the Saffir-Simpson
Hurricane Scale. It affected the Bahamas as a category 3 hurricane
and the Florida east coast as a category 2 hurricane.
a. Synoptic History
Frances developed from a vigorous tropical
wave that moved westward from the coast of Africa on 21 August.
Convection associated with the wave gradually became better
organized, and the first Dvorak satellite intensity estimates were
made on 24 August. A tropical depression formed from the wave near
0000 UTC 25 August about 655 n mi west-southwest of the southern
Cape Verde Islands. The "best track" chart of the tropical
cyclone's path is given in Figure 1, with the wind and pressure
histories shown in
Figure 2 and Figure 3, respectively. The best track
positions and intensities are listed in Table 1.
The depression moved westward on the south
side of the Bermuda-Azores high and intensified, becoming a
tropical storm later on 24 August. Frances turned
west-northwestward on 26 August as it became a hurricane, and that
heading and the intensification continued until 28 August, when
Frances reached a first peak intensity estimated at 115 kt. The
hurricane turned westward late on 29 August while it slowly
weakened during a concentric eyewall cycle. Re-intensification
began on 30 August, and Frances reached a second peak intensity of
125 kt (category 4) late on 31 August as it passed north of the
Leeward and Virgin Islands. The hurricane moved west-northwestward
on 1-2 September, which brought the center just north of the Turks
and Caicos Islands and the southeastern Bahama Islands. The maximum
winds remained 120-125 kt during this time while the hurricane
underwent a series of concentric eyewall cycles. Moderate westerly
vertical shear developed later on 2 September, and Frances weakened
notably during the next two days. It was a category 3 hurricane,
with winds of 100-110 kt, over the central Bahama Islands on 2-3
September and a category 2 hurricane, with winds of 85-90 kt, over
the northwestern Bahamas on 3-4 September.
Steering currents weakened as Frances
reached the northwestern Bahamas due to a high pressure ridge
building west of the cyclone. This caused storm moved slowly
westward across the Gulf Stream on 4 September. The shear weakened,
which allowed slight re-intensification over the Gulf Stream,
followed by slight weakening just before Frances made landfall over
the southern end of Hutchinson Island, Florida near 0430 UTC 5
September as a Category 2 hurricane. Frances gradually weakened as
it moved slowly west-northwestward across the Florida Peninsula,
and became a tropical storm just before emerging into the
northeastern Gulf of Mexico near New Port Richey early on 6
September.
Frances did not strengthen over the Gulf,
with maximum sustained winds remaining 50-55 kt with a pressure
near 982 mb. It moved northwestward and made a final landfall near
the mouth of the Aucilla River in the Florida Big Bend region about
1800 UTC 6 September. The northwestward motion continued until 7
September, when Frances re-curved northeastward into the westerlies
over eastern Alabama and western Georgia. Frances weakened to a
tropical depression early on 7 September and then became
extratropical over West Virginia early on 9 September. As an
extratropical cyclone, Frances briefly had gale-force winds as it
accelerated northeastward across New York later on 9 September. The
cyclone turned eastward across northern New England and
southeastern Canada, dissipating over the Gulf of St. Lawrence late
on 10 September.
b. Meteorological Statistics
Observations in Frances (Figure 2 and Figure 3)
include satellite-based Dvorak technique intensity estimates from
the Tropical Analysis and Forecast Branch (TAFB), the Satellite
Analysis Branch (SAB) and the U. S. Air Force Weather Agency
(AFWA), as well as flight-level and dropwindsonde observations from
flights of the 53rd Weather Reconnaissance Squadron of
the U. S. Air Force Reserve Command. Microwave satellite imagery
from NOAA polar-orbiting satellites, the NASA Tropical Rainfall
Measuring Mission (TRMM), the NASA QuikSCAT, the NASA Aqua, and
Defense Meteorological Satellite Program (DMSP) satellites were
also useful in tracking Frances. Additionally, WSR-88D Doppler
radars in Puerto Rico and the southeastern United States provided
detailed data on Frances, as did a U. S. Department of Defense
radar located in the Bahamas.
The Air Force Reserve and NOAA Hurricane
Hunters flew 34 operational missions for Frances, including
standard reconnaissance and synoptic surveillance. The aircraft
made a total of 59 formal fixes of Frances - 56 from the Air Force
and 3 from NOAA. A NOAA aircraft reported winds of 144 kt at a
flight level of 8000 ft at 1726 UTC 31 August, while Air Force
aircraft measured winds of 138 kt at 700 mb at 1114 UTC 31 August
and again at 0543 UTC 2 September. A dropwindsonde in the northern
eyewall reported winds peak of 166 kt at a level of 904 mb near
0539 UTC 2 September. The lowest aircraft-measured pressure was 935
mb at 0712 UTC 1 September, with a 936 mb pressure reported at 0718
UTC 2 September. Several research flights also occurred, with one
such mission deploying a series of drifting buoys that reported
useful pressure and sea surface temperature data from Frances as
well as the subsequent
Hurricane Jeanne.
Frances brought hurricane conditions to
much of the central and northwestern Bahamas, southeastern Florida,
and the adjacent Atlantic. Ship reports of winds of tropical storm
force associated with Frances are given in Table 2, and selected
surface observations from land stations and data buoys are given in
Table 3. The maximum sustained wind reported from a land station
was 87 kt at North Eleuthera in the northwestern Bahamas at 1000
UTC 3 September. The Coastal Marine Automated Network (C-MAN)
station at Settlement Point on Grand Bahama Island reported a
10-minute mean wind of 73 kt at 2320 UTC 4 September and a peak
gust of 96 kt. San Salvador in the Central Bahamas reported a peak
gust of 104 kt at 1900 UTC 2 September. In Florida, an Army Corps
of Engineers (USACE) station at Port Mayaca reported sustained
winds of 74 kt at 0500 UTC 5 September, while a portable
instrumented tower run by the Florida Coastal Monitoring Program
(FCMP) at Ft. Pierce reported 70 kt sustained winds at 0402 UTC 5
September along with a peak gust of 94 kt. Unofficial reports
include a sustained wind of 70 kt from the Jupiter police
department and a gust to 94 kt in Martin County. It should be noted
that a gust of 108 kt at Port Canaveral that was reported
operationally was found to be unreliable in post-analysis.
Shipping mostly avoided Frances as it
crossed the Atlantic. The highest winds reported by a ship were 43
kt from a ship with the call sign C6FV9 at 1200 UTC 5 September.
Two drifting buoys reported sustained winds of 78 kt, although the
reliability of these reports is uncertain.
The lowest reported pressure from a land
station was 948.1 mb at San Salvador in the Bahamas at 2000 UTC 2
September. North Eleuthera reported a minimum pressure of 958.6 mb
at 1400 UTC 3 September, while Settlement Point reported a minimum
pressure of 963.2 mb at 1600 UTC 4 September. In Florida, the USACE
station at St. Lucie lock reported a minimum pressure of 962.1 mb
at 0600 UTC 5 September, while the FCMP tower at Port Salerno
reported a minimum pressure of 962.8 mb at 0550 UTC that day. A
storm chaser on southern Hutchinson Island reported an unofficial
pressure of 959.0 mb at 0525 UTC that day, while a second storm
chaser at Sewall's Point reported a pressure of 962.0 mb at 0345
UTC that day. Additionally, a drifting buoy measured a pressure of
955.2 mb at 0307 UTC 2 September.
Frances produced notable storm surges along
both the Atlantic and Gulf coasts of Florida. The highest measured
storm surge was 5.89 ft above mean sea level on the Florida east
coast at the St. Lucie Lock. The National Weather Service Melbourne
Weather Forecast Office (WFO) estimated storm surge at 8 ft near
Vero Beach and 6 ft around Cocoa Beach. Lesser storm surge values
were estimated elsewhere along the Florida east coast, while storm
surges of 1-2 ft above normal tide levels were reported as far
north as the Georgia coast. Along the Gulf coast, a storm tide of 6
ft was estimated in Pinellas County, FL, while storm tides of 3-5
ft were estimated in the Florida Big Bend area.
Frances also produced significant storm
surge on several of the Bahama Islands, which the inundated the
airports at Freeport, Grand Bahama, and Marsh Harbor, Abaco.
However, exact surge values are not available.
Frances caused widespread heavy rains and
associated freshwater flooding over much of the eastern United
States (Figure 4). The maximum reported rainfall was 18.07 in at
Linville Falls, North Carolina (Table 4). This was part of a swath
of rains in excess of 10 in along the Appalachian Mountains in
western North Carolina and northeastern Georgia. Rainfalls in
excess of 10 in also occurred over large portions of the central
and northern Florida Peninsula and southeastern Georgia, with storm
totals of 15.84 in at High Springs, FL, 15.81 in near
Chassahowitzka, FL, and an unofficial total of 15.08 in at Port
Orange, FL (Table 3). Storm-total rainfalls of 5-10 in were common
elsewhere along Frances' track as a tropical cyclone, with reports
of 3-6 in totals along the extratropical portion of the track.
A total of 101 tornadoes have been reported
in association with Frances - 23 in Florida, 7 in Georgia, 45 in
South Carolina, 11 in North Carolina, and 15 in Virginia. Many of
the tornadoes occurred in an outbreak over South and North Carolina
on 7 September.
c. Casualty and Damage Statistics
Frances is directly responsible for seven
deaths - five in Florida, one in the Bahamas, and one in Ohio.
Three deaths were caused by wind, two by storm surge, one by
freshwater flooding, and one by lightning. The hurricane is
indirectly responsible for 42 deaths - 32 in Florida, 8 in Georgia,
1 in the Bahamas, and 1 in Ohio.
The American Insurances Service Group
reports that Frances causes $4.43 billion in damage to insured
property in the United States, with $4.11 billion occurring in
Florida. Applying a two-to-one ratio to this figure to account for
damage to uninsured property yields a damage estimate of $8.86
billion. Additionally, space and military facilities in the Cape
Canaveral area reported over $100 million dollars in property
damage. Therefore, the best estimate of the total property damage
from Frances is $9 billion, which in terms of unadjusted damage
makes Frances the fourth most costly hurricane in United States
history behind Andrew of 1992, and Charley and Ivan of 2004. This
total does not include agricultural or economic losses. Widespread
property damage also occurred in the central and northwestern
Bahama Islands. However, no monetary damage figures are available
at this time.
d. Forecast and Warning Critique
The overall track forecast errors for
Frances were exceptionally good. Average official track errors
(with the number of cases in parentheses) were 20 (53), 36 (53), 52
(53), 66 (52), 80 (48), 100 (44), and 128 (40) n mi for the 12, 24,
36, 48, 72, 96, and 120 h forecasts, respectively. These errors are
50-70% lower than the average official track errors for the 10-yr
period 1994-2003[1] (44, 78, 112, 146, 217, 248, and
319 n mi, respectively), (Table 5). Not only are the average track
forecast errors outstanding, but only five of the individual
track forecasts at any time exceeded the long-term average errors -
two 12-h forecasts, one 36-h forecast, and two 96-h forecasts. As
good as the official track forecasts were, they were bettered by
some of the numerical guidance. The lowest track forecast errors
amongst the guidance were from the Florida State University
Superensemble (FSSE), which on average outperformed the official
forecast at all times.
Some of the low track forecast errors can
be attributed to Frances' long track south of the subtropical ridge
and the occasionally slow motion, both of which favor low track
forecast errors. However, the forecast errors stayed relatively low
through the time where Frances slowed near the Bahamas and turned
northwestward across Florida - which were tougher forecast
scenarios.
The average intensity forecast errors were
also smaller than normal. Average official intensity errors were 2,
7, 10, 13, 15, 14, 14, and 16 kt for the 12, 24, 36, 48, 72, 96,
and 120 h forecasts, respectively. For comparison, the average
official intensity errors over the 10-yr period 1994-2003 are 6,
10, 12, 15, 19, 20, and 21 kt, respectively. While the average
errors were low, there were two periods of rather large forecast
errors. The first was early in Frances' life when the amount of
intensification was underforecast. The second was as Frances
approached the Bahamas when the impact of the vertical shear was
underestimated, resulting in a series of forecast intensities that
were too strong.
Table 6 shows the watches and warnings
issued for Frances. A hurricane watch was issued for the
southeastern Bahamas and the Turks and Caicos Islands at 0900 UTC
31 August, with a hurricane warning issued 6 h later. These were 33
and 27 h respectively before the closest approach of the center to
the Turks and Caicos. A hurricane watch was issued for the central
Bahamas at 1500 UTC 31 August, while a hurricane warning was issued
at 1500 UTC 1 September. These were 52 and 28 h respectively before
the arrival of the center at San Salvador Island. A hurricane watch
was issued for the northwestern Bahamas at 1500 UTC 1 September,
with a hurricane warning issued at 0000 UTC 2 September. These were
43 and 34 h respectively before the arrival of the center at
Eleuthera Island.
In the United States, a hurricane watch was
issued for the east coast of Florida at 0300 UTC 2 September, with
a hurricane warning following at 1500 UTC that day. These were 73
and 61 h respectively before the center reached Hutchinson Island.
Along the Gulf coast, a tropical storm watch was issued for the
eventual landfall area at 1500 UTC 4 September, with a tropical
storm warning following 6 h later. These were 51 and 45 h
respectively before the center reached the Aucilla River.
A series of watches and warnings were
issued for the islands of the northeastern Caribbean in
anticipation that Frances would come close enough to produce
tropical storm conditions. Also, a hurricane warning was issued for
portions of the Florida Gulf coast in anticipation that Frances
would maintain hurricane strength all the way across the Florida
Peninsula, or re-intensify over the Gulf of Mexico. These watches
and warnings did not verify.
Acknowledgements
Much of the data for this report was
supplied by the National Weather Service WFOs in Key West, Miami,
Tampa, Melbourne, Jacksonville, and Tallahassee FL, as well as by
the South Florida Water Management District, the St. John's River
Water Management District, and the Florida Automated Weather
Network (FAWN). NOAA buoy and C-MAN data were provided by the
National Data Buoy Center. NOS data were provided by the NOAA
National Ocean Service. Remote Automated Weather Stations (RAWS)
data were provided by the National Interagency Fire Center. United
States Geological Survey (USGS) data were provided by the NWISWeb
web site. The rainfall map and much of the supplementary rainfall
data was provided by David Roth of the Hydrometeorological
Prediction Center. Much of the tornado data was provided by the
Storm Prediction Center. Several of the unofficial observations
were obtained from the Weather Underground web site.
[1]Errors given
for the 96 and 120 h periods are averages over the three-year
period 2001-3.
Table 1: Best track for Hurricane Frances,
25 August - 8 September 2004.
Date/Time
(UTC) | Position | Pressure
(mb) | Wind Speed
(kt) | Stage |
Lat.
(°N) | Lon.
(°W) |
| 25 / 0000 | 11.1 | 35.2 | 1009 | 25 | tropical
depression |
| 25 / 0600 | 11.2 | 36.8 | 1008 | 30 | " |
| 25 / 1200 | 11.3 | 38.3 | 1007 | 30 | " |
| 25 / 1800 | 11.5 | 39.8 | 1005 | 35 | tropical
storm |
| 26 / 0000 | 11.9 | 41.5 | 1003 | 40 | " |
| 26 / 0600 | 12.3 | 42.9 | 1000 | 45 | " |
| 26 / 1200 | 12.8 | 44.5 | 994 | 55 | " |
| 26 / 1800 | 13.3 | 45.8 | 987 | 65 | hurricane |
| 27 / 0000 | 13.7 | 46.8 | 984 | 70 | " |
| 27 / 0600 | 14.2 | 47.8 | 980 | 75 | " |
| 27 / 1200 | 14.7 | 48.5 | 970 | 90 | " |
| 27 / 1800 | 15.4 | 49.3 | 962 | 100 | " |
| 28 / 0000 | 15.9 | 50.0 | 962 | 100 | " |
| 28 / 0600 | 16.6 | 50.9 | 962 | 100 | " |
| 28 / 1200 | 17.2 | 51.6 | 958 | 105 | " |
| 28 / 1800 | 17.7 | 52.3 | 948 | 115 | " |
| 29 / 0000 | 18.1 | 52.9 | 948 | 115 | " |
| 29 / 0600 | 18.4 | 53.6 | 948 | 115 | " |
| 29 / 1200 | 18.6 | 54.4 | 948 | 115 | " |
| 29 / 1800 | 18.8 | 55.0 | 948 | 110 | " |
| 30 / 0000 | 18.9 | 55.8 | 954 | 105 | " |
| 30 / 0600 | 19.0 | 56.8 | 958 | 100 | " |
| 30 / 1200 | 19.2 | 58.1 | 956 | 100 | " |
| 30 / 1800 | 19.4 | 59.3 | 948 | 110 | " |
| 31 / 0000 | 19.6 | 60.7 | 946 | 110 | " |
| 31 / 0600 | 19.8 | 62.1 | 950 | 115 | " |
| 31 / 1200 | 20.0 | 63.5 | 949 | 120 | " |
| 31 / 1800 | 20.3 | 65.0 | 942 | 125 | " |
| 01 / 0000 | 20.6 | 66.4 | 941 | 120 | " |
| 01 / 0600 | 21.0 | 67.9 | 939 | 120 | " |
| 01 / 1200 | 21.4 | 69.1 | 937 | 120 | " |
| 01 / 1800 | 21.8 | 70.4 | 941 | 120 | " |
| 02 / 0000 | 22.2 | 71.4 | 939 | 120 | " |
| 02 / 0600 | 22.7 | 72.5 | 937 | 125 | " |
| 02 / 1200 | 23.2 | 73.5 | 939 | 120 | " |
| 02 / 1800 | 23.8 | 74.3 | 948 | 115 | " |
| 03 / 0000 | 24.2 | 75.0 | 948 | 105 | " |
| 03 / 0600 | 24.7 | 75.7 | 954 | 100 | " |
| 03 / 1200 | 25.3 | 76.3 | 958 | 95 | " |
| 03 / 1800 | 25.7 | 77.1 | 960 | 90 | " |
| 04 / 0000 | 26.0 | 77.5 | 960 | 85 | " |
| 04 / 0600 | 26.4 | 77.9 | 960 | 85 | " |
| 04 / 1200 | 26.8 | 78.5 | 962 | 90 | " |
| 04 / 1800 | 26.8 | 79.1 | 962 | 90 | " |
| 05 / 0000 | 27.0 | 79.4 | 958 | 95 | " |
| 05 / 0600 | 27.2 | 80.2 | 960 | 90 | " |
| 05 / 1200 | 27.4 | 80.7 | 969 | 80 | " |
| 05 / 1800 | 27.8 | 81.7 | 975 | 60 | tropical
storm |
| 06 / 0000 | 28.1 | 82.3 | 978 | 55 | " |
| 06 / 0600 | 28.6 | 83.3 | 981 | 55 | " |
| 06 / 1200 | 29.2 | 83.7 | 982 | 55 | " |
| 06 / 1800 | 30.1 | 84.0 | 982 | 50 | " |
| 07 / 0000 | 31.0 | 84.6 | 984 | 35 | " |
| 07 / 0600 | 31.5 | 85.0 | 988 | 30 | tropical
depression |
| 07 / 1200 | 32.0 | 85.2 | 992 | 25 | " |
| 07 / 1800 | 32.5 | 85.1 | 996 | 25 | " |
| 08 / 0000 | 33.4 | 84.7 | 998 | 25 | " |
| 08 / 0600 | 34.3 | 84.3 | 1000 | 25 | " |
| 08 / 1200 | 36.1 | 83.2 | 1001 | 25 | " |
| 08 / 1800 | 37.8 | 82.1 | 1002 | 25 | " |
| 09 / 0000 | 38.7 | 81.3 | 1001 | 25 | extratropical |
| 09 / 0600 | 40.5 | 80.0 | 1001 | 30 | " |
| 09 / 1200 | 42.8 | 77.7 | 1001 | 35 | " |
| 09 / 1800 | 44.3 | 75.7 | 1002 | 30 | " |
| 10 / 0000 | 45.3 | 73.3 | 1003 | 25 | " |
| 10 / 0600 | 46.2 | 70.5 | 1004 | 20 | " |
| 10 / 1200 | 46.6 | 67.3 | 1005 | 20 | " |
| 10 / 1800 | 47.2 | 64.2 | 1005 | 20 | " |
| 11 / 0000 | | | | | dissipated |
| 01 / 0700 | 21.1 | 68.1 | 935 | 120 | minimum pressure |
| 31 / 1800 | 20.3 | 65.0 | 942 | 125 | maximum wind |
| 02 / 0730 | 22.8 | 72.8 | 936 | 125 | " |
| 02 / 1930 | 24.0 | 74.5 | 948 | 110 | landfall on San Salvador Island,Bahamas |
| 03 / 0530 | 24.6 | 75.6 | 954 | 100 | landfall on northern end of Cat Island,Bahamas |
| 03 / 1000 | 25.1 | 76.1 | 956 | 95 | landfall on Eleuthera Island,Bahamas |
| 04 / 1000 | 26.6 | 78.2 | 961 | 90 | landfall on Grand Bahama Island,Bahamas |
| 05 / 0430 | 27.2 | 80.2 | 960 | 90 | landfall at southern end of Hutchinson Island, FL |
| 06 / 1800 | 30.1 | 84.0 | 982 | 50 | landfall at mouth of Aucilla River, FL |
Table 2: Selected ship
and drifting buoy reports with winds of at least 34 kt for
Hurricane Frances, 25 August -8 September 2004
| Ship Name or Call Sign | Date/Time (UTC) | Lat.
(°N) | Lon.
(°W) | Wind dir/speed (deg/kt) | Pressure (mb) |
| Buoy 41544 | 01 / 0700 | 23.0 | 66.7 | 090 / 37 | 1010.4 |
| Buoy 41544 | 01 / 1600 | 23.1 | 66.7 | 090 / 41 | 1015.2 |
| Buoy 41927 | 01 / 1601 | 23.6 | 70.1 | 080 / 93 | 1010.9 |
| Buoy 41543 | 02 / 0000 | 24.0 | 70.7 | 100 / 39 | 1008.1 |
| Buoy 41539 | 02 / 0000 | 24.4 | 69.1 | 090 / 35 | 1012.9 |
| Buoy 41545 | 02 / 0000 | 24.4 | 70.4 | 090 / 39 | 1011.0 |
| Buoy 41922 | 02 / 0307 | 22.2 | 71.9 | N/A / 35 | 955.2 |
| Buoy 41543 | 02 / 0400 | 24.1 | 70.7 | 120 / 49 | 1009.7 |
| Anke-Angela | 02 / 0600 | 26.9 | 72.1 | 090 / 36 | 1016.0 |
| Buoy 41545 | 02 / 0700 | 24.4 | 70.4 | 110 / 37 | 1010.8 |
| Buoy 41925 | 02 / 0727 | 22.9 | 71.7 | 130 / 70 | 989.3 |
| Buoy 41934 | 02 / 0906 | 24.6 | 72.0 | N/A / 78 | N/A |
| Buoy 41939 | 02 / 0910 | 22.2 | 71.2 | N/A / 52 | N/A |
| Buoy 41542 | 02 / 1800 | 27.6 | 69.6 | N/A / 58 | 1016.0 |
| Buoy 41927 | 02 / 1841 | 23.6 | 70.1 | N/A / 41 | N/A |
| Buoy 41926 | 03 / 0243 | 23.1 | 69.1 | 140 / 35 | 1014.6 |
| Buoy 41541 | 03 / 0700 | 24.6 | 76.6 | 320 / 49 | 986.7 |
| Buoy 41542 | 03 / 0700 | 27.6 | 69.6 | 130 / 51 | 1015.2 |
| Buoy 41541 | 03 / 1800 | 24.5 | 76.4 | 200 / 58 | 999.0 |
| Buoy 41540 | 03 / 2000 | 27.9 | 78.6 | N/A / 78 | 1009.0 |
| Buoy 41923 | 04 / 0227 | 24.1 | 71.4 | N/A / 49 | 1013.8 |
| Buoy 41540 | 04 / 1900 | 28.3 | 79.2 | N/A / 49 | 998.3 |
| Zim California | 05 / 0000 | 29.0 | 77.6 | 100 / 35 | 1012.0 |
| Saudi Abha | 05 / 0600 | 26.8 | 76.4 | 140 / 37 | 1005.4 |
| C6FV9 | 05 / 1200 | 24.2 | 81.5 | 260 / 43 | 1004.0 |
| Galveston Bay | 05 / 1200 | 27.3 | 73.8 | 350 / 40 | 1013.0 |
| SHIP | 05 / 1800 | 25.0 | 83.4 | 270 / 39 | 1004.7 |
| Maersk New Orleans | 06 / 0000 | 29.1 | 78.4 | 120 / 35 | 1009.0 |
| KS004 | 06 / 0900 | 25.8 | 80.1 | 170 / 37 | 1006.9 |
| Chevron Arizona | 06 / 0900 | 27.5 | 86.1 | 350 / 37 | 999.5 |
| Heidelberg Express | 06 / 1500 | 28.5 | 79.6 | 130 / 39 | 1011.8 |
| Sea-Land Freedom | 06 / 1800 | 30.1 | 79.7 | 160 / 36 | 1010.0 |
| Nordon | 06 / 1800 | 31.8 | 79.3 | 120 / 35 | 1013.0 |
| Nordon | 07 / 0000 | 31.4 | 80.4 | 120 / 37 | 1009.3 |
| Nanticoke | 09 / 0300 | 42.1 | 81.4 | 050 / 38 | 1014.0 |
| Canadian Progress | 09 / 1200 | 42.7 | 80.1 | 000 / 35 | N/A |
| 3FFL8 | 10 / 0600 | 43.1 | 65.1 | 180 / 35 | 1018.0 |
|
Table 3: Selected surface observations for
Hurricane Frances, 25 August - 8 September 2004.
| | Minimum
Sea-level
Pressure | Maximum Surface Wind Speed
(kt) | |
| Location | Date/
Time
(UTC) | Press.
(mb) | Date/
Timea
(UTC) | Sust.
Windb
(kts) | Peak
Gust (kts) | Storm
Surgec
(ft) | Storm
Tided
(ft) | Rain
(storm total)
(in) |
| Bahamas |
| N. Eleuthera | 03/1400 | 958.6 | 03/1000 | 87 | | | | |
| N. Norman Reef (NOAA CREWS) | 03/0400 | 992.0 | 03/0100 | 37 | 53 | | | |
| San Salvador | 02/2000 | 948.1 | 02/1900 | 59 | 104 | | | 5.47 |
| Alabama |
| Dothan (KDHN) | 07/0359 | 992.8 | 06/1937 | 32 | 45 | | | 1.00 |
| Florida |
| Alachual | | | | | | | | 4.71 |
| Altamonte Springs 7E USGS | | | 05/1334 | | 50 | | | |
| Anclote | | | 04/ N/A | | 61 | | | |
| Apalachicola (KAAF) | 06/1823 | 991.5 | 06/0232 | 31 | 39 | | | 1.12 |
| Apalachicolai | 06/1906 | 991.8 | 05/2200 | | 41 | | 2.48 | |
| Astor Bombing Range (KNAE)f | 05/1556 | 995.5 | 05/0535 | 28 | 39 | | | |
| Avalonl | | | | | | | | 5.98 |
| Big Carlos Passf | 06/0000 | 996.0 | 05/2012 | 40 | 51 | | | |
| Big Cypressg | 05/0745 | 990.3 | 05/0802 | | 40 | | | |
| Bings Landingi | 05/2300 | 999.5 | | | | | 4.17 | |
| Boca Raton (KBCT) | | | 03/2030 | | 50 | | | |
| Brooksville (KBKV) | 06/0147 | 981.4 | 05/1755 | 33 | 47 | | | |
| Buffalo Bluffi | | | | | | | 3.49 | |
| Bunnel (KX47)f | | | 07/0544 | 30 | 39 | | | |
| Cachej | | | 05/1716 | | 39 | | | |
| Canal C-38/S65CWg | 05/1315 | 972.1 | 05/1315 | 35 | 58 | | | |
| Canal C-38/S65DWXg | 05/1230 | 972.4 | 05/1115 | 35 | 65 | | | |
| Cape Canaveral(KCCA)f | | | 05/1119 | 31 | 48 | | | |
| Cape Canaveralj | | | 05/1715 | | 52 | | | |
| CCUTi | 05/2133 | 980.1 | 06/0615 | 44 | 55 | | | |
| Cent. Miami-Dadeg | 05/0630 | 995.4 | 05/0456 | | 59 | | | |
| Chekikaj | | | | | 47 | | | |
| Citral | | | | | | | | 6.56 |
| Clearwater Beachi | 06/0000 | 984.1 | 05/1854 | 54 | 64 | | 4.35 | |
| Clewiston/CFSWg | 05/0815 | 981.7 | 05/0745 | 32 | 56 | | | |
| Crescent Beachi | | | | | | | 6.62 | |
| Daytona Beach (KDAB) | 05/2000 | 994.9 | 05/1000 | 49 | 65 | | | 9.96 |
| E. Lake Okeechobee/L006g | 05/0730 | 975.3 | 05/0600 | 54 | 79 | | | 5.87 |
| E. Lake Okeechobee/LZ40g | 05/0730 | 972.6 | 05/0720 | | 80 | | | |
| Fernandina Beach (K55J)f | | | 06/0855 | | 38 | | | |
| Fernandina Beachi | 06/0800 | 1002.7 | 06/0500 | | 43 | 1.55 | 7.73 | |
| Ft. Lauderdale Exe. (KFXE) | | | 04/1848 | | 48 | | | |
| Ft. Lauderdale Int. (KFLL) | 05/0630 | 990.0 | 03/1916 | 36 | 48 | | | 4.26 |
| Ft. Myers (KFMY) | 05/1922 | 992.2 | 05/1859 | 32 | 42 | | | 2.89 |
| Ft. Myers (KRSW) | 05/1926 | 992.6 | 06/1010 | 31 | 40 | | | 4.44 |
| Ft. Myersi | 05/1836 | 991.9 | 05/0700 | | 37 | | 4.01 | |
| Ft. Pierce (FCMP tower) | | | 05/0402 | 70 | 94 | | | |
| Ft. Piercel | | | 05/0300 | 50 | | | | 3.44 |
| Fred Howard | | | 04/ N/A | | 61 | | | |
| Gainesville (KGNV) | 06/0044 | 991.0 | 05/2200 | 41 | 56 | | | 10.81 |
| Hastingsl | | | 05/0815 | 36 | | | | 8.35 |
| Indian Harbor Beach (FCMP tower) | 05/1259 | 981.9 | 05/1455 | 46 | 68 | | | |
| Jacksonville Cecil Field (KVQQ) | | | 06/0034 | 27 | 39 | | | 9.17 |
| Jacksonville Craig Exe. (KCRG)f | 06/0753 | 998.6 | 05/2053 | 29 | 52 | | | 7.10 |
| Jacksonville I-295i | | | | | | | 3.68 | |
| Jacksonville Int. (KJAX) | 06/0922 | 998.2 | 06/0017 | 38 | 54 | | | 9.13 |
| Jacksonville Main St.i | | | | | | | 4.50 | |
| Jacksonville NAS (KNIP) | 06/0655 | 997.6 | 05/2246 | 42 | 54 | | | 6.37 |
| Kenansvillel | | | | | | | | 6.44 |
| Key West Intl. (KEYW) | 05/0953 | 1002.9 | 05/1640 | 31 | 38 | | | 1.58 |
| Key West NAS (KNQX) | 05/0955 | 1002.9 | 05/1033 | | 43 | | | 1.65 |
| Key Westi | 05/1000 | 1003.6 | 04/2000 | | 43 | 0.3 | 2.22 | |
| Lake Apopkak | | | 05/1330 | | 43 | | | |
| Lake City (KLCQ) | 06/1439 | 994.5 | 06/1909 | 29 | 41 | | | |
| Lake Tohopekaligag | 05/1545 | 976.0 | 05/1345 | 48 | 71 | | | |
| Lake Wales Ridgej | | | 05/1246 | | 43 | | | |
| Lake Winderk | | | 05/1245 | | 52 | | | |
| Leesburg (KLEE)f | 05/1859 | 988.5 | 05/1949 | | 52 | | | 6.46 |
| Live Oakl | | | | | | | | 8.10 |
| Loxahatchee/LXWSg | 05/0530 | 979.1 | 05/0600 | 49 | 76 | | | |
| Marathon (KMTH) | 05/0853 | 1001.7 | 05/1928 | | 37 | | | 1.57 |
| Mariana (KMAI) | 06/2323 | 990.8 | 06/1424 | 32 | 43 | | | 1.01 |
| Matanzas Riveri | | | | | | | 6.88 | |
| Mayport (KNRB) | 06/0955 | 997.6 | 06/0144 | 45 | 55 | | | 5.15 |
| Mayporti | | | | | | | 6.35 | |
| Mayport (Bar Pilots Dock)i | 06/0724 | 1001.7 | 06/0518 | 36 | 49 | | 5.96 | |
| Mayport (Degaussing Structure)i | 06/0800 | 1001.4 | 06/0900 | 35 | 51 | | | |
| McKay Bayi | | | 06/1318 | 38 | 55 | | | |
| Melbourne (KMLB)f | 05/1858 | 995.9 | 04/2358 | | 63 | | | 7.95 |
| Merrit Island Airport | N/A | 984.0 | 05/0935 | 64 | 78 | | | |
| Miami Int. (KMIA) | 05/0807 | 995.0 | 05/1932 | 37 | 51 | | | 3.49 |
| Miami WFO | | | 04/1940 | | 44 | | | 3.09 |
| Naples (KAPF) | | | 05/2007 | 33 | 47 | | | 1.06 |
| Naplesi | 05/0900 | 996.3 | 05/1200 | 36 | 47 | | 4.30 | |
| NASA Tower 19h | | | 05/1040 | 59 | 82 | | | |
| NASA Tower 22h | | | 05/1150 | 55 | 72 | | | |
| NASA Tower 110h | | | 05/1210 | 49 | 78 | | | |
| N. Lake Okeechobee/L001g | 05/1000 | 969.5 | 05/0715 | 62 | 83 | | | 5.84 |
| NW Browardg | 05/0745 | 986.9 | 04/2040 | | 53 | | | |
| NW Collierg | 05/0900 | 994.6 | 05/1810 | | 47 | | | |
| Oasisj | | | 04/2134 | | 41 | | | |
| Ocala (KOCF) | 05/2255 | 987.8 | 05/1955 | | 43 | | | 10.81 |
| Ochopeej | | | 05/0636 | | 39 | | | |
| Ocklawahal | | | | | | | | 8.94 |
| Okahumpkal | | | | | | | | 7.35 |
| Opa Locka (KOPF) | 05/0548 | 993.0 | 05/1730 | 37 | 47 | | | 3.43 |
| Orlando Int. (KMCO)f | 05/1052 | 989.4 | 05/0848 | 47 | 60 | | | 6.50 |
| Panama City (KPFN) | 06/1835 | 993.9 | 05/2241 | 36 | 53 | | | 0.49 |
| Panama City Beachi | 06/2200 | 995.4 | 07/0700 | | 39 | | | |
| Pembroke Pines (KHWO) | 05/0542 | 992.0 | 05/0035 | 35 | 47 | | | 5.04 |
| Perry (K40J) | 06/1615 | 987.1 | 06/1701 | 32 | 41 | | | 3.54 |
| Piersonl | | | | | | | | 9.05 |
| Ponce Inletk | | | 05/2215 | | 36 | | | |
| Port Manateei | | | | | | | 4.63 | |
| Port Mayaca (USACE) | 05/0645 | 964.7 | 05/0500 | 74 | | | | |
| Port St. Lucie (Texas Tech tower) | | | 05/0329 | 67 | 83 | | | |
| Port Salerno (FCMP tower) | 05/0550 | 962.8 | 05/0240 | 49 | 71 | | | |
| Punta Gorda (KPGD) | 05/1905 | 989.2 | 06/0538 | 40 | 50 | | | |
| Putnam Halll | | | | | | | | 11.64 |
| Racy Pojnti | | | 05/2100 | | 55 | | | |
| Red Bay Pointi | | | | | | | 3.28 | |
| St. Augustine (KSGJ) | 05/2205 | 999.0 | 05/2015 | 41 | 53 | | | |
| St. Lucie Lock (USACE) | 05/0600 | 962.1 | 05/0330 | 37 | | 5.89 | | |
| St. Petersburg (KPIE) | 05/2216 | 982.4 | 06/0619 | 38 | 49 | | | 5.41 |
| St. Petersburg (KSPG) | 05/2147 | 981.4 | 06/0101 | 38 | 50 | | | 6.27 |
| St. Petersburgi | 05/2054 | 981.7 | 06/0612 | 36 | 47 | | 5.02 | |
| Sanford (KSFB)f | 05/1457 | 989.8 | 04/2313 | 44 | 61 | | | 4.40 |
| Sarasota (KSRQ) | 05/2132 | 984.4 | 06/0850 | 36 | 46 | | | 4.69 |
| Seminole Cnty. Stn. 22 | 05/1214 | 988.8 | 05/1451 | | 51 | | | 5.98 |
| Seminole Cnty. Stn. 35 | 05/1514 | 989.5 | 05/1257 | | 50 | | | 5.77 |
| Skyway Bridge | | | 05/1418 | | 55 | | | |
| SW Palm Beachg | 05/0630 | 986.9 | 05/0456 | | 59 | | | |
| Space Coast Regional Arpt. (Texas Tech tower) | | | 05/1529 | 60 | 78 | | | |
| Summerland Key Marine Lab | | | 05/1710 | 31 | 37 | | | 2.07 |
| Tallahassee (KTLH) | 06/1910 | 984.4 | 05/1938 | 41 | 52 | | | 2.48 |
| Tamiami Exe. (KTMB) | 05/0827 | 996.0 | 05/2141 | 41 | 49 | | | 2.33 |
| Tampa (KTPA) | 05/2225 | 980.0 | 05/1905 | 39 | 47 | | | 5.74 |
| Tavaresl | | | | | | | | 7.37 |
| Tenrawj | | | 05/0723 | | 44 | | | |
| Trident Pieri | 05/1300 | 989.1 | 05/1224 | 41 | 57 | | 7.08 | |
| Umatillal | | | | | | | | 8.86 |
| Vaca Keyi | 05/0900 | 1001.7 | 05/0300 | | 36 | 1.0 | 2.22 | |
| Vero Beach (FCMP tower) | | | 05/0435 | 49 | 71 | | | |
| Vero Beach (Texas Tech tower) | | | 05/0907 | 59 | 73 | | | |
| Vilano Beachi | 05/2300 | 999.5 | 05/2300 | 33 | 53 | | | |
| Virginia Keyi | 05/0600 | 994.5 | 05/0836 | 38 | 49 | | 3.01 | |
| Virginia Key AOML | 05/0551 | 992.0 | 04/2031 | | 53 | | | 2.84 |
| W. Cent. Collierg | 05/1100 | 996.6 | 05/0601 | | 41 | | | |
| W. Lake Okeechobee/L005g | 05/0915 | 980.1 | 05/0845 | 52 | 78 | | | 3.53 |
| West Palm Beach (KPBI) | 05/0508 | 972.0 | 05/0656 | 56 | 71 | | | 13.56 |
| Winter Haven (KGIF)f | 06/1602 | 977.3 | 06/1559 | 40 | 50 | | | |
| WRWXg | 05/1630 | 976.1 | 05/1510 | | 59 | | | |
| Georgia |
| Albany (KABY) | 07/0042 | 991.8 | 06/1942 | 38 | 59 | | | 4.53 |
| Alma (KAMG) | 07/0002 | 996.9 | 07/0237 | 35 | 39 | | | 6.46 |
| Atlanta Hartsfield Int. (KATL) | 07/2151 | 998.3 | 07/0800 | | 45 | | | 3.02 |
| Bainbridge (KBGE) | | | 06/1620 | | 37 | | | |
| Brasstownj | | | 07/1206 | | 39 | | | |
| Byromvillej | | | 07/0005 | | 37 | | | |
| Brunswick (KBQK) | 06/2319 | 1002.3 | 06/0221 | 27 | 38 | | | |
| Columbus (KCSG) | 07/0751 | 994.4 | 07/0251 | | 39 | | | 3.53 |
| Cookj | | | 06/1804 | | 34 | | | |
| Douglas (KDQH) | 06/2259 | 995.2 | 06/2259 | | 35 | | | |
| Ft. Benning (KLSF) | 07/0655 | 994.1 | 07/0155 | | 39 | | | 3.90 |
| Ft. Pulaskii | | | 06/1148 | 32 | 39 | | 7.97 | |
| Gainesville (KGVL) | 08/0553 | 1000.1 | 07/1008 | | 34 | | | 4.56 |
| Gannett Lake (USFL) | | | 06/0400 | | 36 | | | |
| Helen 7Nj | | | | | | | | 11.06 |
| Macon (KMCN) | 07/0753 | 998.5 | 07/0337 | | 44 | | | 5.66 |
| Newnanj | | | 07/0702 | | 36 | | | |
| Plainsj | | | 06/2003 | | 35 | | | 6.87 |
| St. Simon's Island (KSSI) | 06/2300 | 1001.9 | 06/1807 | 37 | 47 | | | 3.45 |
| St. Simons Islandi | | | | | | 2.06 | 8.35 | |
| Savannah (KSAV) | 07/2253 | 1004.8 | 06/2219 | | 35 | | | 2.37 |
| Savannah Hunter USAAF (KSVN) | 07/2255 | 1005.1 | 06/2155 | | 38 | | | 4.51 |
| Valdosta (KVLD) | 06/2105 | 993.2 | 06/0127 | 31 | 45 | | | 6.43 |
| Waycross (KAYS) | 06/2320 | 997.3 | 07/0140 | | 39 | | | |
| Waycrossj | | | 06/2304 | | 40 | | | 6.64 |
| Waycross 9SE (USFL) | | | 05/0204 | | 45 | | | |
| NOAA Buoy/C-MAN |
| Buoy 41008 | 07/2250 | 1004.8 | 06/0650 | 33 | 45 | | | |
| Buoy 41009f | 05/1320 | 990.8 | 05/1450 | 52 | 66 | | | |
| Buoy 41010 | 04/2320 | 1003.6 | 04/1350 | 39 | 52 | | | |
| Buoy 41012 | 06/0050 | 1002.7 | 06/0100 | 41e | 54 | | | |
| Buoy 42036 | 06/0850 | 989.6 | 06/0220 | 42e | 55 | | | |
| Buoy 42039 | 06/1950 | 998.1 | 06/0450 | 33 | 41 | | | |
| Buoy 45012 | 09/1500 | 1002.0 | 09/1000 | 35 | 43 | | | |
| Cedar Key, FL (CDRF1) | 06/1000 | 987.6 | 06/1120 | 43e | 59 | | | |
| Duck, NC (DUCN7) | 08/2300 | 1011.9 | 08/1940 | 25e | 34 | | | |
| Dunkirk, NY (DBLN6) | 09/1000 | 1002.2 | 09/1100 | 36 | 47 | | | |
| Folly Beach, SC (FBIS1) | 08/0700 | 1008.4 | 06/1400 | 33 | 39 | | | |
| Fowey Rocks, FL (FWYF1) | 05/0600 | 996.1 | 04/2000 | 53e | 66 | | | |
| Keaton Beach, FL (KTNF1) | 06/1600 | 985.6 | 06/1740 | 35e | 45 | | | |
| Lake Worth, FL (LKWF1) | 05/0500 | 972.5 | 05/0700 | 54 | 73 | | | |
| Long Key, FL (LONF1) | 05/0800 | 1000.7 | 05/0200 | 34 | 45 | 0.5 | 1.67 | |
| Molasses Reef, FL (MLRF1) | 05/0800 | 998.4 | 05/0940 | 42e | 59 | | | |
| St. Augustine, FL (SAUF1) | 05/2200 | 999.0 | 05/2200 | 56 | 71 | | | |
| Sand Key, FL (SANF1) | 05/1000 | 1002.7 | 05/1840 | 37e | 55 | | | |
| Settlement Point, GBI (SPGF1) | 04/1600 | 963.2 | 04/2320 | 73e | 96 | | | |
| Sombrero Key, FL (SMKF1) | 05/0800 | 1002.6 | 05/1740 | 46e | 81 | | 2.23 | |
| Tyndall Tower, Fl (SGOF1) | 06/1600 | 992.2 | 06/0450 | 48e | 58 | | | |
| USF COMPS Stations |
| Buoy NA2 | 05/2210 | 989.5 | 05/1810 | 39 | 47 | | | |
| Aripeka (APK) | 06/0212 | 979.2 | | | | | 4.64 | |
| Egmont Key (EGK) | | | 05/1936 | 45 | 54 | | 4.02 | |
| Homosassa (HOM) | 06/0318 | 983.5 | 06/1724 | 47 | 57 | | 4.51 | |
| New Port Richey (PAS) | 06/0136 | 979.6 | 05/1712 | 31 | 44 | | 4.90 | |
| North Florida Bay (NFB) | 05/0624 | 999.6 | 05/0048 | 33 | 42 | 0.5 | 4.96 | |
| Shell Point (SHP) | 06/1706 | 992.7 | | | | | 4.92f | |
| Tarpon Springs (TAS) | 06/0036 | 980.7 | 05/2030 | | 42 | | 4.04 | |
| Skidaway Institute Stations |
| Tower R2 | 07/2328 | 1005.7 | 06/1028 | 39 | 47 | | | |
| Tower R6 | 07/2100 | 1007.6 | 07/1300 | 35 | 47 | | | |
| Tower R8 | 07/2132 | 1006.3 | 06/0632 | 33 | 39 | | | |
| Unofficial Observations |
| Florida |
| Alligator Pointm | 06/1719 | 984.6 | 05/1920 | | 48 | | | |
| Arlingtonm | 06/0730 | 1000.6 | 06/0625 | | 36 | | | |
| Boca Raton | | | 03/2030 | | 50 | | | |
| Boca Raton Wtr Treatment | | | 03/2054 | | 61 | | | |
| Boynton Beach | N/A | 977.3 | 04/1420 | | 61 | | | |
| Boynton Beach | | | 04/1723 | | 66 | | | |
| Boynton Beach | | | | | | | | 9.56 |
| Clearwaterm | | | 06/1445 | 34 | 56 | | | |
| Clermontm | 05/1835 | 984.0 | 05/1600 | | 56 | | | |
| Delray | | | 04/1835 | | 52 | | | |
| Deerfield Beach | | | | | | | | 8.00 |
| Dunedinm | 05/2315 | 982.3 | 05/1515 | | 42 | | | |
| Flagler Beach FD | 05/2300 | 994.9 | 04/1730 | | 63 | | | |
| Golden Beach | | | 04/1743 | | 50 | | | |
| Holderm | 06/0030 | 987.7 | 06/0700 | | 39 | | | |
| Jacksonvillem | 06/0700 | 1000.2 | 06/0512 | | 40 | | | |
| Juno Beachm | 05/0345 | 963.7 | 05/0830 | | 55 | | | |
| Jupiter PD | | | 04/1655 | 70 | 78 | | | |
| Jupiter Inlet | | | 04/1300 | | 79 | | | |
| Kendall | | | 04/1900 | | 57 | | | |
| Kendall | | | 04/1940 | | 64 | | | |
| Largom | 05/2100 | 981.9 | 05/1700 | | 36 | | | |
| Lawtey | | | | | | | | 13.50 |
| MacClenny | 06/0840 | 998.0 | 06/0010 | | 41 | | | 10.25 |
| Martin County | | | 05/1145 | | 92 | | | |
| Melbourne | | | | | | | | 7.04 |
| Miamim | 05/0617 | 995.1 | 05/0729 | | 50 | | | |
| New Port Richeym | 06/0045 | 980.2 | 05/1630 | | 43 | | | |
| Odessam | 06/0000 | 979.6 | 05/1830 | | 37 | | | |
| Orlando Azalea Parkm | 05/1537 | 988.0 | 05/1305 | | 50 | | | |
| Orlando Pine Hillsm | 05/1815 | 987.7 | | | 46 | | | |
| Ormond Beach PD | | | 05/1620 | | 50 | | | |
| Oviedo | | | | | | | | 9.00 |
| Port Orange | | | | | | | | 15.08 |
| Riviera Beach | | | 04/0510 | | 66 | | | |
| St. James Citym | 05/1847 | 993.5 | 05/1350 | | 37 | | | |
| St. Petersburg Beachm | 05/2115 | 981.6 | 06/1110 | | 50 | | | |
| Sebastienm | 05/1228 | 974.5 | 05/1128 | | 71 | | | |
| Sewall's Point | 05/0345 | 962.0 | 05/0226 | 63 | 85 | | | |
| S. Hutchinson Island | 05/0525 | 959.0 | | | | | | |
| S. Lakeland | 05/2100 | 972.3 | 05/1800 | | 63 | | | 12.01 |
| Starkem | 06/0600 | 996.8 | 06/1600 | | 35 | | | |
| Tampa Bay Crestm | | | 06/1230 | | 50 | | | |
| Tampa University Villagem | 05/2242 | 977.2 | 05/1527 | 37 | 57 | | | |
| Taylor | | | | | | | | 10.00 |
| The Villagesm | 06/0000 | 987.7 | 05/1600 | | 37 | | | |
| Valricom | 05/2030 | 974.5 | 05/1210 | | 49 | | | |
| West Pasco | 06/0400 | 990.6 | | | | | | |
| Georgia |
| Harris | | | 07/0245 | | 41 | | | |
aDate/time is for sustained
wind when both sustained and gust are listed.
bExcept as noted, sustained
wind averaging periods for C-MAN and land-based ASOS reports are 2
min; buoy averaging periods are 8 min.
cStorm surge is water height
above normal astronomical tide level.
dStorm tide is water height
above National Geodetic Vertical Datum (1929 mean sea level).
e 10-min average wind.
fIncomplete record.
g South Florida Water
Management station - 15-min average sustained wind.
hNASA towers are at the
Kennedy Space Center and Cape Canaveral Air Force Station;
elevation 54 ft; all tower records are incomplete.
iNational Ocean Service station -
sustained wind averaging periods are 6 min.
jRAWS station.
kSt. John's River Water Management
District station.
lFAWN station.
mData from Weather Underground web site. |
Table 4: Supplemental storm-total rainfall observations for
Hurricane Frances, 25 August - 8 September 2004.
| Station | Storm-total Rainfall (in) |
| Florida |
| Alapaha Tower (ALAF1) | 4.79 |
| Andytown 2N | 4.13 |
| Antioch (BKRF1) | 7.34 |
| Apollo Beach 1SE (APBF1) | 6.34 |
| Archbold (ACHF1) | 3.21 |
| Archbold 3S (HCAF1) | 4.15 |
| Avon Park 2E (APKF1) | 6.37 |
| Avon Park 2W (AVPF1) | 6.57 |
| Balm (BLMF1) | 7.01 |
| Bartow (BARF1) | 5.98 |
| Bartow 3N (LKAF1) | 5.83 |
| Baxter (BAXF1) | 7.00 |
| Bell 4WNW (BLLF1) | 7.96 |
| Benton | 8.85 |
| Big Pine Key | 3.28 |
| Bowling Green 1S (PAYF1) | 6.21 |
| Bradenton 1S (WCRF1) | 4.10 |
| Bradenton 3SW (PSDF1) | 3.89 |
| Bradenton 11ENE (RYEF1) | 4.87 |
| Brandon 2E (BRDF1) | 5.99 |
| Brooksville (HLKF1) | 10.82 |
| Buckingham (OLGF1) | 3.77 |
| Bushnell (BSWF1) | 7.70 |
| Carrollwood 1N (BALF1) | 7.32 |
| Carrollwood 1SW (WITF1) | 6.43 |
| Chassahowitzka 1E (CHSF1) | 15.81 |
| Chiefland 5SE (CHIF1) | 7.29 |
| Clearwater (ALLF1) | 4.75 |
| Cooper City | 4.22 |
| Coral Springs (CSSF1) | 11.67 |
| Coral Springs 11W | 4.03 |
| Crescent City (CREF1) | 4.43 |
| Cross City (KCTY) | 4.89 |
| Dade City 2E (DCYF1) | 7.54 |
| Deland | 11.26 |
| Devils Garden | 5.55 |
| Dowling Park (DOWF1) | 6.23 |
| Dundee 1W (LKHF1) | 6.58 |
| Dunedin (CCKF1) | 6.50 |
| Dunedin 1SE (CRCF1) | 5.31 |
| Dunnellon 3N (RASF1) | 10.60 |
| Dunnellon 5 ESE (DLLF1) | 11.30 |
| Durant 1E (LKMF1) | 7.71 |
| Edgeville (EDGF1) | 4.71 |
| Ellenton 2NE (GHMF1) | 4.88 |
| Ellenton 3SE (CYSF1) | 6.16 |
| Ellenton 9E (GCRF1) | 5.69 |
| Federal Point (HASF1) | 8.73 |
| Melbourne WFO | 8.11 |
| Miami Beach | 3.74 |
| Middleburg (MDDF1) | 8.70 |
| Myakka City (MKAF1) | 4.80 |
| Myakka Head 4NE (HORF1) | 6.10 |
| Myakka Head 8W (MKHF1) | 3.95 |
| Nocatee 5W (HCKF1) | 3.39 |
| North Miami Beach | 3.71 |
| North Port 2N (NPOF1) | 3.34 |
| North Port 11NE (MRDF1) | 3.37 |
| Ocala (OCAF1) | 11.05 |
| Odessa 3SSW (ISFF1) | 6.85 |
| Odessa 4S (CLKF1) | 6.21 |
| Oldsmar 2W (TBFF1) | 5.63 |
| Oldsmar 3NE (OLDF1) | 3.97 |
| Ona (ONAF1) | 5.53 |
| Oneco (ONEF1) | 4.22 |
| Oneco 2SE (PDRF1) | 4.34 |
| Orlando East | 7.91 |
| Orange Springs 2SSW (OSPF1) | 13.63 |
| Osprey 1E (OPRF1) | 3.05 |
| Palatka (PTKF1) | 11.42 |
| Palm Bay | 7.27 |
| Palm Harbor 3NE (TRSF1) | 7.57 |
| Palmetto 4NE (RUBF1) | 4.90 |
| Penny Farms (PNYF1) | 8.73 |
| Pinellas Park (SJOF1) | 4.88 |
| Pinellas Park (PNBF1) | 4.31 |
| Pinellas Park2SE (SAWF1) | 4.43 |
| Plant City (PLCF1) | 4.00 |
| Plant City 2S (PCTF1) | 7.21 |
| Plymouth | 7.95 |
| Polk City (PLKF1) | 6.57 |
| Port Salerno | 8.68 |
| Ridge Manor 2SE (WTRF1) | 8.11 |
| Ruskin WFO (KTBW) | 5.53 |
| Safety Harbor (SHBF1) | 4.80 |
| St. Augustine Lighthouse (STAF1) | 5.20 |
| St. Leo (STLF1) | 3.22 |
| San Antonio 3S (SNTF1) | 8.14 |
| Sanford | 7.54 |
| Sarasota 5E (SRAF1) | 3.62 |
| Seffner 2E (BKCF1) | 8.15 |
| Starke (SRKF1) | 9.97 |
| Suwannee 6NE (SWNF1) | 15.44 |
| Tampa 2E (TBEF1) | 8.44 |
| Tampa 4NE (HRIF1) | 8.07 |
| Tampa By. Can. S-155 (TBCF1) | 7.92 |
| Tampa By. Can. S-159 (TBAF1) | 7.17 |
| Tampa By. Can. S-160 (TBBF1) | 6.39 |
| Homerville (GAEMN) | 6.19 |
| Homerville 5N (HMVG1) | 7.40 |
| Jesup 8S (JSUG1) | 9.80 |
| Lakeland (LAKG1) | 5.79 |
| Leary 5ENE (LERG1) | 6.93 |
| Lumber City (LBRG1) | 8.68 |
| Madray Springs 2WNW (MRYG1) | 10.78 |
| McIntyre 6SW (MCIG1) | 7.65 |
| Metter 1SE (MTFG1) | 11.91 |
| Moody AFB (KVAD) | 8.30 |
| Mountain City 2N (MTCG1) | 8.10 |
| Mountain City 2SW (MCTG1) | 9.34 |
| Nahunta (GAEMN) | 9.22 |
| Nahunta 6NE (NAHG1) | 10.64 |
| Naseville (NSHG1) | 6.55 |
| Offerman (OFFG1) | 9.34 |
| Okefenokee 9SW (SWCG1) | 7.71 |
| Patterson (PATG1) | 11.94 |
| Peachtree City (KFFC) | 3.77 |
| Pridgen (PRDG1) | 5.58 |
| Redisville (REDG1) | 9.80 |
| Statenville (STNG1) | 6.68 |
| Sterling 3SW (STRG1) | 7.25 |
| TallulaFalls (TLUG1) | 11.28 |
| Tallulah Falls 1NE (TFLG1) | 10.03 |
| Tugalo Dam (TUGG1) | 11.08 |
| Warner Robbins AFB (KWRB) | 6.45 |
| Waycross 4NE (AYSG1) | 6.86 |
| Willacoochee 5ENE (WILG1) | 6.80 |
| Woodbine (WBNG1) | 7.83 |
| Yonah Dam (YNHG1) | 9.93 |
| Alabama |
| Bleecker (BLEA1) | 3.20 |
| |
| South Carolina |
| Anderson (KAND) | 6.20 |
| Caesars Head (CAES1) | 12.14 |
| Calhoun Falls (CALS1) | 7.78 |
| Calhoun Falls 5S (RBRS1) | 6.99 |
| Chesnee 7 WSW (CNES1) | 6.58 |
| Clemson (KCEU) | 6.34 |
| Clemson University (CLES1) | 7.00 |
| Columbia (KCAE) | 3.69 |
| Columbia Downtown (KCUB) | 3.46 |
| Gaffney 6E (GAFS1) | 6.61 |
| Greenville-Spartanburg Arpt (KGSP) | 5.42 |
| Greenwood (KGRD) | 4.61 |
| Hartsville (HVLS1) | 6.33 |
| Jackson 1S (RAWS) | 7.50 |
| Jocassee (JCSS1) | 8.08 |
| Lake Toxaway (LTYN7) | 10.87 |
| Linville Falls (JSRN7) | 18.07 |
| Mackall USAAF (KHFF) | 4.23 |
| Maxton (KMEB) | 5.44 |
| Monroe (KEQY) | 5.49 |
| Morganton (MRGN7) | 7.35 |
| Morganton (MGTN7) | 11.32 |
| Mt.Pisgah (MTPN7) | 11.40 |
| Nebo 7NE (NCVN7) | 11.04 |
| New Bern (KEWN) | 5.10 |
| Old Fort (OLFN7) | 9.62 |
| Pisgah Forest (PISN7) | 7.51 |
| Pleasant Gardens (PLGN7) | 8.67 |
| Plumtree (PLMN7) | 8.52 |
| Rich Mtn. (RCMN7) | 12.50 |
| Roaring Creek (RCAN7) | 9.68 |
| Rosman (RMNN7) | 9.62 |
| Rosman 6E (CFFN7) | 12.98 |
| Rutherfordton 3N (RUTN7) | 7.36 |
| Sunburst (SNBN7) | 9.86 |
| Triplett (TPHN7) | 8.07 |
| Triplett (TPTN7) | 8.68 |
| Tyron (TRYN7) | 10.29 |
| Walker Top (WKTN7) | 13.64 |
| Wilbar (WLBN7) | 7.16 |
| Wilmington (KILM) | 3.12 |
| Winston-Salem (KINT) | 3.82 |
| Wisemans View (WISN7) | 10.78 |
| Yancy (YNCN7) | 7.41 |
| Tennessee |
| Leconte (MTLT1) | 3.46 |
| |
| Kentucky |
| Harlan (LYLK2) | 4.49 |
| Jackson (KJKL) | 4.26 |
| Virginia |
| Apple Orchard Mtn. (APEV2) | 10.24 |
| Big Meadows (BGMV2) | 11.50 |
| Buena Vista (BUVV2) | 5.61 |
| Charlottesville (KCHO) | 3.03 |
| Copper Hill (COHV2) | 8.12 |
| Free Union (FRUV2) | 10.00 |
| Galax Water Plant (GAAV2) | 5.83 |
| Glasgow 1SE (GLAV2) | 7.13 |
| Goshen (GOHV2) | 10.13 |
| Hot Springs (HSPV2) | 5.32 |
| Lexington (NOHV2) | 6.14 |
| Mason Cove (MASV2) | 7.05 |
| Mathews Arm (MATV2) | 10.00 |
Table 5: Preliminary forecast evaluation
(heterogeneous sample) for Hurricane Frances, 25 August - 8
September 2004. Forecast errors (n mi) are followed by the number
of forecasts in parentheses. Errors smaller than the NHC official
forecast (OFCL) are shown in bold-face type. Verification includes
the depression stage, but does not include the extratropical stage,
if any.
| Forecast Technique | Period (hours) |
| 12 | 24 | 36 | 48 | 72 | 96 | 120 |
| CLP5 | 27 (53) | 58 (53) | 96 (53) | 144 (52) | 266 (48) | 402 (44) | 535 (40) |
| GFDI | 19 (53) | 34 (53) | 50 (53) | 68 (52) | 108 (48) | 156 (44) | 222 (40) |
| GFDL* | 22 (51) | 33 (51) | 44 (51) | 61 (51) | 101 (48) | 145 (44) | 200 (40) |
| GFNI | 27 (51) | 49 (51) | 74 (51) | 94 (50) | 140 (46) | 204 (42) | 290 (38) |
| GFDN* | 33 (51) | 52 (50) | 74 (50) | 97 (49) | 129 (45) | 186 (41) | 263 (37) |
| AF1I | 28 (48) | 51 (48) | 75 (48) | 102 (47) | 165 (43) | | |
| AFW1* | 43 (25) | 72 (25) | 89 (25) | 106 (24) | 153 (22) | | |
| COAI | 30 (32) | 64 (32) | 102 (32) | 141 (30) | 222 (27) | | |
| COAL* | 30 (17) | 53 (17) | 92 (17) | 119 (15) | 193 (14) | | |
| COEI | 34 (26) | 74 (26) | 119 (26) | 165 (25) | | | |
| COCE* | 30 (14) | 62 (14) | 101 (13) | 145 (13) | | | |
| LBAR | 19 (53) | 34 (53) | 45 (53) | 58 (52) | 88 (48) | 114 (44) | 134 (40) |
| A98E | 28 (53) | 49 (53) | 76 (53) | 123 (52) | 261 (48) | 382 (44) | 475 (40) |
| A9UK | 28 (26) | 50 (26) | 80 (26) | 108 (25) | 233 (23) | | |
| BAMD | 21 (53) | 35 (53) | 49 (53) | 61 (52) | 81 (48) | 113 (44) | 161 (40) |
| BAMM | 24 (53) | 43 (53) | 64 (53) | 81 (52) | 104 (48) | 126 (44) | 159 (40) |
| BAMS | 29 (52) | 52 (52) | 72 (52) | 94 (52) | 119 (48) | 139 (44) | 152 (40) |
| NGPI | 29 (52) | 52 (51) | 74 (51) | 94 (50) | 132 (46) | 191 (42) | 272 (37) |
| NGPS* | 29 (53) | 52 (53) | 76 (53) | 92 (50) | 122 (47) | 169 (41) | 253 (38) |
| UKMI | 28 (52) | 53 (52) | 77 (52) | 92 (51) | 120 (47) | 160 (43) | 221 (39) |
| UKM* | 33 (27) | 49 (27) | 77 (27) | 97 (26) | 128 (24) | 161 (22) | 211 (20) |
| GFSI | 21 (52) | 34 (52) | 48 (52) | 62 (51) | 91 (47) | 118 (43) | 155 (39) |
| GFSO* | 22 (54) | 34 (54) | 49 (54) | 62 (52) | 89 (48) | 117 (44) | 146 (40) |
| AEMI | 24 (52) | 38 (52) | 49 (52) | 62 (51) | 87 (47) | 114 (43) | 149 (39) |
| AEMN* | 30 (52) | 42 (52) | 55 (52) | 66 (50) | 87 (46) | 110 (42) | 132 (38) |
| GUNS | 20 (51) | 37 (51) | 54 (51) | 69 (50) | 90 (46) | 125 (42) | 184 (37) |
| GUNA | 18 (51) | 33 (51) | 45 (51) | 56 (50) | 72 (46) | 101 (42) | 150 (37) |
| CONU | 20 (53) | 35 (52) | 50 (52) | 63 (51) | 85 (47) | 120 (43) | 172 (39) |
| FSSE* | 17 (49) | 30 (49) | 40 (49) | 53 (49) | 64 (45) | 75 (38) | 127 (35) |
| OFCI | 22 (53) | 40 (53) | 53 (53) | 64 (52) | 80 (48) | 103 (44) | 144 (40) |
| OFCL | 20 (53) | 36 (53) | 52 (53) | 66 (52) | 80 (48) | 100 (44) | 128 (40) |
| NHC Official (1994-2003 mean) | 44 (3172) | 78 (2894) | 112 (2636) | 146 (2368) | 217 (1929) | 248 (421) | 319 (341) |
* Output from these models was
unavailable at forecast time. |
Table 6: Watch and warning summary for
Hurricane Frances, 25 August - 8 September 2004.
| Date/Time | Action | Location |
| 29 / 2100 | Tropical Storm Watch issued | Anguilla, Antigua, Barbuda, St. Maarten |
| 30 / 0300 | Tropical Storm Warning issued | Anguilla, Antigua, Barbuda, Nevis, Saba, St. Kitts, St. Eustatius, St.
Maarten |
| 30 / 0300 | Hurricane Watch issued | British Virgin Islands, northern U. S. Virgin Islands,
Culebra, Vieques |
| 30 / 1500 | Tropical Storm Watch issued | Puerto Rico, St. Barthelemy, St. Martin |
| 30 / 1500 | Hurricane Watch changed to Tropical Storm Watch | Vieques |
| 30 / 2100 | Tropical Storm Warning issued | Puerto
Rico, Culebra, Vieques, British Virgin Islands, northern U. S. Virgin Islands |
| 30 / 2100 | Tropical Storm Watch issued | St Croix |
| 30 / 2100 | Hurricane Watch discontinued | All |
| 31 / 0300 | Tropical Storm Watch issued | Northern coast of the Dominican Republic from Manzanillo Bayto Cabo
Engano |
| 31 / 0300 | Tropical Storm Warning issued | Guadeloupe |
| 31 / 0900 | Tropical Storm Warning discontinued | Antigua, Barbuda, Nevis, St. Kitts |
| 31 / 0900 | Hurricane Watch issued | Southeastern Bahamas,Turks
and Caicos Islands |
| 31 / 1500 | Hurricane Warning issued | Southeastern Bahamas, Turks and Caicos Islands |
| 31 / 1500 | Tropical Storm Warning issued | Northern coast of the
Dominican Republic Punta Gorda to Manzanillo Bay |
| 31 / 1500 | Hurricane Watch issued | Central
Bahamas |
| 31 / 1500 | Tropical Storm Warning discontinued | Anguilla, Antigua, Barbuda, Guadeloupe, Nevis, Saba, St. Eustatius, St.
Maarten |
| 31 / 1500 | Tropical Storm Watch discontinued | St. Barthelemy, St. Croix, St. Martin, and Dominican Republic coast south of Punta Gorda |
| 31 / 2100 | Tropical Storm Warning discontinued | Puerto Rico, Culebra, Vieques, U. S. and British Virgin islands |
| 1 / 1500 | Hurricane Warning issued | Central Bahamas |
| 1 / 1500 | Hurricane Watch issued | Northwestern Bahamas |
| 1 / 2100 | Tropical Storm Warning discontinued | Dominican Republic |
| 2 / 0000 | Hurricane Warning issued | Northwestern Bahamas |
| 2 / 0300 | Hurricane Watch issued | Florida east coast from Florida City to Flagler Beach including Lake Okeechobee |
| 2 / 0300 | Tropical Storm Watch issued | Florida Keys from Florida City to Seven Mile Bridge including
Florida Bay |
| 2 / 0900 | Hurricane Watch extended southward | Florida Keys from Florida City to Craig
Key |
| 2 / 1500 | Hurricane Warning issued | Florida east coast from Florida City to Flagler Beach including Lake Okeechobee |
| 2 / 1500 | Hurricane Watch and
Tropical Storm Warning issued | Florida Keys from Florida City to Seven Mile Bridge including
Florida Bay |
| 2 / 1500 | Hurricane Warning discontinued | Turks and Caicos Islands |
| 3 / 0300 | Hurricane Warning discontinued | Southeastern Bahamas |
| 3 / 1500 | Hurricane Watch extended northward | Floridacoast from Flagler Beach to Fernandina Beach |
| 3 / 2100 | Tropical Storm Warning issued | Floridacoast from Flagler Beach to Fernandina Beach |
| 3 / 2100 | Hurricane Warning discontinued | Central
Bahamas |
| 4 / 0300 | Tropical Storm Warning issued | Florida southwest coast from Bonita Beach to Florida City |
| 4 / 0300 | Tropical Storm Watch issued | Florida west coast from Bonita Beach to Suwannee River |
| 4 / 0900 | Tropical Storm Warning extended northward | Florida west coast from Bonita Beach to Englewood |
| 4 / 1500 | Tropical Storm Warning extended northward | Florida and Georgia coasts from Fernandina Beach to Altamaha Sound |
| 4 / 1500 | Tropical Storm Warning extended northward | Florida west coast from Englewood to Anna Maria Island |
| 4 / 1500 | Tropical Storm Watch extended northward | Florida west coast from Suwannee River to St Marks |
| 4 / 2100 | Tropical Storm Warning extended northward | Florida west coast from Anna Maria Island to St. Marks |
| 4 / 2100 | Tropical Storm Watch extended westward | Florida Gulf coast from St. Marks to Panama City |
| 4 / 2100 | Hurricane Warning discontinued | Northwestern Bahamas except Grand Bahama, Abaco, Bimini, and
the Berry Islands |
| 5 / 0900 | Hurricane Warning changed to Tropical Storm Warning | Florida southeast coast from Deerfield Beach to Florida City |
| 5 / 0900 | Tropical Storm Warning issued | Florida Keys south of Seven Mile Bridge including the Dry Tortugas |
| 5 / 1500 | Hurricane Warning issued | Florida Gulf coast from Suwannee River to Destin |
| 5 / 1500 | Hurricane Watch discontinued | Florida east coast from Flagler Beach to Fernandina Beach |
| 5 / 1500 | All warnings discontinued | Northwestern Bahamas |
| 5 / 2100 | Hurricane Warning extended southward | Florida west coast from Suwannee River to Anna Maria Island |
| 5 / 2100 | Hurricane warning changed to tropical storm warning | Florida east coast from Jupiter Inlet to Flagler Beach including Lake
Okeechobee |
| 5 / 2100 | All warnings discontinued | Florida east coast from Florida City to Jupiter Inlet |
| 6 / 0600 | Tropical Storm Warning discontinued | Florida west coast from
Bonita Beach to Florida City including the Florida Keys, the Dry
Tortugas, and Lake Okeechobee |
| 6 / 0900 | All warnings discontinued | Florida west coast south of Englewood and Florida east coast south
of CocoaBeach |
| 6 / 1500 | Hurricane Warning changed to Tropical Storm Warning | Florida Gulf coast from Indian Pass to Destin and Florida west
coast from Anna Maria Island to SuwanneeRiver |
| 6 / 1500 | All warnings
discontinued | Georgia coast, Florida east coast, and Florida west coast south of
Anna Maria Island |
| 6 / 2100 | Hurricane Warning changed to Tropical Storm Warning | Florida Gulf coast from Suwannee River to St Marks |
| 6 / 2100 | All warnings
discontinued | Florida coast west of St. Marks and south of Suwannee River |
| 7 / 0300 | All warnings discontinued | Florida coast |
Figure 1:
Best track positions for
Hurricane Frances, 25 August - 8 September 2004.
Figure 2:
Selected wind observations and
best track maximum sustained surface wind speed curve for Hurricane
Frances, 25 August - 8 September 2004. Aircraft observations have
been adjusted for elevation using 90% and 80% reduction factors for
observations from 700 mb and 850 mb respectively. Dropwindsonde
observations include actual 10 m winds (sfc), as well as surface
estimates derived from the mean wind over the lowest 150 m of the
wind sounding (LLM), and from the sounding boundary layer mean
(MBL). Objective Dvorak estimates represent linear averages over a
three-hour period centered on the nominal observation time.
Vertical black lines indicate times of landfalls.
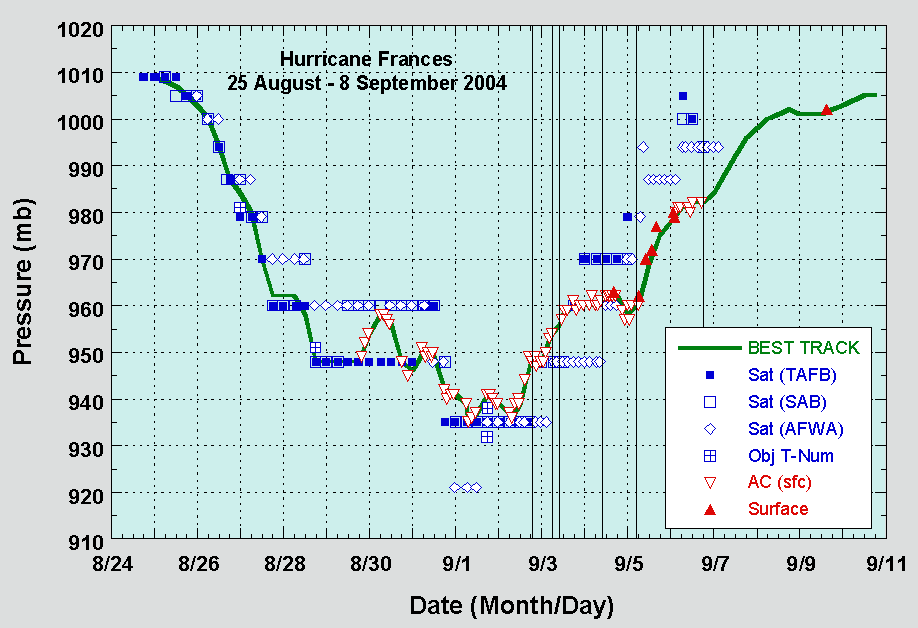
Figure 3:
Selected pressure observations
and best track minimum central pressure curve for Hurricane
Frances, 25 August - 8 September 2004. Objective Dvorak estimates
represent linear averages over a three-hour period centered on the
nominal observation time. Vertical black lines indicate times of
landfalls.
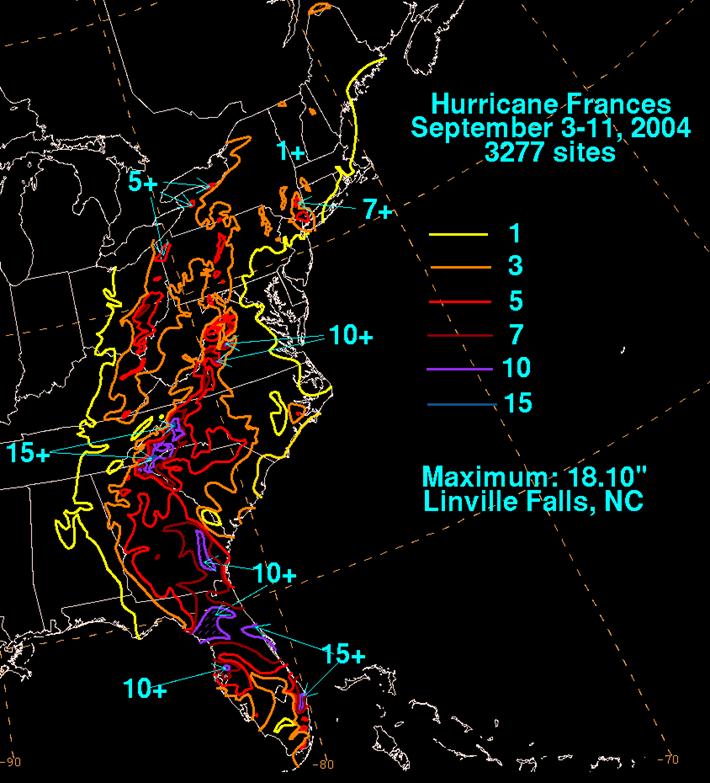
Figure 4:
Storm-total rainfalls for
Hurricane Frances, 25 August - 8 September 2004. Figure courtesy of
David Roth of the Hydrometeorological Prediction Center.
|


