![[NCEP Logo]](https://webarchive.library.unt.edu/eot2008/20080916074051im_/http://www.nhc.noaa.gov/graphics/ncep.gif)
Text-only version
(printer friendly)
TROPICAL CYCLONE REPORTS
Tropical Storm Allison
Tropical Depression Two
Tropical Storm Barry
Tropical Storm Chantal
Tropical Storm Dean
Hurricane Erin
Hurricane Felix
Hurricane Gabrielle
Tropical Depression Nine
Hurricane Humberto
Hurricane Iris
Tropical Storm Jerry
Hurricane Karen
Tropical Storm Lorenzo
Hurricane Michelle
Hurricane Noel
Hurricane Olga
|
Tropical Cyclone Report
Hurricane Iris
4 - 9 October 2001
Lixion A. Avila
National Hurricane Center
30 October 2001
Hurricane Iris was a small but severe Category Four hurricane
that devastated southern Belize.
a. Synoptic History
The precursor of Iris was a poorly defined tropical wave that
moved westward across the tropical Atlantic during the last days of
September. A very hostile upper-level wind environment, caused by a
large upper-level trough with an embedded low centered just to the
northeast of the Lesser Antilles, prevailed over the Atlantic. As
the tropical wave reached 50 W on the 3rd of October,
the upper-low became detached from the trough and began to move
toward the southwest over the eastern Caribbean Sea. This resulted
in the development of an upper-level ridge over the tropical wave
providing a more favorable environment for tropical cyclone
formation. While this pattern was evolving, satellite imagery
indicated an increase in the thunderstorm activity and a cyclonic
rotation in the mid-levels. Gradually, a low-level cloud
circulation became more pronounced on satellite imagery and was
later confirmed by surface observations. It is estimated that a
tropical depression with a poorly-defined center formed from this
system about 85 n mi southeast of Barbados at 1200 UTC 4
October.
The depression moved toward the west and west-northwest through
the southern Windward Islands, accompanied by squalls and
significant (> 3 mb) 24-h pressure falls. It is estimated that
the depression reached tropical storm status at 1200 UTC 5 October,
about 240 n mi south-southeast of San Juan Puerto Rico. Although
the cloud pattern continued to be impressive on satellite and was
typical of a tropical storm, the low-level center was very poorly
defined as indicated by several passes of a reconnaissance plane
through the system. Only a gradual strengthening occurred during
the following 12 to 18 hours and Iris became a hurricane very near
the Barahona Peninsula, Dominican Republic at 1800 UTC 6
October.
The well-established middle-level ridge north of Iris became
stronger and forced the tropical cyclone to move on a straight
westward track. This allowed Jamaica to escape from the small core
of Iris which passed just to its south during the morning of the
7th . Once Iris moved away from Jamaica and headed for
Belize, it moved over a region where the upper-oceanic heat content
was very high. As a result of favorable atmospheric and oceanic
conditions, intensification began and the minimum pressure dropped
from 990 mb to 950 mb in about 18 hours and the winds increased
from 75 to 120 knots. Iris became a powerful Category Four
hurricane on the Saffir/Simpson Hurricane Scale (SSHS) by 1200 UTC
8 October. Historically, a large number of hurricanes have become
major hurricanes in this portion of the Caribbean Sea.
Near the time of the peak intensity, the hurricane hunter plane
reported three small concentric eyewalls and an hour later the
inner eyewall collapsed . The maximum winds then temporarily
decreased to 115 knots. The hurricane moved on a track between the
west and west-southwest and based on radar from Belize, Iris made
landfall in southern Belize in the vicinity of Monkey River Town
around 0200 UTC 9 October. This location is about 60 n mi south of
Belize City. Iris intensified just before landfall and the maximum
winds peaked at 125 knots with a minimum pressure of 948 mb.
Thereafter, Iris continued westward and weakened rapidly over the
mountains of Central America. The low-level center could no longer
be traced by 1800 UTC 9 October. Figure 1 shows a Iris near its
peak intensity
b. Meteorological Statistics
Table 1 gives the "best track" positions and
intensities of Iris
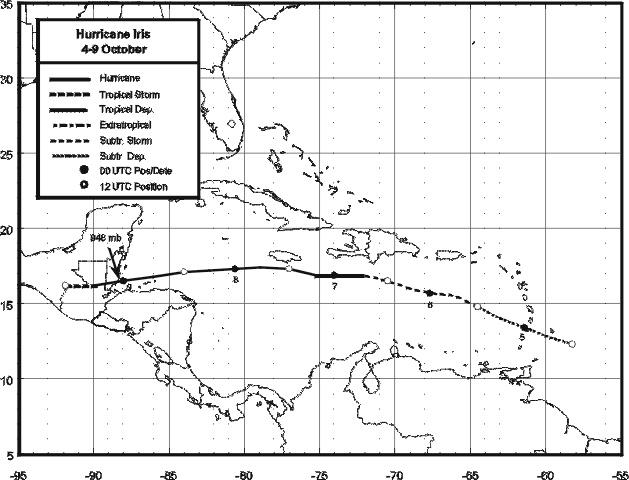
at six-hourly intervals. Figure 2 shows a plot of this track.
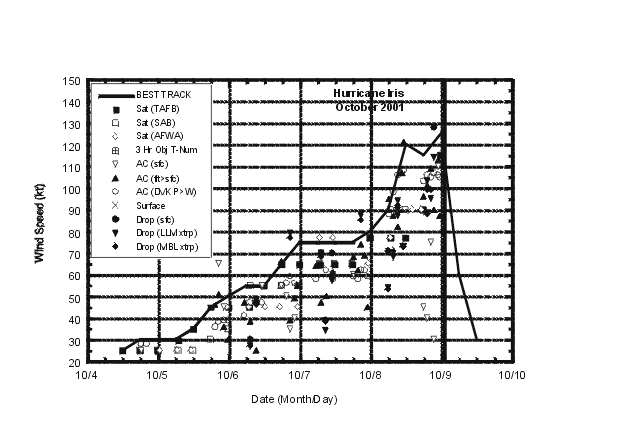
Figure 3 and Figure 4 depict the curves of the
maximum one-minute average (10 m above sea-level) wind speed and
minimum sea-level pressure,
respectively, as functions of time. The observations on which the
curves are based are also plotted. These observations consist of
data from reconnaissance flights, including dropwindsonde
measurements as well as satellite-based Dvorak-technique estimates
using satellite imagery by the Tropical Analysis and Forecast
Branch (TAFB), Satellite Analysis Branch (SAB), and the U.S. Air
Force Weather Agency (AFWA).
Iris was characterized by the small diameter of its core. The
first reconnaissance into the system had difficulties in closing
the circulation, not only because it was poorly defined but also
because the center of circulation was very small. Furthermore,
despite the good organization of the cloud pattern on satellite,
the surface center was so small and poorly defined that the
reconnaissance plane had to climb to 850 mb to" fix" it on the
5th about 1800 UTC. Extrapolated minimum pressure at
that time was 1004 mb with flight-level winds to near 64 knots. A
post-analysis of pressure, wind and Dvorak classifications suggests
Iris reached tropical storm status earlier than indicated in the
advisories. Iris was upgraded to a hurricane at 1800 UTC 6 October,
based on reports from a reconnaissance plane of a 1500-foot flight
level peak wind of 82 knots and the presence of a closed eyewall
near that time. A couple of hours later a GPS dropsonde launched
from an Air Force plane indicated that surface winds peaked at 75
knots. Iris was upgraded to Category Four Hurricane with 120 knots
at 1200 UTC 8 October based on a 134-knot wind reduced from 700-mb.
Because the eye was so small, dropsondes never hit the true center.
The 954 mb reported by the drop was then adjusted to 950 mb. After
an eyewall replacement cycle and a temporary weakening, Iris
re-intensified and the winds peaked at 125 knots with a minimum
pressure of 948 mb. This is based on a 127-knot surface winds
measured by a dropsonde combined with satellite objective T-numbers
between 6.5 and 7.0 on the Dvorak scale for about 3 hours. The
maximum winds recorded at Belize was a gust of 106 mph on Carmen
Davis station in Big Creek at 16.5 N 88.4 W at 0200 UTC 9
October.
c. Casualty and Damage Statistics
Because Iris core was small the damage was concentrated within a
60 n mi wide area mainly through the southern portion of Belize.
According to the Belize Times the areas hardest hit by
Iris were Monkey River Town, where the eye made landfall, and the
towns of Placencia, and Independence with a 8 to 15 feet surge. The
newspaper noted "Iris showed no mercy and proceeded to smash to
smithereens everything in her path". The storm destroyed many
houses in Placencia, and most of the houses at Monkey River Town
seem to have been demolished by the hurricane. In addition to 3
people killed in the Dominican Republic by the tropical cyclone,
the 120-foot boat M/V Wave Dancer, with 28 people on board,
capsized near Big Creek, a deep water port to the west of
Placencia. Twenty people are feared dead. Eleven bodies have been
recovered and eight survived. Another boat, The Vendera, also
reportedly capsized with people on board, but information on this
vessel has not been confirmed. Some newspaper reports indicate that
the death toll could be 50 or more but the Belize government
confirms 20 dead, all associated with the "Wavedancer" The banana
crop was totally destroyed. Reports from the Miami Herald
indicate that at least 8 people were killed by flash flooding in
Guatemala. Probably the exact number of deaths will not be known
but it appears that the total number is 31 associated with Iris. A
total of $66.2 million in damage has been reported by the
Government of Belize. There are no reports of damage from
Honduras.
d. Forecast and Warning Critique
Table 2 displays the official track and selected model errors
for Iris. The official errors were 34, 73,123,177 and 292 n mi for
the 12, 24, 36, 48 and 72 h forecasts. These numbers indicate that
with the exception of the 12 and 24 h periods, the forecasts were
worse than the past 10-yr average. Not only were the official
forecasts worse than long-term averages but several models
performed much better than the official forecast at all times as
indicated by bold letters in Table 4. These official track errors
are unusually large for westward moving systems in the deep
tropics. They appear to be related to the speed and not the storm's
direction of motion. Most of the official forecasts assumed that
the steering currents would weaken and, consequently, Iris would
slow down. On the contrary, Iris continued at the same speed and
moved even faster just before landfall. Iris was always forecast to
continue westward through the Caribbean Sea, posing a threat to the
Caribbean Sea region and not to the United States. Table 3
shows a compilation of watches and warnings.
On average, the intensity of Iris was underestimated and the
largest errors occurred during the rapid intensification phase.
This is common because these peaks in intensity are usually not
possible to forecast with the currently. The Ships intensity
forecast model also underestimated the intensity but a couple of
forecasts indicated that 3 or more of the 5 conditions for rapid
intensification were satisfied. Nevertheless, it was stated in the
advisories that Iris had the potential to become a dangerous
hurricane Category 3 or higher over the northwestern Caribbean
Sea.
Acknowledgments
Martin Nelson helped with the checking of
observations and Michelle Mainelli helped with the report.
Table 1: Best track for Hurricane Iris, 4 - 9 October 2001.
Date/Time
(UTC) | Position | Pressure
(mb) | Wind Speed
(kt) | Stage |
| Lat. (°N) | Lon. (°W) |
| 04 / 1200 | 12.3 | 58.2 | 1011 | 25 | tropical depression |
| 04 / 1800 | 12.8 | 59.9 | 1010 | 30 | " |
| 05 / 0000 | 13.4 | 61.4 | 1010 | 30 | " |
| 05 / 0600 | 14.0 | 63.0 | 1010 | 30 | " |
| 05 / 1200 | 14.8 | 64.5 | 1008 | 35 | tropical storm |
| 05 / 1800 | 15.5 | 66.0 | 1005 | 45 | " |
| 06 / 0000 | 15.7 | 67.7 | 1001 | 50 | " |
| 06 / 0600 | 16.0 | 69.0 | 998 | 55 | " |
| 06 / 1200 | 16.5 | 70.5 | 998 | 55 | " |
| 06 / 1800 | 16.9 | 72.2 | 992 | 65 | hurricane |
| 07 / 0000 | 16.9 | 74.0 | 993 | 75 | " |
| 07 / 0600 | 16.9 | 75.3 | 989 | 75 | " |
| 07 / 1200 | 17.3 | 77.0 | 989 | 75 | " |
| 07 / 1800 | 17.4 | 78.9 | 991 | 75 | " |
| 08 / 0000 | 17.3 | 80.6 | 988 | 80 | " |
| 08 / 0600 | 17.2 | 82.3 | 963 | 90 | " |
| 08 / 1200 | 17.1 | 84.0 | 950 | 120 | " |
| 08 / 1800 | 16.8 | 86.0 | 950 | 115 | " |
| 09 / 0000 | 16.5 | 88.0 | 948 | 125 | " |
| 09 / 0600 | 16.2 | 89.9 | 1005 | 60 | tropical storm |
| 09 / 1200 | 16.2 | 91.9 | 1004 | 30 | tropical depression |
| 09 / 1800 | | | | | dissipated |
| 09/ 0200 | 16.3 | 88.4 | 948 | 125 | landfall near Monkey River Town, Belize |
| 09 / 0000 | 16.5 | 88.0 | 948 | 125 | minimum pressure |
Table 2: Preliminary track forecast evaluation for Hurricane Iris - heterogeneous sample. Errors in nautical miles for
tropical storm and hurricane stages with number of forecasts in
parentheses. Bold numbers represent forecasts which were
better than the official forecast.
| Forecast Technique | Period (hours) |
| 12 | 24 | 36 | 48 | 72 |
| CLIP | 35 (13) | 78 (12) | 153 (10) | 238 (8) | 429 (4) |
| GFDI | 40 (14) | 71 (12) | 117 (10) | 157 (8) | 152 (4) |
| LBAR | 39 (13) | 83 (12) | 162 (10) | 241 (8) | 367 (4) |
| AVNI | 41 (10) | 70 (8) | 112 (6) | 147 (3) | 225 (2) |
| BAMD | 29 (14) | 65 (12) | 128(10) | 188(8) | 290 (4) |
| BAMM | 26 (14) | 46 (12) | 91 (10) | 143 (8) | 228 (4) |
| BAMS | 34 (14) | 64 (12) | 123 (10) | 175 (8) | 265 (4) |
| NGPI | 49 (13) | 84 (12) | 135 (10) | 174 (8) | 311 (4) |
| UKMI | 40 (10) | 71 (9) | 92 (7) | 181 (3) | X |
| GUNS | 34 (10) | 57 (9) | 96 (7) | 144 (3) | X |
| NHC Official | 34 (14) | 73 (12) | 123 (10) | 177 (8) | 292 (4) |
| NHC Official(1991-2000 mean) | 44 (2049) | 82 (1835) | 118 (1646) | 151 (1475) | 226 (1187) |
| *Output from these models was unavailable at time of forecast issuance. |
Table 3: Watch and warning summary, Hurricane Iris, 4 - 9 October 2001.
| Date/Time | Action | Location |
| 5/1500 | Tropical Storm Warning issued | Dominican Republic(DR), from Isla Saona to Cabo Beata |
| 5/1500 | Tropical Storm Watch
issued | west of Cabo Beata to Anse D Hainault, Haiti |
| 5/2100 | Hurricane Warning issued | Barahona to Anse D Hainault |
| 5/2100 | Tropical Storm Watch issued | Jamaica |
| 6/0300 | Hurricane Watch issued | Cuba for the provinces of Guantanamo to
Camaguey and for Jamaica |
| 6/0600 | Tropical Storm Warning
discontinued | east of Punta Palenque to Isla Saona |
| 6/0900 | Tropical Storm Warning issued | Jamaica |
| 6/1500 | Hurricane Warning issued | Jamaica and for the provinces of
Granma, Santiago de Cuba, and Guantanamo, Cuba |
| 6/1500 | Hurricane Watch issued | Cayman Islands |
| 6/2100 | Tropical Storm Warning discontinued | Palenque to Barahona, DR |
| 7/0200 | Hurricane Warning issued | Cayman
Islands |
| 7/0300 | All Warning discontinued | Dominican Republic |
| 7/0900 | All Warnings discontinued | Haiti |
| 7/1500 | Hurricane Watch issued | Cabo Catoche southward, Yucatan |
| 7/1500 | All Warnings discontinued | Cuba |
| 7/1800 | Hurricane Watch issued | for Belize from Belize City
northward |
| 7/2100 | Tropical Storm Warning/Hurricane
Watch | north coast of Honduras and adjacent
islands from Limon westward |
| 7/2100 | Hurricane Warning
discontinued | Jamaica |
| 8/0000 | Hurricane Watch extended | Belize City southward |
| 8/0300 | Hurricane Warning issued | east coast of Belize |
| 8/0300 | Tropical Storm Warning/Hurricane
Watch issued | Guatemala Caribbean coastline |
| 8/0900 | Hurricane Warning issued | Honduras from Limon westward
including adjacent islands and Guatemala Caribbean coastline |
| 8/0900 | Hurricane Warning discontinued | Cayman Islands |
| 8/1500 | Tropical Storm Warning | Felipe Carrillo Puerto southward,
Yucatan. |
| 8/2100 | Hurricane Watch discontinued | Mexico from Cabo Catoche
southward |
| 9/0900 | All Warnings discontinued | Mexico, Belize, Guatemala ahd
Honduras |
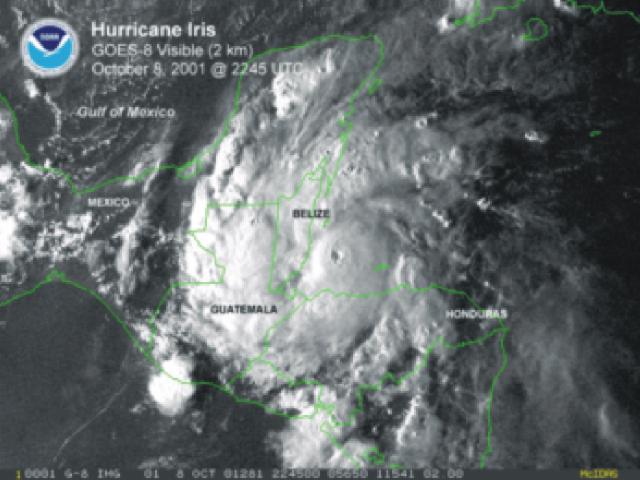
Figure 1:
Visible satellite imagery of Hurricane Iris near the time of peak
intensity.

Figure 2:
Best track positions for Hurricane Iris, 4-9
October, 2001.

Figure 3:
Best track maximum sustained surface wind speed curve for Hurricane Iris,
4-9 October 2001 and the observations on which the best track curve is
based. Aircraft observations have been adjusted for elevation using 90%,
80%, and 80% reduction factors for observations from 700 mb, 850 mb, and
1500 ft, respectively. Dropwindsonde observations include actual 10 m winds
(sfc), as well as surface estimates derived from the mean wind over the
lowest 150 m of the wind sounding (LLM), and from the sounding boundary
layer mean (MBL). Dashed line indicates the time of landfall.
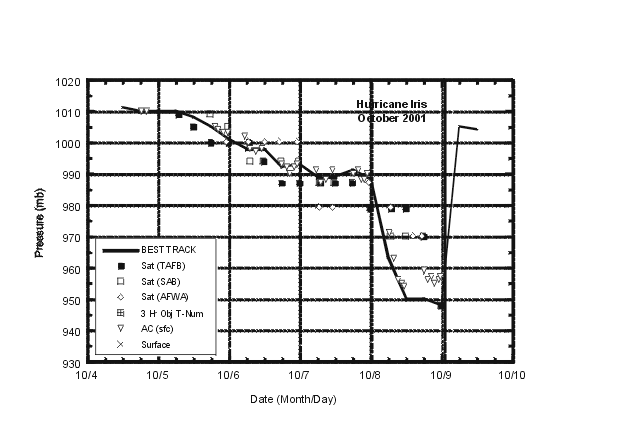
Figure 4:
Best track minimum central pressure curve
for Hurricane Iris, 4-9 October 2001, and the observations on which
the best track curve is based. Vertical dashed line indicates the
time of landfall.
|