Floyd was a large and intense Cape Verde hurricane that pounded the
central and northern Bahama islands, seriously threatened Florida, struck
the coast of North Carolina and moved up the United States east coast
into New England. It neared the threshold of category five intensity on
the Saffir/Simpson Hurricane Scale as it approached the Bahamas, and
produced a flood disaster of immense proportions in the eastern United
States, particularly in North Carolina.
a. Synoptic History
Floyd can be traced back to a tropical wave that emerged from western Africa
on 2 September. This system was not particularly impressive-looking, in
terms of the organization of the convection shown on satellite images, but
there was evidence of curvature in the cloud lines. Overall the system was
broad and disorganized, yet easily recognizable as a synoptic-scale entity.
The wave proceeded westward across the eastern tropical Atlantic at about
the normal speed of propagation, 6 degrees of longitude per day, with little
apparent change, for several days. A center of circulation was estimated
late on 5 September near 15N 32.5W but the cloud pattern lacked sufficient
deep convection for a Dvorak classification. On 6 September, there was
enough of a curved band of deep convection present so that the system was
classified as a T1.0 on the Dvorak scale around 1200 UTC. A favorable
upper-level outflow pattern existed over the area, and the cloud pattern
became more consolidated and better organized on the 7th. Tropical
Depression Eight formed about 1000 miles east of the Lesser Antilles by 1800
UTC that day.
A deep-layer ridge prevailed to the north of the cyclone and the associated
steering current moved the system west-northwestward at 12-15 knots for a
couple of days. When it reached a position about 750 n mi east of the
Leeward Islands, the cloud pattern became sufficiently well organized for
the system to become Tropical Storm Floyd around 0600 UTC 8 September. Even
though large-scale conditions appeared conducive for strengthening, there
was a lack of a well-defined inner core. This was evidenced by visible,
infrared, and microwave imagery that showed no tightly curved banding
features or a concentration of deep convection close to the center, a
condition that probably prevented rapid intensification during the early
stages of the tropical cyclone. Floyd slowly strengthened and became a
hurricane by 1200 UTC 10 September while centered about 200 n mi
east-northeast of the northern Leeward Islands.
As Floyd was nearing hurricane status, a mid-tropospheric trough in the
vicinity of 60-65W longitude caused a slowing of the forward speed, and then
a turn toward the northwest. The northwestward motion continued until the
11th, keeping the hurricane well to the northeast of the islands of the
northeastern Caribbean. On the 11th, Floyd neared the southwest portion of
the mid-Atlantic upper-tropospheric trough which was situated to the north
of Puerto Rico, i.e. close to its climatological position. Historically,
hurricanes have had difficulty strengthening in this area. Floyd's
upper-level outflow was disrupted over the southern semicircle by the trough
and an anticyclone over the eastern Caribbean. Consequently, after
strengthening nearly to category three status early on the 11th, the
hurricane weakened to 85 knots around 0000 UTC on the 12th. Early on the
12th, rising mid- to upper-tropospheric heights to the north of Floyd forced
a turn toward the west. The westward turn also marked the beginning of a
major strengthening episode (this phenomenon has also been observed with
many past hurricanes, e.g. Andrew of 1992). Maximum sustained winds
increased from 95 knots to 135 knots, and the central pressure fell about 40
mb from early on the 12th to early on the 13th. From 0600 to 1800 on the
13th, Floyd was at the top end of category four intensity on the
Saffir/Simpson Hurricane Scale.
One potential contributor to the significant strengthening of Floyd was the
presence of enhanced upper oceanic heat content along its track. Analyses
from the Physical Oceanography Division of NOAA/AOML showed relatively high
values of heat content just to the east of the Bahamas a day or two before
Floyd passed through the area.
Floyd was aimed at the central Bahamas until late on the 13th, when the
heading became west-northwestward. The eye passed just 20 to 30 n mi
northeast and north of San Salvador and Cat Islands on the night of the
13th. Floyd's eyewall passed over central and northern Eleuthera on the
morning of the 14th, and after turning toward the northwest, Floyd struck
Abaco island on the afternoon of the 14th. By the time the hurricane hit
Abaco, it had weakened somewhat from its peak, but Floyd was still a
borderline category three/four hurricane.
As a mid- to upper-tropospheric trough over the eastern United States eroded
the subtropical ridge over the extreme western Atlantic, Floyd continued to
turn gradually to the right. The center of the hurricane paralleled the
central Florida coast, passing about 95 n mi east of Cape Canaveral around
0900 UTC 15 September. By the afternoon of the 15th, Floyd was abeam of the
Florida/Georgia border and headed northward toward the Carolinas.
Although there was a fluctuation in intensity, related to an eyewall
replacement event discussed in the next section, overall the intensity of
Floyd diminished from the 13th to the 15th. Environmental causes for
intensity change are not entirely understood, but two large-scale factors
probably contributed to a gradual decline: the entrainment of drier air at
low levels from the northwest, and increasing south-southwesterly vertical
shear. As Floyd neared the North Carolina coast late on the 15th, its
maximum winds decreased below category three status.
After turning toward the north-northeast with forward speed increasing to
near 15 knots, Hurricane Floyd made landfall near Cape Fear, North Carolina
at 0630 UTC 16 September as a category two hurricane with estimated maximum
winds near 90 knots. Floyd was losing its eyewall structure as it made
landfall. Continuing to accelerate north-northeastward, Floyd's center
passed over extreme eastern North Carolina on the morning of the 16th and
over the greater Norfolk, Virginia area around 1500 UTC that day. Floyd
then weakened to a tropical storm and moved swiftly along the coasts of the
Delmarva peninsula and New Jersey on the afternoon and early evening of the
16th, reaching Long Island by 0000 UTC 17 September. By that time, the
storm's forward speed had increased to near 29 knots. The system
decelerated as it moved into New England.
By late on the 16th and early on the 17th, Floyd was becoming more involved
with a frontal zone that existed along the Atlantic seaboard. The system
took the form of a frontal low and thus became extratropical by the time it
reached the coast of Maine at 1200 UTC 17 September. The cyclone turned
toward the northeast and then east-northeast, moving over the coast of New
Brunswick late on the 17th, Prince Edward Island early on the 18th and
Newfoundland late on the 18th and early on the 19th. Floyd's extratropical
remnant merged with a large extratropical low over the north Atlantic and
was no longer a distinct entity by 1800 UTC 19 September.
b. Meteorological Statistics
Table 1 lists the best track positions and
intensities at six-hourly intervals.
Figure 1 is a display of this track.
Figure 2a, Figure 2b,
and Figure 3 depict the best track curves of maximum
one-minute average "surface" (10 meters above ground level) wind speed
and minimum central sea-level pressure, respectively, as a function of
time. Also plotted on Figure 2a and
Figure 3
are aircraft reconnaissance and dropsonde data from the
U.S. Air Force Reserves
(the Hurricane Hunters) and
NOAA,
estimates from analyses of surface synoptic data, as well as
Dvorak-technique estimates from the Tropical Analysis and Forecast
Branch, TAFB, the Satellite Analysis Branch, SAB, and the U.S. Air Force
Weather Agency (AFGWC in the figures) using satellite imagery.
Figure 2b
also shows the best track wind speed curve, but with only
in situ data,
i.e. flight level and dropsonde wind measurements. In both
Figure 2a and
Figure 2b
the flight level winds are adjusted for elevation (90% of 700 mb wind
speeds, 80% of 850 mb speeds, and 85% of 1500 ft speeds), and dropsonde wind
measurements above the surface are adjusted to the 10 meter level using a
mean hurricane eyewall profile determined by previous dropsonde measurements.
The peak intensity of Floyd, 135 knots, is based upon roughly 90% of the
highest flight level (700 mb) winds of 149 knots at 0933 UTC 13 September.
Minimum dropsonde-measured central pressure was 921 mb at 1121 UTC on that
date.
Floyd is estimated to have been a 90-knot hurricane at landfall in North
Carolina.
There was a 10 meter anemometer measurement of sustained winds of 83 knots
at 0710 UTC with gusts to 106 knots at 0716 UTC taken by University of
Oklahoma meteorology professor Josh Wurman near Topsail Beach North
Carolina. There were also unofficial reports of peak wind gusts to 120
knots (at 8 stories elevation) at Wrightsville Beach and 104 knots at the
Wilmington Emergency Operations Center.
Table 2 lists ship reports of tropical storm force
or greater wind speeds associated with Floyd. Table 3
lists a selection of surface observations from land stations and data
buoys. Floyd's eye passed over NOAA data buoy 41010, located about 105 n
mi east-northeast of Cape Canaveral, around 0900 UTC 15 September. That
buoy reported maximum 8-minute averaged winds of 72 knots at an
anemometer height of 5 meters. At least three factors would imply a
higher value for the 1-minute, 10 meter wind speed from the buoy
observation: 1) going from an 8-minute to a 1-minute average; 2) going
from 5 meters to 10 meters elevation; and 3) the presence of waves over
50 feet high. The best track intensity of Floyd when it passed over the
buoy is near 100 knots, as indicated by dropsonde and aircraft flight
level wind data. The center of the hurricane passed about 25 n mi west
of the Frying Pan Shoals C-MAN station located about 30 n mi southeast of
Cape Fear at 0500 UTC 16 September. This station reported winds sustained
at 86 knots for a 20-minute period centered at that time, at an
anemometer height of 44 meters.
On 13 September, just after Floyd reached maximum strength, there was
evidence of a concentric eyewall. Figure 4 is a
sequence of microwave images produced by the Naval Research Laboratory.
Note that in the first image, during the deepening phase, there was a
dominant inner eyewall with an eye diameter of 20 to 25 n mi. Later on,
after peak intensity was reached, there was some indication of a
concentric eyewall, particularly in the last image of this sequence. It
is interesting to note that after this period, there was an apparent
eyewall replacement, as suggested in the microwave image sequence shown
in Figure 5, and in radar imagery from NOAA/WP-3D
aircraft research missions (not shown). It can be seen that the inner
eyewall was dissipating while Floyd was centered near Eleuthera. This
corresponded to a weakening of the hurricane to near 105 knots. The
outer convective ring became the new eyewall by the time Floyd was
centered over Abaco, corresponding to an eye diameter near 50 n mi.
Afterwards, the new eye failed to contract significantly, while Floyd
re-strengthened just slightly as it reached Abaco. After the
disintegration of the inner eyewall the large-scale environment, as noted
in the previous section, became less favorable. Consequently, after
leaving the Bahamas, Floyd never regained its former intensity and, in
fact, slowly weakened.
Heavy rainfall preceded Floyd over the mid-Atlantic states due to a
pre-existing frontal zone and the associated overrunning. Hence, even
though the tropical cyclone was moving fairly quickly, precipitation amounts
were very large. Rainfall totals as high as 15 to 20 inches were recorded
in portions of eastern North Carolina and Virginia. At Wilmington, North
Carolina, the storm total of 19.06 inches included a 24-hour record of 15.06
inches. Totals of 12 to 14 inches were observed in Maryland, Delaware, and
New Jersey. New records were set in Philadelphia for the most amount of rain
in a calendar day, 6.63 inches. In southeastern New York, rainfall totals
were generally in the 4 to 7 inch range but there was a report of 13.70
inches at Brewster. Totals of nearly 11 inches were measured in portions of
New England.
Storm surge values as high as 9 to 10 feet were reported along the North
Carolina coast.
A number of tornadoes were sighted in eastern North Carolina. There was a
confirmed tornado in Bertie County and another in Perquimans County. The
latter tornado destroyed two houses and damaged three or four others. At
least ten tornadoes were reported by spotters in the Newport/Morehead City
County Warning area, and these apparently caused some structural damage.
Four tornadoes or funnel clouds were seen in the Wilmington area, but no
damage was apparent.
c. Casualty and Damage Statistics
There were 57 deaths that were directly attributable to Floyd, 56 in the
United States and 1 in Grand Bahama Island. The death toll by state is as
follows: North Carolina 35, Pennsylvania 6, New Jersey 6, Virginia 3,
Delaware 2, New York 2, Connecticut 1, and Vermont 1. Most of these deaths
were due to drowning in freshwater flooding. Floyd was the deadliest
hurricane in the United States since Agnes of 1972.
In the United States, the Property Claims Services Division of the Insurance
Services Office reports that insured losses due to Floyd totaled 1.325
billion dollars. Ordinarily this figure would be doubled to estimate the
total damage. However, in comparison to most hurricane landfalls, in the
case of Floyd there was an inordinately large amount of freshwater flood
damage, which probably alters the two to one damage ratio. Total damage
estimates range from 3 to over 6 billion dollars.
d. Forecast and Warning Critique
When averaged over the entire lifetime of the hurricane, the track forecasts
for Floyd were excellent. Table 4 shows the average
track errors for the official forecast and for a selection of objective
guidance models. It can be seen that the average official forecast
errors were substantially below the most recent ten-year averages. Also,
on average, the official forecasts were better than all of the guidance
except the UKMI model which had average track errors that were about
equal to those of the official forecasts.
Although the overall average official forecast errors for Floyd were
extremely low, the official forecasts were just ordinary if one considers
only the period when hurricane warnings were in effect for the United
States,. For example, the average 24-hour track forecast error for the
latter period was roughly the same as the most recent ten-year average.
Official track forecasts during the latter period also had a westward bias,
and were somewhat slow. For example, the 36-hour official track forecasts
during the period when hurricane warnings were in effect for the United
States were an average of 104 n mi too far west and 70 n mi too far south.
All of the track guidance models showed a similar westward and slow bias
during this period.
Official intensity forecasts were fairly good (errors of 10 knots or less)
for the first couple of days of Floyd's history. However, there were some
large underforecasts of intensity, by as much as 30 to 40 knots, from 10-12
September. After Floyd reached its maximum intensity, the official
forecasts did not show enough weakening. From 13 September onward, the wind
speed was overpredicted in the advisories at practically every forecast time
interval, by as much as 30 to 40 knots, and even 50 knots in one occasion.
The Statistical Hurricane Intensity Prediction Scheme, SHIPS, performed
similarly.
Table 5 is a chronology of the various watches and
warnings that were issued for Floyd. A hurricane warning was issued for
the northwest Bahamas more than 24 hours prior to the arrival of the
eyewall at Eleuthera. For the United States, practically the entire east
coast (the greater Miami area northward to Plymouth Massachusetts) was
put under a hurricane warning for Floyd. To the authors' knowledge, the
last time such an event occurred was during Hurricane Donna of 1960.
Hurricane warnings for the southeast Florida coast proved unnecessary.
However, given the forecast uncertainty and the required response times
for evacuations and other preparations for such a large, severe
hurricane, it was prudent to issue such warnings. The hurricane warning
was issued for the coast of North Carolina at 0300 UTC 15 September.
This is about 26-27 hours prior to the arrival of the eyewall in the Cape
Fear area. Generally, for the coasts of South and North Carolina,
hurricane warnings were issued at least 24 hours before the onset of
tropical storm force winds.
According to preliminary information provided to the Federal Emergency
Management agency, over 2 million people were evacuated for Floyd in the
United States. This is probably the largest evacuation in U.S. history.
Acknowledgements
Some of the data in this report was furnished by local National Weather
Service Offices in Miami, Melbourne, Jacksonville, Charleston, Wilmington,
Newport/Morehead City, Raleigh/Durham, Wakefield, Baltimore/Washington,
Mount Holly, New York, and Taunton. Stephen Baig produced the track chart,
and James Franklin produced the wind and pressure plots.
Figure 1. Best track for Hurricane Floyd, 7-17 September 1999.
Figure 2a.
Best track maximum sustained wind speed curve for Hurricane Floyd, showing
all available intensity estimates and wind observations. Aircraft wind
measurements have been adjusted for elevation (90% of 700 mb wind speeds,
80% of 850 mb speeds, and 85% of 1500 ft speeds), and dropsonde wind
measurements above the surface are adjusted to the 10 meter level using a
mean hurricane eyewall profile determined by previous dropsonde
measurements. Vertical line denotes landfall.

Figure 2b.
Best track maximum sustained wind speed curve for Hurricane Floyd, showing
only in situ wind observations adjusted for elevation as indicated in Figure
2a.
Figure 3.
Best track minimum central pressure curve and central pressure observations
or estimates for Hurricane Floyd. Vertical line denotes landfall.
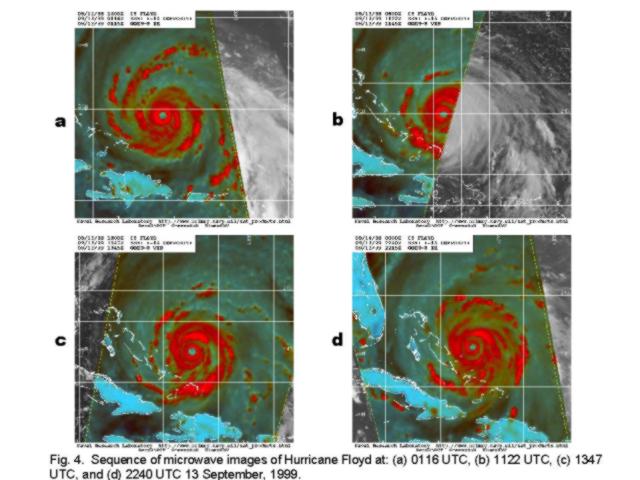
Figure 4.
Sequence of microwave images of Hurricane Floyd at: (a) 0116 UTC, (b) 1122
UTC, (c) 1347 UTC, and (d) 2240 UTC 13 September, 1999.
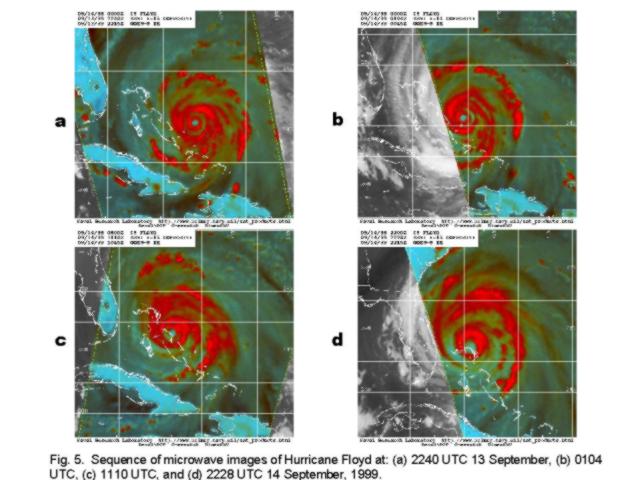
Figure 5.
Sequence of microwave images of Hurricane Floyd at: (a) 2240 UTC 13
September, (b) 0104 UTC, (c) 1110 UTC, and (d) 2228 UTC 14 September, 1999.
Table 1. Best track, Hurricane Floyd, 7 - 17 September, 1999
Date/Time
(UTC) | Position |
Pressure
(mb) |
Wind Speed
(kt) | Stage |
| Lat. (°N) | Lon. (°W) |
| 7/1800 | 14.6 | 45.6 | 1008 | 25 | tropical depression |
| 8/0000 | 15.0 | 46.9 | 1007 | 30 | " |
| 0600 | 15.3 | 48.2 | 1005 | 35 | tropical storm |
| 1200 | 15.8 | 49.6 | 1003 | 40 | " |
| 1800 | 16.3 | 51.1 | 1000 | 45 | " |
| 9/0000 | 16.7 | 52.6 | 1000 | 45 | " |
| 0600 | 17.1 | 53.9 | 1003 | 45 | " |
| 1200 | 17.3 | 55.1 | 1003 | 50 | " |
| 1800 | 17.9 | 56.3 | 996 | 60 | " |
| 10/0000 | 18.3 | 57.2 | 995 | 60 | " |
| 0600 | 18.6 | 58.2 | 990 | 60 | " |
| 1200 | 19.3 | 58.8 | 989 | 70 | hurricane |
| 1800 | 20.2 | 59.6 | 975 | 70 | " |
| 11/0000 | 20.8 | 60.4 | 971 | 80 | " |
| 0600 | 21.4 | 61.1 | 963 | 95 | " |
| 1200 | 21.9 | 62.0 | 962 | 95 | " |
| 1800 | 22.5 | 63.0 | 966 | 90 | " |
| 12/0000 | 22.7 | 64.1 | 967 | 85 | " |
| 0600 | 22.8 | 65.2 | 960 | 95 | " |
| 1200 | 23.0 | 66.2 | 955 | 105 | " |
| 1800 | 23.2 | 67.4 | 940 | 115 | " |
| 13/0000 | 23.4 | 68.7 | 931 | 125 | " |
| 0600 | 23.6 | 70.0 | 922 | 135 | " |
| 1200 | 23.9 | 71.4 | 921 | 135 | " |
| 1800 | 24.1 | 72.9 | 923 | 125 | " |
| 14/0000 | 24.5 | 74.0 | 924 | 115 | " |
| 0600 | 24.9 | 75.3 | 927 | 105 | " |
| 1200 | 25.4 | 76.3 | 930 | 105 | " |
| 1800 | 26.1 | 77.0 | 930 | 110 | " |
| 15/0000 | 27.1 | 77.7 | 933 | 115 | " |
| 0600 | 28.2 | 78.5 | 935 | 110 | " |
| 1200 | 29.3 | 78.9 | 943 | 100 | " |
| 1800 | 30.6 | 79.1 | 947 | 95 | " |
| 16/0000 | 32.1 | 78.7 | 950 | 90 | " |
| 0600 | 33.7 | 78.0 | 956 | 90 | " |
| 1200 | 35.7 | 76.8 | 967 | 70 | " |
| 1800 | 38.0 | 75.3 | 974 | 60 | tropical storm |
| 17/0000 | 40.6 | 73.5 | 980 | 50 | " |
| 17/0600 | 42.1 | 72.1 | 983 | 50 | tropical storm |
| 1200 | 43.3 | 70.6 | 984 | 45 | extratropical |
| 1800 | 44.2 | 68.9 | 985 | 45 | " |
| 18/0000 | 44.8 | 67.3 | 987 | 40 | " |
| 0600 | 45.4 | 65.5 | 990 | 35 | " |
| 1200 | 46.6 | 63.0 | 992 | 35 | " |
| 1800 | 47.7 | 59.3 | 992 | 35 | " |
| 19/0000 | 48.0 | 56.3 | 992 | 35 | " |
| 0600 | 48.5 | 52.5 | 994 | 35 | " |
| 1200 | 49.5 | 48.0 | 992 | 40 | " |
| 1800 | | | | | merged with low |
| |
| 13/1200 | 23.9 | 71.4 | 921 | 135 | minimum pressure |
| | Landfalls |
| 14/1200 | 25.4 | 76.3 | 930 | 105 | Near Alice Town,
Eleuthera |
| 14/1900 | 26.3 | 77.1 | 932 | 120 | Near Cherokee Sound,
Abaco |
| 16/0630 | 33.8 | 78.0 | 956 | 90 | Near Cape Fear,
North Carolina |
Table 2. Ship reports of 34 knots or higher wind speed associated with Hurricane Floyd, September 1999.
Date/Time
(UTC) |
Ship call sign |
Lat. (°N) |
Lon. (°W) |
Wind
dir/speed
(deg/kt) |
Pressure
(mb) |
| 08/1500 | PDYI | 19.0 | 52.6 | 070/39 | 1011.1 |
| 09/0900 | DFSO | 17.2 | 53.7 | 180/37 | 1004.2 |
| 09/1200 | DFSO | 16.9 | 54.5 | 210/37 | 1005.2 |
| 09/1500 | DFSO | 16.6 | 55.4 | 180/45 | 1005.5 |
| 12/1500 | DGOO | 22.7 | 69.3 | 320/35 | 1001.5 |
| 12/1800 | DGOO | 23.5 | 69.5 | 340/37 | 998.5 |
| 12/1800 | ZCAH3 | 24.9 | 63.1 | 130/58 | 1009.3 |
| 12/2100 | DGOO | 24.1 | 69.8 | 030/43 | 994.8 |
| 13/0000 | DGOO | 24.5 | 69.9 | 040/45 | 994.8 |
| 13/0300 | DGOO | 24.9 | 70.3 | 040/52 | 997.0 |
| 13/0600 | DGOO | 25.6 | 70.5 | 040/52 | 998.5 |
| 13/0900 | DGOO | 26.3 | 70.8 | 060/52 | 999.5 |
| 13/1200 | DILD | 24.9 | 53.1 | 170/37 | 1013.9 |
| 13/1200 | DGOO | 27.0 | 71.0 | 090/52 | 1002.9 |
| 13/1800 | KHRH | 19.5 | 74.7 | 360/50 | 994.0 |
| 13/1800 | WZJF | 21.3 | 66.9 | 135/35 | 1009.5 |
| 14/0000 | PPXI | 30.6 | 74.3 | 070/50 | 1001.0 |
| 14/0900 | WGJT | 22.0 | 73.5 | 180/35 | 998.2 |
| 14/1200 | PPXI | 30.4 | 71.0 | 110/45 | 1001.0 |
| 14/1500 | PEXU | 26.7 | 70.6 | 120/37 | 1009.2 |
| 15/0300 | SHIP | 30.3 | 74.3 | 100/45 | 1006.5 |
| 15/0900 | DGOS | 29.3 | 73.8 | 130/38 | 1004.0 |
| 15/1200 | DGOS | 28.9 | 73.8 | 130/47 | 1003.5 |
| 15/1200 | PFKV | 30.6 | 74.0 | 120/38 | 1004.4 |
| 15/1800 | PFKV | 30.3 | 74.0 | 130/36 | 1003.6 |
| 16/0000 | WRGQ | 31.5 | 75.4 | 160/46 | (898.1) |
| 16/0300 | PEXU | 29.4 | 73.9 | 190/36 | 1008.5 |
| 16/0600 | WRGQ | 31.2 | 75.2 | 200/41 | 1001.0 |
| 16/0600 | SHIP | 36.8 | 73.0 | 140/36 | 1006.8 |
| 16/1200 | WZJE | 32.0 | 71.6 | 180/38 | 1008.5 |
| 16/1200 | 3ELL6 | 32.0 | 72.5 | 200/36 | 1007.2 |
| 16/1800 | BKJO | 34.7 | 72.2 | 190/60 | 1005.0 |
| 16/1800 | WZJE | 32.1 | 72.3 | 210/52 | 1009.6 |
| 16/2100 | DEDI | 40.4 | 70.9 | 130/42 | 998.0 |
| 16/2100 | SHIP | 36.6 | 69.5 | 180/47 | 1007.0 |
| 17/0000 | DEDI | 40.4 | 70.8 | 140/50 | 993.3 |
| 17/0000 | SHIP | 36.6 | 68.4 | 190/40 | 1009.5 |
| 17/0000 | WAUU | 36.0 | 68.5 | 190/46 | 1009.7 |
Table 3. Hurricane Floyd, selected surface observations, September 1999.
| |
Minimum
sea-level
pressure |
Maximum surface wind speed
(kt) |
|
| Location |
Press.
(mb) |
Date/
time
(UTC) |
Sust.
winda
(kts) |
Peak
gust (kts) |
Date/
timeb
(UTC) |
Storm
surgec
(ft) |
Storm
tided
(ft) |
Rain
(storm total)
(in) |
| Bahamas | |
| Grand Bahama Island | 983.0 | 15/0100 | 52 | 65 | 14/2000 | | 5.27 | |
| Little Harbor Abacos | 929.0 | 14/1910 | | | | | | 9.32 |
| Nassau | | | 55 | 68 | | | | |
| Florida | |
| Craig Field | 994.6 | 15/1653 | 37 | | 15/1929 | | | |
| Daytona Beach | 991.8 | 15/1353 | 36 | 60 | 15/1053 | | | 1.23 |
| Fowey Rocks Lighthouse | 995.5 | 14/2300 | 36 | 44 | 14/1600 | | | |
| Ft. Lauderdale Exec | 994.9 | 14/2253 | 23 | 33 | 15/0653 | | | 0.01 |
| Ft. Lauderdale Int'l | 994.6 | 14/2253 | 25 | 36 | 14/2201 | | | 0.10 |
| Ft. Pierce | 989.5 | 15/0735 | 29 | 43 | 15/0736 | | | |
| Gainesville | 994.6 | 15/1653 | 33 | | 15/1407 | | | |
| Jacksonville Int'l | 995.3 | 15/1656 | 40 | | 15/0907 | | | |
| Lake Worth Pier | 993.4 | 14/2200 | 32 | 49 | 14/1700 | | | |
| Leesburg | 996.4 | 15/1053 | 20 | 27 | 15/1153 | | | |
| Melbourne Airport | 989.1 | 15/0900 | 45 | 59 | 15/0501 | | | 1.35 |
| Melbourne WFO | | | 32 | 52 | 15/0655 | | | |
| Miami | 995.8 | 14/2256 | 19 | 29 | 15/0322 | | | 0.04 |
| Ocala | 998.0 | 15/1035 | 28 | | 15/1535 | | | |
| Orlando | 993.8 | 15/0853 | 24 | 42 | 15/0853 | | | 1.26 |
| Patrick AFB (COF) | | | 49 | 57 | 15/0820 | | | |
| Sanford | | | 25 | 37 | 14/2024 | | | 3.20 |
| Tamiami Airport | 996.4 | 14/2253 | 21 | 31 | 14/1953 | | | |
| West Palm Beach | 992.9 | 15/0453 | 27 | 38 | 14/1941 | | | 0.38 |
| Georgia | |
| Alma | 999.7 | 15/`950 | 28 | | 15/1746 | | | |
| Brooklet | | | | | | | | 0.41 |
| Dover | | | | | | | | 0.40 |
| Ludowici | | | | | | | | 0.52 |
| Newington | | | | | | | | 0.85 |
| Rocky Ford | | | | | | | | 0.20 |
| Savannah Airport | | | 35 | 46 | 15/1810 | | | |
| St. Simon's Island | 993.2 | 15/1804 | 40 | | 15/1804 | | | |
| South Carolina | |
| Allendale | | | | | | | | 0.67 |
| Beaufort | | | | | | | | 1.83 |
| Charleston City Office | | | 50 | 74 | 16/0150 | | | 3.99 |
| Charleston Harbor | | | | | | | 10.1 | |
| Charleston Int'l Airport | 989.5 | 15/0052 | 44 | 58 | 16/0046 | | | 3.91 |
| Edisto Beach State Park | | | 33 | 47 | 16/0029 | | | |
| Florence Airport | 991.2 | 16/0655 | 36 | 54 | 16/0158 | | | 4.04 |
| Folly Beach | | | 47 | 62 | 15/2300 | | | |
| Grand Strand | 977.0 | 16/0553 | | 57 | 16/0523 | | | |
| Ladson Oakbrook | | | | | | | | 4.30 |
| Myrtle Beach Airport | 979.7 | 16/0553 | | 62 | 16/0455 | | | 16.06 |
| Myrtle Beach Springmaid Pier | | | | 68 | 16/0500 | | | |
| Ridgeville | | | | | | | | 3.58 |
| St. George | | | | | | | | 1.90 |
| Walterboro | | | | | | | | 2.50 |
| Williams | | | | | | | | 2.42 |
| North Carolina | |
| Beaufort | 976.0 | 16/0409 | 42 | 58 | 16/0405 | | | 5.56 |
| Castle Hayne 2E | | | | 81 | 16/0715 | | | |
| Castle Hayne 3SW | | | | 104 | 16/0845 | | | |
| Cherry Point MCAS | 961.4 | 16/0555 | 56 | 71 | 16/0405 | | | 3.27 |
| Elizabeth City | 968.5 | 16/1418 | 34 | 56 | 16/1346 | | | 2.65 |
| Federal Point | | | | 97 | 16/0620 | | | |
| Flemington | | | | 80 | 16/0625 | | | |
| Frisco | 983.8 | 16/0740 | 51 | 61 | 16/0805 | | | 0.34 |
| Greenville | | | | 51 | 16/0800 | | | |
| Holden Beach | | | 42 | 64 | 16/0820 | | | |
| Manteo | | | | 53 | 16/1000 | | | |
| Masonboro Island | | | | | | | 10.3 | |
| Mt. Olive | | | | 65 | 16/0520 | | | |
| Myrtle Grove | | | | 89 | 16/0540 | | | |
| Newport | | | | 58 | 16/0454 | | | |
| New Bern | 961.1 | 16/0543 | 39 | 58 | 16/0501 | | | 4.29 |
| New River | 959.0 | 16/0426 | 44 | 68 | 16/0556 | | | 8.26 |
| Oak Island | | | 52 | 69 | 16/0820 | | 10.0 | |
| Pleasure Island | | | | | | | 10.0 | |
| Rocky Mount/Wilson Airport | | | | | | | | 15.15 |
| Seymour Johnson AFB | 983.0 | 16/0955 | 45 | 60 | 16/1055 | | | |
| South River | | | | | | | | 3.50* |
| Washington | | | | 41 | 16/0800 | | | |
| Wilmington Airport | 959.7 | 16/0755 | 54 | 75 | 16/0855 | | | 19.06 |
| Wilmington Corning Plant | | | | 89 | 16/0700 | | | |
| Wilmington EOC | | | | 104 | 16/0845 | | | |
| Wrightsville Beach | | | | 120 | | | | |
| Virginia | |
| Fort Eustis | 985.2 | 16/1455 | 25 | 37 | 16/1640 | | | |
| Glouchester | | | | | | | | 11.25 |
| Hampton | | | | | | | | 7.50 |
| James City County | | | | | | | | 14.30 |
| Langley AFB | | | 40 | 55 | 16/1355 | | | |
| Lower James City | | | | | | | | 12.83 |
| Newport News | 983.4 | 16/1558 | 33 | 44 | 16/1623 | | | 16.57 |
| Norfolk Airport | 977.1 | 16/1551 | 27 | 40 | 16/1303 | | | |
| Norfolk NAS | 979.1 | 16/1555 | 38 | 48 | 16/1609 | | | |
| Oceana NAS | 975.7 | 16/1556 | 35 | | 16/1656 | | | |
| Portsmouth | 978.3 | 16/1600 | 30 | 52 | 16/1614 | | | 10.10 |
| Richmond | 991.9 | 16/1640 | 29 | 44 | 16/1405 | | | 6.54 |
| Smithfield | | | | | | | | 12.50 |
| Wakefield WFO | | | | | | | | 12.73 |
| Weems | | | | | | | | 10.83 |
| Yorktown | | | | | | | | |
| Maryland | |
| Annapolis | | | | | | | | 11.60 |
| Cambridge | | | | | | | 2.5 | |
| Chestertown | | | | | | | | 14.00 |
| Lewisetta | | | | | | | 3.5 | |
| Martin State Airport | 989.0 | | | | | | | |
| Mid-Bay Buoy | | | | 60 | 16/1710 | | | |
| Ocean City | 976.8 | 16/1853 | 31 | 45 | 16/1653 | | | 1.71 |
| Patuxent NAS | 991.0 | | 30 | 36 | 16/1555 | | | |
| Salisbury | 980.4 | 16/1851 | 28 | 42 | 16/2150 | | | 5.08 |
| Solomon's Island | | | | | | | 3.0 | |
| St. Inigoes | 987.6 | | | | | | | |
| Tall Timbers | | | | 62 | 16/2040 | | | 11.10 |
| Thomas Point Light | | | 43 | 49 | 16/1300 | | | |
| Delaware | |
| Cape Henlopen | | | | 56 | 16/PM | | | |
| Greenwood | | | | | | | | 10.58 |
| Lewes | | | | | | 2.6 | 6.76 | |
| Vernon | | | | | | | | 12.36 |
| Wilmington | 986.0 | 16/2106 | 32 | 40 | 16/2214 | | | |
| New Jersey | |
| American Corners | | | | | | | | 10.20 |
| Atlantic City | 980.2 | 16/2054 | 23 | 34 | 16/2345 | 2.0 | 6.22 | |
| Caldwell/Essex Co. Airport | 987.8 | 16/2353 | | 38 | 16/2353 | | | 10.21 |
| Cape May | | | | | | 2.6 | 7.36 | |
| Doylestown | | | | | | | | 10.07 |
| Federalsburg | | | | | | | | 11.20 |
| Neshanic | | | | | | | | 10.07 |
| Newark Int'l Airport | 985.1 | 16/2351 | 38 | 46 | 16/2351 | | | 6.22 |
| Pequannock | | | | | | | | 11.04 |
| Sandy Hook | 981.0 | 16/2306 | 34 | 45 | 17/0024 | 1.9 | 6.57 | |
| Somerville | | | | | | | | 13.34 |
| Teterboro Airport | 985.0 | 16/2351 | 24 | 38 | 16/2351 | | | 8.53 |
| Wayne/Iflows | | | | | | | | 12.21 |
| White House | | | | | | | | 12.98 |
| Pennsylvania | |
| Philadelphia | 985.0 | 16/2136 | 32 | 42 | 16/2136 | 2.8 | 9.34 | |
| New York | |
| Central Park | 983.8 | 16/2250 | 25 | 36 | 16/1450 | | | 5.02 |
| Farmingdale Airport | 981.6 | 16/2353 | 23 | 37 | 16/2053 | | | 3.13 |
| HPN Airport | 985.8 | 17/0050 | 25 | 42 | 16/2350 | | | 6.26 |
| Islip/MacArthur Airport | 983.4 | 17/0156 | 27 | 37 | 16/2356 | | | |
| JFK Int'l Airport | 982.5 | 16/2351 | 30 | 41 | 17/0051 | | | 3.27 |
| LaGuardia Airport | 983.7 | 16/2351 | 30 | 41 | 17/0051 | | | 4.94 |
| MGJ Airport | | | 29 | 44 | 16/2039 | | | |
| MTP Airport | 986.9 | 17/0254 | 22 | 37 | 17/0454 | | | |
| Newburgh/Stewart Airport | 992.6 | 17/0045 | 34 | 54 | 16/2245 | | | |
| NWS Upton | | | | | | | | 3.50 |
| Westhampton Airport | 984.8 | 17/0153 | 28 | 43 | 17/0153 | | | |
| White Plains Airport | 985.8 | 17/0050 | 25 | 42 | 16/2350 | | | |
| Massachusetts | |
| Beverly | | | | 31 | | | | |
| Blue Hill Observatory-Milton | | | | 40 | | | | |
| Boston | | | | | | | 10.7 | |
| Boston/Logan Airport | | | | 38 | | | | |
| Brewster | | | | 63 | 17/0545 | | | |
| Buzzards Bay | | | 47 | 57 | 17/0300 | | | |
| Fox Point Hurricane Barrier | | | | | | 4.2 | | |
| Hadley | | | | | | | | 9.60 |
| Hyannis | | | | 62 | | | | |
| Lawrence | | | | 32 | | | | |
| Martha's Vineyard | | | | 34 | | | | |
| Nantucket | | | | 32 | | | 1.3 | |
| New Bedford Hurr. Barrier | | | | 64 | 17/0600 | 2.5 | | |
| Norwood | | | | 27 | | | | |
| Orange | | | | 29 | | | | |
| Plymouth | | | | 33 | | | | |
| Southwick | | | | | | | | 9.16 |
| Taunton | | | | 38 | | | | |
| Westfield | | | | 37 | | | | |
| Worcester | | | | 30 | | | | |
| Rhode Island | |
| Block Island | | | | 39 | | | | |
| Newport | | | | 35 | | | 2.6 | |
| Providence | | | | 35 | | | 5.9 | |
| Westerly | | | | 31 | | | | |
| Connecticut | |
| Bridgeport Airport | 981.8 | 17/0154 | 29 | 39 | 16/2254 | | | |
| Bristol | | | | | | | | 10.80 |
| Burlington | | | | | | | | 9.45 |
| Danbury Airport | 987.1 | 17/0153 | 15 | 21 | 17/0153 | | | |
| Groton/New London Airport | 986.8 | 17/0145 | 30 | 43 | 17/0045 | | | |
| Hartford Airport | 985.4 | 17/0253 | | | | | | |
| Meriden | 984.5 | 17/0156 | | | | | | |
| MMK Airport | 986.4 | 17/0155 | 20 | 34 | 17/0155 | | | |
| New Haven Airport | 983.8 | 17/0145 | 33 | | | | | |
| Southington | | | | | | | | 9.14 |
| Willimantic | 985.8 | 17/0352 | | 31 | | | | |
| Windsor Locks | | | | 37 | | | | |
| New Hampshire | |
| Manchester | | | | 28 | | | | |
| NOAA National Data Buoy Center buoys |
| 41004 (30.5N 79.1W) | | | 54 | 72 | 16/0200 | | | |
| 41009 (28.5N 80.2W) | 980.9 | 15/0900 | 52 | 70 | 15/1000 | | | |
| 41008 (31.4N 80.9W) | | | 24 | 31 | 15/2100 | | | |
| 41010 (28.9N 78.5W) | 939.6 | 15/0900 | 72 | 91 | 15/0700 | | | |
| 44009 (38.5N 74.7W) | 976.0 | 16/1900 | 39 | 52 | 16/1800 | | | |
| 44014 (36.8N 74.8W) | 981.4 | 16/1600 | 50 | 66 | 16/1615 | | | |
| 44025 (40.3N 73.2W) | 980.0 | 17/0000 | 33 | 43 | 17/0600 | | | |
| NOAA National Data Buoy Center C-MAN stations |
| BUZM3 (41.4N 71.0W) | | | 47 | 57 | 17/0300 | | | |
| CLKN7 (34.6N 76.5W) | 974.9 | 16/0500 | 63 | 79 | 16/0450 | | | |
| DSLN7 (31.2N 75.3W) | 985.8 | 16/0730 | 69 | 82 | 16/0750 | | | |
| DUCN7 (36.2N 75.8W) | 977.0 | 16/0900 | 67 | 83 | 16/0850 | | | |
| FPSN7 (33.5N 77.6W) | 958.7 | 16/0600 | 86 | 97 | 16/0512 | | | |
| SAUF1 (29.9N 81.3W) | 992.9 | 15/1200 | 58 | | 15/1200 | | | |
aASOS and C-MAN are 2 min; buoys are 8 min.
bDate/time is for sustained wind when both sustained and gust are listed.
cStorm surge is water height above normal astronomical tide level.
dStorm tide is water height above National Geodetic Vertical Datum (1929 mean sea level).
Table 4.
Preliminary forecast evaluation of Hurricane Floyd, heterogeneous sample.
(Errors in nautical miles for tropical storm and hurricane stages with
number of forecasts in parenthesis).
| Forecast Technique |
Period (hours) |
| 12 | 24 | 36 | 48 | 72 |
| CLIP | 40 (35) | 88 (33) | 148 (31) | 206 (29) | 312 (25) |
| GFDI | 36 (34) | 71 (32) | 97 (30) | 115 (28) | 153 (25) |
| GFDL* | 31 (30) | 66 (30) | 96 (28) | 109 (26) | 155 (24) |
| LBAR | 30 (34) | 59 (32) | 92 (30) | 112 (28) | 120 (24) |
| AVNI | 38 (35) | 77 (33) | 119 (31) | 141 (29) | 187 (25) |
| BAMD | 37 (34) | 70 (32) | 106 (30) | 147 (28) | 239 (24) |
| BAMM | 50 (34) | 96 (32) | 137 (30) | 175 (28) | 243 (24) |
| BAMS | 63 (34) | 123 (32) | 173 (30) | 207 (28) | 263 (24) |
| A98E | 35 (33) | 72 (31) | 113 (29) | 120 (27) | 174 (24) |
| NGPI | 39 (29) | 69 (27) | 101 (25) | 123 (23) | 146 (19) |
| UKMI | 29 (32) | 54 (30) | 66 (26) | 76 (24) | 97 (21) |
| |
| NHC OFFICIAL | 28 (35) | 53 (33) | 73 (31) | 73 (29) | 104 (25) |
| NHC OFFICIAL 1989-1998 10-year average | 48 (2005) | 89 (1790) | 128 (1595) | 164 (1410) | 242 (1107) |
* GFDL output not available until after forecast issuance.
Table 5. Watch and warning summary, Hurricane Floyd, September 1999
Date/Time
(UTC) |
Action |
Location |
| 09/2100 | Tropical storm watch issued | Antigua, Barbuda, Anguilla, and Dutch Saint Maarten |
| 09/2200 | Tropical storm watch issued | French Saint Martin and Saint Barthelemy |
| 11/0300 | Tropical storm watch discontinued | Antigua, Barbuda, Anguilla and Dutch Saint Maarten |
| 11/0300 | Tropical storm watch discontinued | French Saint Martin and Saint Barthelemy |
| 12/0900 | Tropical Storm warning and hurricane watch issued | Turks, Caicos, and Southeast Bahamas |
| 12/0900 | Hurricane watch issued | Central Bahamas |
| 13/0000 | Hurricane warning issued | Central Bahamas |
| 13/0000 | Hurricane watch issued | Northwest Bahamas |
| 13/0900 | Hurricane watch upgraded to hurricane warning | Northwest Bahamas |
| 13/0900 | Hurricane watch issued | Florida: South of Flagler Beach to Hallandale |
| 13/1500 | Hurricane watch extended | South to include Miami-Dade County and north of Flagler Beach, Florida to Brunswick, Georgia |
| 13/1800 | Hurricane watch extended | Including Lake Okeechobee |
| 13/2100 | Hurricane watch upgraded to hurricane warning | Florida City, Florida to south of Brunswick, Georgia |
| 13/2100 | Tropical storm warning issued | Florida Keys, north of Seven Mile Bridge |
| 13/2100 | Hurricane watch issued | Georgia: Brunswick to Savannah |
| 14/0300 | Hurricane watch extended | North of Savannah, Georgia to Little River Inlet, South Carolina |
| 14/0900 | Tropical storm warning discontinued | Turks and Caicos Islands |
| 14/1500 | Tropical storm warning discontinued | Southeast Bahamas |
| 14/2100 | Tropical storm warning discontinued | Florida Keys, from the Seven Mile Bridge northward |
| 14/2100 | Hurricane warning extended | Georgia and South Carolina coasts to Little River Inlet, South Carolina |
| 14/2100 | Hurricane warning downgraded to tropical storm warning | Florida: Florida City to Boca Raton |
| 14/2100 | Hurricane watch extended | North of Little River Inlet, South Carolina to Cape Charles Light, Virginia, south of New Point Comfort, including Pamlico and Albermarle sounds |
| 15/0300 | Hurricane warning extended | North of Little River Inlet, South Carolina to the North Carolina/Virginia border |
| 15/0300 | Hurricane warning discontinued | Florida: Boca Raton to Ft. Pierce |
| 15/0300 | Hurricane watch extended | North Carolina/Virginia border to Chincoteague, Virginia, including Chesapeake Bay, south of Smith Point |
| 15/0300 | Hurricane warning discontinued | Central Bahamas |
| 15/0300 | Tropical storm warning discontinued | Florida: Florida City to Ft. Pierce |
| 15/0600 | Hurricane warning discontinued | Northwest Bahamas: New Providence, Bimini, Andros, and Berry Islands |
| 15/0900 | Tropical storm watch issued | Chincoteague, Virginia to Cape Henlopen, Delaware, including Chesapeake Bay north of Smith Point and the Potomac from Cobb Island to Smith Point |
| 15/1200 | Hurricane warning discontinued | Florida: South of Sebastian Inlet to Ft. Pierce
Northwest Bahamas: Grand Bahama and Abaco Islands |
| 15/1500 | Hurricane warning discontinued | Florida: Sebastian Inlet to Titusville |
| 15/1500 | Tropical storm watch extended | North of Chincoteague, Virginia to Sandy Hook, New Jersey, including Delaware Bay |
| 15/1700 | Tropical storm watch extended | North of Sandy Hook, New Jersey to Montauk Point on Long Island, New York, including Delaware Bay |
| 15/1900 | Hurricane warning discontinued | Florida: Titusville to Fernandina Beach |
| 15/2100 | Hurricane warning extended | North of North Carolina/Virginia border to Chincoteague, Virginia, including Chesapeake Bay, south of Smith Point |
| 15/2100 | Tropical storm watch upgraded to tropical storm warning | North of Chincoteague, Virginia to Sandy Hook, New Jersey, including northern Chesapeake Bay, the Potomac Basin, and Delaware Bay |
| 15/2100 | Tropical storm watch extended | North of Sandy Hook, New Jersey to the Merrimack River, Massachusetts, including Long Island Sound |
| 16/0300 | Hurricane warning discontinued | North of Fernandina Beach, Florida to Edisto Beach, South Carolina |
| 16/0300 | Hurricane warning extended | North of Chincoteague, Virginia to Cape Henlopen, Delaware |
| 16/0300 | Tropical storm warning extended | North of Sandy Hook, New Jersey to Plymouth, Massachusetts |
| 16/0900 | Hurricane warning extended | North of Cape Henlopen, Delaware to Manasquan Inlet, New Jersey and from Moriches Inlet, New York to Plymouth, Massachusetts |
| 16/0900 | Tropical storm warning extended | North of Plymouth, Massachusetts to Merrimack River, Massachusetts |
| 16/1100 | Hurricane warning discontinued | From South Santee River, South Carolina, southward |
| 16/1300 | Hurricane warning discontinued | South Santee River, South Carolina to Surf City, North Carolina |
| 16/1500 | Hurricane warning discontinued | North Carolina: North of Surf City to Cape Hatteras |
| 16/1800 | Hurricane warning discontinued | Cape Hatteras, North Carolina to Cape Charles Light, Virginia, including southern Chesapeake Bay |
| 16/2100 | Hurricane warning downgraded to tropical storm warning | Cape Charles Light, Virginia to the Merrimack River, Massachusetts, including Chesapeake Bay, the Potomac Basin, Delaware Bay, and Long Island Sound |
| 17/0300 | Tropical storm warning discontinued | Cape Charles Light, Virginia to Sandy Hook, New Jersey, including Chesapeake Bay, the Potomac Basin, and Delaware Bay |
| 17/0900 | Tropical storm warning discontinued | Sandy Hook, New Jersey to the Merrimack River, Massachusetts, including Long Island Sound |
![[NCEP Logo]](graphics/ncep.gif)