 NCDC / Climate Research / Climate of 1999 / September / Climate-Watch / Search / Help NCDC / Climate Research / Climate of 1999 / September / Climate-Watch / Search / Help

|


| Floyd brought flooding rains, high winds and rough seas along a good portion of the Atlantic seaboard from the 14th through the 18th of September. The greatest damages were along the eastern Carolinas northeast into New Jersey, and adjacent areas northeastward along the east coast into Maine. Several states had numerous counties declared disaster areas. Flooding caused major problems across the region, and at least 77 deaths have been reported. Damages are estimated to be $1.6 billion in Pitt County, North Carolina alone, and total storm damages may surpass the $6 billion caused by Hurricane Fran in 1996.
|
 |
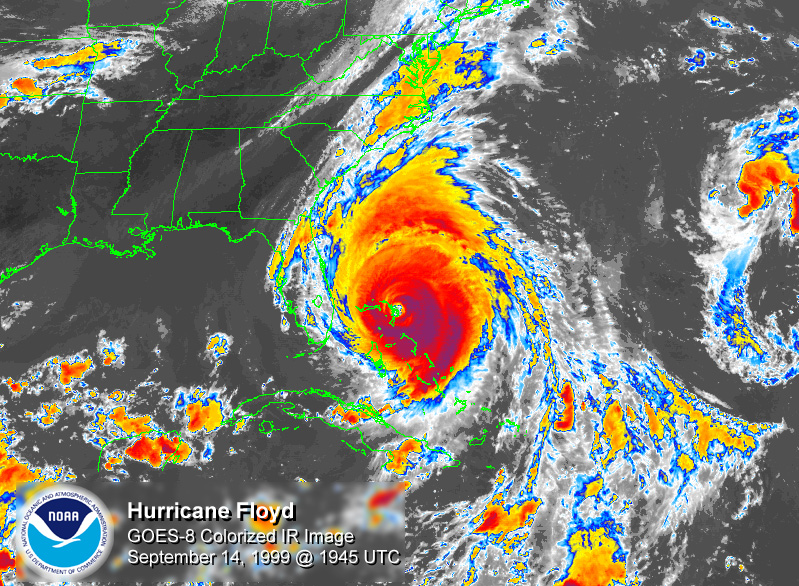
Although Hurricane Floyd reached category 4 intensity in the Bahamas, it weakened to category 2 intensity at landfall in North Carolina. Floyd's large size was a greater problem than its winds, as the heavy rainfall covered a larger area and lasted longer than with a typical category 2 hurricane. Approximately 2.6 million people evacuated their homes in Florida, Georgia, and the Carolinas--the largest peacetime evacuation in US history. Ten states were declared major disaster areas as a result of Floyd, including Connecticut, Delaware, Florida, Maryland, New Jersey, New York, North Carolina, Pennsylvania, South Carolina and Virginia. There were several reports from the Bahamas area northward of wave heights exceeding 50 feet. The maximum storm surge was estimated to be 10.3 feet on Masonborough Island in New Hanover County, NC.
A brief summary of the impacts:
North Carolina: 51 deaths; 7000 homes destroyed; 17,000 homes uninhabitable; 56,000 homes damaged; most roads east of I-95 flooded; Tar River crests 24 feet above flood stage; over 1500 people rescued from flooded areas; over 500,000 customers without electricity at some point; 10,000 people housed in temporary shelters; much of Duplin and Greene Counties under water; severe agricultural damage throughout eastern NC; "Nothing since the Civil War has been as destructive to families here," says H. David Bruton, the state's Secretary of Health and Human Services...."The recovery process will be much longer than the water-going-down process"; Wilmington reports new 24-hour station rainfall record (128 year record) with 13.38 inches and over 19 inches for the event.
South Carolina: 1 death; over 1000 homes flooded; Myrtle Beach reports 24-hour rainfall of 14.00 inches.
Virginia: 4 deaths; over 280,000 customers without electricity at some point; 9-12 feet of water in downtown Franklin; 5000 homes damaged.
Maryland: 1 death; over 250,000 customers without electricity at some point.
Pennsylvania: 8 deaths; over 410,000 customers without electricity at some point; over 4000 homeless; 2000 homes and businesses damaged.
New Jersey: 4 deaths; over 650,000 customers without electricity at some point.
New York: 2 deaths; over 80,000 customers without electricity at some point.
Delaware: 2 deaths; over 200,000 customers without electricity at some point.
The following states have reported one death each: Rhode Island, Connecticut, Massachusetts and Vermont.
The Bahamas also reported 1 death with severe damage on Abaco, Cat, San Salvador, and Eleuthera Islands.
Aid and Recovery:
Congress approved $2.2 billion in aid during 1999, and the NC state legislature approved $836 million during 1999. In addition, FEMA has thus far spent $1.05 billion for aid, and the U.S. Small Business Administration has spent $459 million. Thus far in 2000, $347 million in supplemental requests have been submitted.
Data, Tables, and Maps
Hurricane Floyd Wind Gust Reports
Hurricane Floyd Preliminary Rainfall Amounts (those > 5 inches)..... Table.... Map #1.... Map #2.... Map #3
Raleigh NEXRAD Image storm total precipitation from 09/14/99 at 1430Z through 09/16/99 at 1938Z.
Storm Summary Rainfall Map and Data Table for the 33 days ending at 8AM on Sep 30, 1999. Most rainfall during this period was due to Hurricanes Dennis and Floyd and a strong cold front.
Three Week Rainfall Map and Data Table for the 21 days ending at 8AM on Sep 18, 1999. Most rainfall during this period was due to Hurricanes Dennis and Floyd.
North Carolina Three Week Rainfall Map for the 21 days ending at 8AM on Sep 18, 1999. Heaviest rains fell in two areas--the southeast and northeast sections of the state. Most rainfall during this period was due to Hurricanes Dennis and Floyd. Note that western NC remains in severe drought.
Obtain Printable Forms of Recent Hourly, Daily, Monthly Data
Obtain Historical Hourly, Daily, Monthly Climatic Data
Satellite and Nexrad Radar Images of Floyd and Gert
Hurricane Floyd - IR landfall image after midnight, September 16th
Hurricane Floyd-Multi spectral false color image, September 15th, late afternoon
Hurricane Floyd - IR image over Abaco Island, Bahamas- Sept 14, afternoon
Hurricane Floyd - over Bahamas on morning of Sept 14, multi-spectral image
Hurricane Gert - colorized IR image from GOES-8 - afternoon of Sept 13
Amazing NOAA-15 before/after image of flooding in North Carolina
Additional images of hurricanes, typhoons and tropical systems for 1999 can be found insatellite images.
Elsewhere......
Details of the summer drought can be found on the NCDC Drought in the U.S. page. Additional drought information is available from:
NOAA's Drought Information Center
Latest NOAA U.S. Palmer Drought Index Map
Latest NOAA Crop Moisture Index Map
Note the amazing contrast from west to east across NC and VA.
Around the rest of the world in September, flooding from tropical storm Wendy caused problems across parts of eastern China, and floods have affected parts of Nepal, Bangladesh and eastern India, Bulgaria, and parts of Central and South America (El Salvador, Chile and Venezuela). Drought continues to be a problem in portions of Moracco, western India, and Pakistan. Hurricane Gert brushed the island of Bermuda, causing some damage there. Tropical Storm Harvey moved across Florida from west to east, causing rainfall in excess of 10 inches in some locations.
Other global highlights for September 1999 can be found at NOAA/OGP Special Global Summary for September 1999.
 Selected U.S. City and State Extremes
The Selected U.S. City and State Extremes provides a list of new records that were set across the U.S. during September 1999.
Additional Resources
- Hurricanes of 1999
- NOAA National Hurricane Center (NHC) Forecasts and Advisories
- NCDC Climatic Extremes and Weather Events
- NCDC Images/Movies of Hurricanes and Special Events (hundreds of satellite images)
- Federal Emergency Management Agency (FEMA) WWW site
- USA Today New Report on damages from Floyd, 9/22/99
- CNN--Hurricane and Weather Information
- CNN New Report on damages from Floyd, 9/21/99
- The Weather Channel--Hurricane and Weather Information
- USA Today--Hurricane and Weather Information
- USDA/NASS Vegetation Condition WWW Page
- NOAA Office of Global Programs (OGP) Rapid Response Project WWW Site
- Drought in the United States - 1999
- Global Drought and Climate Monitoring
- NCDC Storm Event Database
- Links to Numerous Natural Disaster Web Sites
- National Drought Mitigation Center - U.S.
- Disaster Relief Agency (news reports and information)
- Global Appeals and Disaster Situation Reports--1999 (Red Cross)
- NOAA/CPC Global Climate Highlights and Anomalies
For further information, contact:
Tom Ross
NOAA/National Climatic Data Center
151 Patton Avenue
Asheville, NC 28801-5001
phone:828-271-4499
fax: 828-271-4328
email: tom.ross@noaa.gov
Specific requests for climatic data should be addressed to: ncdc.orders@noaa.gov
Top of Page
NCDC / Climate Research / Climate-1999 / September / Climate-Watch / Search / Help
Created by Tom.Ross@noaa.gov, Neal.Lott@noaa.gov
Downloaded Saturday, 20-Sep-2008 14:38:12 EDT
Last Updated Thursday, 23-Jun-2005 14:58:22 EDT
Please see the NCDC Contact Page if you have questions or comments.