|
||
|
|
||
| ITS Home | ||
|
|
||
|
|
|
||
|
|
||
| ITS Home | ||
|
|
||
|
|
Phoenix, AZ Channel Impulse Response Measurements Click here for definition of terms.) Data were acquired in bursts of 64 or 128 equally spaced impulses using a stationary transmitter and mobile receiver. Several environment (urban high-rise, suburban, urban, and semi-rural) were measured, each with a continuous acquisition of bursts spaced approximately 8 seconds apart. The purpose of the measurements was to characterize the radio propagation for cell sites in the Phoenix, AZ area.
Sample Data from Phoenix Measurements — (Support NOT available) 
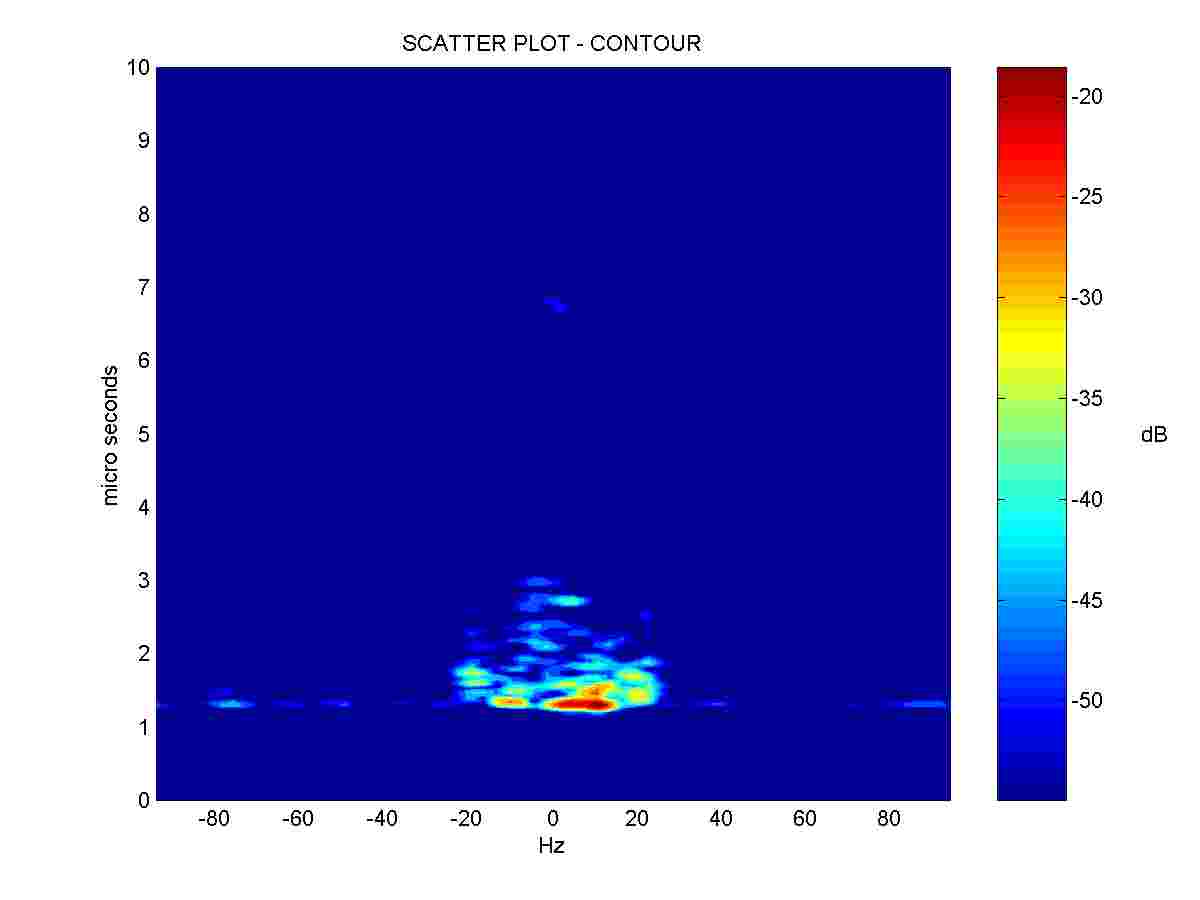 Scatter Plots (3D and Contour) of Sample Data
Sequential Impulse Plots (3D and Contour) of Sample Data The sample data was acquired at the Washington Cellular Base Station Site, Sector C. This is an urban area (building 1-3 stories high, mixed with houses). There are three bursts of data (records) within this file (00000145,sep), each consisting of 64 evenly spaced impulse acquisitions. Each burst is spaced approximately 8 seconds apart. The speed of travel information, exact location, and spacing between impulse acquisitions is contained within the file header information. The file format is contained in the pdf document listed below. Matlab M files for viewing the data are also available in the zip file listed below. NOTE: So that this file is NOT displayed to your computer monitor hold down the shift key while
clicking Download with your mouse. Download electronic copy of data file format document in pdf format The files in the portable document format (.pdf) require Adobe Acrobat Software for viewing.
Click the "Get Acrobat Reader" button to download Adobe Acrobat's Reader without charge.
Download Matlab M files for viewing and processing the data file. |
|
|
ITS Home |


