Internet Address: http://www.bls.gov/ro2/home.htm   Transmission of material in
Media Contact: Michael L. Dolfman,(212) 337-2500    this release is embargoed
Information: Martin Kohli,(646) 264-3620            until after 8:30 A.M. (EDT)
                                                    Tuesday, September 16, 2008
NEW YORK-NORTHERN NEW JERSEY CPI INCHED UP 0.1 PERCENT IN AUGUST,
5.4 PERCENT INCREASE FROM YEAR AGO
Retail prices in the greater New York area, as measured by the
Consumer Price Index for All Urban Consumers (CPI-U), inched up 0.1
percent in August, following an increase of 0.7 percent in July.
Michael L. Dolfman, Regional Commissioner of the U. S. Department of
Labor's Bureau of Labor Statistics, said the August index reflected
increases in housing and apparel. Higher prices for education and
communication and food and beverages also contributed to the rise.
These increases were largely offset by lower prices for
transportation. For the year ended in August 2008, the CPI-U
advanced 5.4 percent, the largest increase since June 2006, and core
inflation, as measured by the all items less food and energy index,
was 2.8 percent.
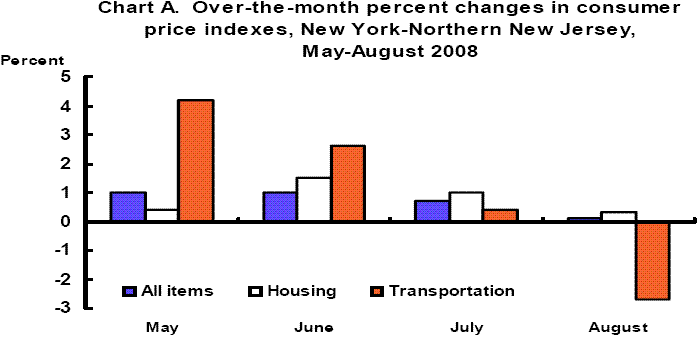
The housing index rose 0.3 percent in August, after increasing 1.0
percent in July. (See chart A.) The August increase was primarily
due to a rise in the shelter component. Shelter rose 0.5 percent,
with owners' equivalent rent and residential rent increasing 0.3 and
0.6 percent, respectively. Increases in dormitory charges also
contributed to the shelter rise. In the fuels and utilities
component, lower charges for natural gas (down 7.9 percent) and for
heating oil outweighed a 6.9-percent advance in electricity prices.
Despite the August decline, fuels and utilities prices climbed 23.7
percent over the year.
The apparel index, often up at this time of year with the
introduction of fall and winter lines, rose 4.5 percent, with
increases for women's apparel, including suits and separates. The
August increase followed decreases in both June and July. From
August 2007, apparel prices rose 3.0 percent, the largest 12-month
increase since September 2005.
 New York-Northern New Jersey CPI monthly and annual percent changes
(not seasonally adjusted)
| 2003 | 2004 | 2005 | 2006 | 2007 | 2008
Month | Mo | Ann | Mo | Ann | Mo | Ann | Mo | Ann | Mo | Ann | Mo | Ann
January 0.8 3.3 0.3 2.7 0.6 4.1 0.8 3.7 0.2 2.7 0.2 3.7
February 0.8 3.3 0.6 2.5 0.4 3.9 0.2 3.6 0.6 3.1 0.5 3.6
March 0.5 3.1 1.1 3.2 1.7 4.4 0.8 2.7 0.7 2.9 0.9 3.8
April -0.2 2.6 0.3 3.7 0.0 4.2 0.9 3.6 0.5 2.5 0.3 3.6
May 0.1 2.8 0.2 3.9 -0.5 3.4 0.6 4.8 0.6 2.5 1.0 4.0
June 0.1 2.8 0.8 4.6 -0.3 2.3 0.5 5.6 0.5 2.5 1.0 4.5
July 0.4 3.0 -0.2 3.9 0.9 3.4 0.2 5.0 0.2 2.5 0.7 5.1
August 0.7 3.1 0.1 3.3 0.8 4.1 0.4 4.7 -0.1 1.9 0.1 5.4
September 0.3 3.3 0.1 3.2 0.8 4.8 -0.5 3.3 0.0 2.4
October 0.2 3.3 0.7 3.7 0.4 4.5 -0.5 2.4 0.1 3.1
November -0.3 3.1 0.0 3.9 -0.6 3.9 -0.4 2.6 0.4 3.9
December -0.1 3.2 -0.2 3.8 -0.5 3.6 0.2 3.3 0.0 3.7
Transportation prices decreased 2.7 percent in August, the first
decline in six months. The transportation index decline was largely
due to a 7.4-percent drop in gasoline prices. The August index also
reflected price cuts for other motor fuels, as well as used cars and
trucks. Over the year, transportation prices increased 11.2 percent.
The education and communication index rose 1.6 percent over the
month, reflecting seasonal tuition increases, along with higher
charges for long distance telephone service. The food and beverages
index rose 0.6 percent. Prices for food at home rose 0.8 percent for
the second consecutive month. The August index included higher
prices for citrus fruits; apples; other fats and oils, including
peanut butter; canned fruits and vegetables; salad dressing; and
potatoes. Since August 2007, grocery prices have climbed 7.8 percent,
the largest 12-month increase since October 1990.
Among other expenditure categories, the recreation index inched up
0.1 percent in August, with price increases for newspapers and
magazines. Medical care also rose 0.1 percent, while the index for
other goods and services was unchanged.
With the New York-Northern New Jersey Consumer Price Index for All
Urban Consumers at 240.550 in August (1982-84=100), $24.06 was
required to purchase what $10 could in the 1982-84 base period. The
purchasing power of the dollar was 41.6 cents in 1982-84 dollars and
14.4 cents in 1967 dollars. In August, the Consumer Price Index for
Urban Wage Earners and Clerical Workers (CPI-W) was 235.510,
unchanged over the month. The CPI-W rose 6.1 percent over the year.
On a 1967 base, the August CPI-W was 670.557.
Data in this report are not seasonally adjusted. Accordingly,
month-to-month changes may reflect the impact of seasonal influences.
The New York-Northern New Jersey-Long Island, NY-NJ-CT-PA
consolidated area comprises the five boroughs of New York City,
Nassau, Suffolk, Westchester, Rockland, Putnam, Dutchess, and Orange
Counties in New York State; Bergen, Essex, Hudson, Hunterdon, Mercer,
Monmouth, Middlesex, Morris, Ocean, Passaic, Somerset, Sussex, Union
and Warren Counties in New Jersey; Fairfield County and parts of
Litchfield, New Haven and Middlesex Counties in Connecticut; and Pike
County in Pennsylvania.
NYLS - 7345 Labor - New York
09/12/08
Consumer Price Index for All Urban Consumers (CPI-U): Indexes and percent changes for selected periods
New York-Northern N.J.-Long Island, NY-NJ-CT-PA (1982-84=100 unless otherwise noted)
Indexes Percent change from-
Item and Group
June July Aug. Aug. June July
2008 2008 2008 2007 2008 2008
Expenditure category
All items................................. 238.580 240.273 240.550 5.4 0.8 0.1
All items (1967=100)...................... 689.702 694.595 695.396 - - -
Food and beverages....................... 221.658 223.278 224.520 6.0 1.3 .6
Food.................................... 220.934 222.523 223.732 6.1 1.3 .5
Food at home........................... 221.524 223.293 225.000 7.8 1.6 .8
Food away from home.................... 226.122 227.536 228.174 4.1 .9 .3
Alcoholic beverages..... 228.273 230.313 232.027 4.5 1.6 .7
Housing................................. 257.051 259.706 260.568 4.6 1.4 .3
Shelter................................ 304.891 307.161 308.643 2.9 1.2 .5
Rent of primary residence 1/........... 294.696 297.326 299.103 5.9 1.5 .6
Owners’ equivalent rent of primary
residence 1/ 2/ ................... 312.623 313.335 314.378 3.5 .6 .3
Fuels and utilities.................... 227.924 236.499 235.786 23.7 3.4 -.3
Household energy...................... 233.487 242.451 241.662 25.6 3.5 -.3
Gas (piped) and electricity 1/....... 214.201 223.953 227.868 19.2 6.4 1.7
Electricity 1/...................... 197.607 206.046 220.254 21.9 11.5 6.9
Utility (piped) gas service 1/...... 243.987 256.392 236.195 11.7 -3.2 -7.9
Household furnishings and operations... 127.815 127.691 127.318 -1.9 -.4 -.3
Apparel................................. 107.067 106.470 111.287 3.0 3.9 4.5
Transportation.......................... 217.187 218.149 212.162 11.2 -2.3 -2.7
Private transportation................. 207.008 208.336 201.938 11.4 -2.4 -3.1
Motor fuel............................ 315.400 319.030 295.412 34.9 -6.3 -7.4
Gasoline (all types)................. 313.724 317.421 293.916 34.7 -6.3 -7.4
Gasoline, unleaded regular 3/....... 319.984 323.309 297.984 35.7 -6.9 -7.8
Gasoline, unleaded midgrade 3/ 4/... 309.132 314.032 294.113 33.6 -4.9 -6.3
Gasoline, unleaded premium 3/....... 304.244 308.351 287.718 31.9 -5.4 -6.7
Medical care............................ 368.419 369.528 369.816 2.1 .4 .1
Recreation 5/........................... 115.674 115.350 115.423 1.1 -.2 .1
Education and communication 5/.......... 128.943 129.762 131.880 4.5 2.3 1.6
Other goods and services................ 349.941 352.966 352.883 4.9 .8 .0
Commodity and service group
All items................................ 238.580 240.273 240.550 5.4 .8 .1
Commodities............................. 185.345 186.181 184.969 7.4 -.2 -.7
Commodities less food and beverages.... 158.661 159.077 156.739 8.5 -1.2 -1.5
Nondurables less food and beverages... 198.938 200.119 196.430 15.0 -1.3 -1.8
Durables.............................. 107.284 106.819 106.094 -3.0 -1.1 -.7
Services................................ 284.256 286.672 288.192 4.2 1.4 0.5
Special aggregate indexes
All items less medical care.............. 232.589 234.288 234.562 5.5 .8 .1
All items less shelter................... 212.859 214.322 214.078 7.0 .6 -.1
Commodities less food.................... 161.774 162.241 160.006 8.3 -1.1 -1.4
Nondurables.............................. 212.970 214.380 212.998 10.2 .0 -.6
Nondurables less food.................... 201.185 202.415 199.000 14.2 -1.1 -1.7
Services less rent of shelter 2/......... 271.532 274.238 275.872 6.3 1.6 .6
Services less medical care services...... 276.853 279.306 280.888 4.3 1.5 .6
Energy................................... 268.490 275.268 264.974 29.5 -1.3 -3.7
All items less energy.................... 237.309 238.515 239.829 3.3 1.1 .6
All items less food and energy.......... 241.782 242.923 244.264 2.8 1.0 .6
1/ This index series was calculated using a Laspeyres estimator. All other item
stratum index series were calculated using a geometric means estimator.
2/ Index is on a December 1982=100 base.
3/ Special index based on a substantially smaller sample.
4/ Indexes on a December 1993=100 base.
5/ Indexes on a December 1997=100 base.
- Data not available.
New York-Northern New Jersey CPI monthly and annual percent changes
(not seasonally adjusted)
| 2003 | 2004 | 2005 | 2006 | 2007 | 2008
Month | Mo | Ann | Mo | Ann | Mo | Ann | Mo | Ann | Mo | Ann | Mo | Ann
January 0.8 3.3 0.3 2.7 0.6 4.1 0.8 3.7 0.2 2.7 0.2 3.7
February 0.8 3.3 0.6 2.5 0.4 3.9 0.2 3.6 0.6 3.1 0.5 3.6
March 0.5 3.1 1.1 3.2 1.7 4.4 0.8 2.7 0.7 2.9 0.9 3.8
April -0.2 2.6 0.3 3.7 0.0 4.2 0.9 3.6 0.5 2.5 0.3 3.6
May 0.1 2.8 0.2 3.9 -0.5 3.4 0.6 4.8 0.6 2.5 1.0 4.0
June 0.1 2.8 0.8 4.6 -0.3 2.3 0.5 5.6 0.5 2.5 1.0 4.5
July 0.4 3.0 -0.2 3.9 0.9 3.4 0.2 5.0 0.2 2.5 0.7 5.1
August 0.7 3.1 0.1 3.3 0.8 4.1 0.4 4.7 -0.1 1.9 0.1 5.4
September 0.3 3.3 0.1 3.2 0.8 4.8 -0.5 3.3 0.0 2.4
October 0.2 3.3 0.7 3.7 0.4 4.5 -0.5 2.4 0.1 3.1
November -0.3 3.1 0.0 3.9 -0.6 3.9 -0.4 2.6 0.4 3.9
December -0.1 3.2 -0.2 3.8 -0.5 3.6 0.2 3.3 0.0 3.7
Transportation prices decreased 2.7 percent in August, the first
decline in six months. The transportation index decline was largely
due to a 7.4-percent drop in gasoline prices. The August index also
reflected price cuts for other motor fuels, as well as used cars and
trucks. Over the year, transportation prices increased 11.2 percent.
The education and communication index rose 1.6 percent over the
month, reflecting seasonal tuition increases, along with higher
charges for long distance telephone service. The food and beverages
index rose 0.6 percent. Prices for food at home rose 0.8 percent for
the second consecutive month. The August index included higher
prices for citrus fruits; apples; other fats and oils, including
peanut butter; canned fruits and vegetables; salad dressing; and
potatoes. Since August 2007, grocery prices have climbed 7.8 percent,
the largest 12-month increase since October 1990.
Among other expenditure categories, the recreation index inched up
0.1 percent in August, with price increases for newspapers and
magazines. Medical care also rose 0.1 percent, while the index for
other goods and services was unchanged.
With the New York-Northern New Jersey Consumer Price Index for All
Urban Consumers at 240.550 in August (1982-84=100), $24.06 was
required to purchase what $10 could in the 1982-84 base period. The
purchasing power of the dollar was 41.6 cents in 1982-84 dollars and
14.4 cents in 1967 dollars. In August, the Consumer Price Index for
Urban Wage Earners and Clerical Workers (CPI-W) was 235.510,
unchanged over the month. The CPI-W rose 6.1 percent over the year.
On a 1967 base, the August CPI-W was 670.557.
Data in this report are not seasonally adjusted. Accordingly,
month-to-month changes may reflect the impact of seasonal influences.
The New York-Northern New Jersey-Long Island, NY-NJ-CT-PA
consolidated area comprises the five boroughs of New York City,
Nassau, Suffolk, Westchester, Rockland, Putnam, Dutchess, and Orange
Counties in New York State; Bergen, Essex, Hudson, Hunterdon, Mercer,
Monmouth, Middlesex, Morris, Ocean, Passaic, Somerset, Sussex, Union
and Warren Counties in New Jersey; Fairfield County and parts of
Litchfield, New Haven and Middlesex Counties in Connecticut; and Pike
County in Pennsylvania.
NYLS - 7345 Labor - New York
09/12/08
Consumer Price Index for All Urban Consumers (CPI-U): Indexes and percent changes for selected periods
New York-Northern N.J.-Long Island, NY-NJ-CT-PA (1982-84=100 unless otherwise noted)
Indexes Percent change from-
Item and Group
June July Aug. Aug. June July
2008 2008 2008 2007 2008 2008
Expenditure category
All items................................. 238.580 240.273 240.550 5.4 0.8 0.1
All items (1967=100)...................... 689.702 694.595 695.396 - - -
Food and beverages....................... 221.658 223.278 224.520 6.0 1.3 .6
Food.................................... 220.934 222.523 223.732 6.1 1.3 .5
Food at home........................... 221.524 223.293 225.000 7.8 1.6 .8
Food away from home.................... 226.122 227.536 228.174 4.1 .9 .3
Alcoholic beverages..... 228.273 230.313 232.027 4.5 1.6 .7
Housing................................. 257.051 259.706 260.568 4.6 1.4 .3
Shelter................................ 304.891 307.161 308.643 2.9 1.2 .5
Rent of primary residence 1/........... 294.696 297.326 299.103 5.9 1.5 .6
Owners’ equivalent rent of primary
residence 1/ 2/ ................... 312.623 313.335 314.378 3.5 .6 .3
Fuels and utilities.................... 227.924 236.499 235.786 23.7 3.4 -.3
Household energy...................... 233.487 242.451 241.662 25.6 3.5 -.3
Gas (piped) and electricity 1/....... 214.201 223.953 227.868 19.2 6.4 1.7
Electricity 1/...................... 197.607 206.046 220.254 21.9 11.5 6.9
Utility (piped) gas service 1/...... 243.987 256.392 236.195 11.7 -3.2 -7.9
Household furnishings and operations... 127.815 127.691 127.318 -1.9 -.4 -.3
Apparel................................. 107.067 106.470 111.287 3.0 3.9 4.5
Transportation.......................... 217.187 218.149 212.162 11.2 -2.3 -2.7
Private transportation................. 207.008 208.336 201.938 11.4 -2.4 -3.1
Motor fuel............................ 315.400 319.030 295.412 34.9 -6.3 -7.4
Gasoline (all types)................. 313.724 317.421 293.916 34.7 -6.3 -7.4
Gasoline, unleaded regular 3/....... 319.984 323.309 297.984 35.7 -6.9 -7.8
Gasoline, unleaded midgrade 3/ 4/... 309.132 314.032 294.113 33.6 -4.9 -6.3
Gasoline, unleaded premium 3/....... 304.244 308.351 287.718 31.9 -5.4 -6.7
Medical care............................ 368.419 369.528 369.816 2.1 .4 .1
Recreation 5/........................... 115.674 115.350 115.423 1.1 -.2 .1
Education and communication 5/.......... 128.943 129.762 131.880 4.5 2.3 1.6
Other goods and services................ 349.941 352.966 352.883 4.9 .8 .0
Commodity and service group
All items................................ 238.580 240.273 240.550 5.4 .8 .1
Commodities............................. 185.345 186.181 184.969 7.4 -.2 -.7
Commodities less food and beverages.... 158.661 159.077 156.739 8.5 -1.2 -1.5
Nondurables less food and beverages... 198.938 200.119 196.430 15.0 -1.3 -1.8
Durables.............................. 107.284 106.819 106.094 -3.0 -1.1 -.7
Services................................ 284.256 286.672 288.192 4.2 1.4 0.5
Special aggregate indexes
All items less medical care.............. 232.589 234.288 234.562 5.5 .8 .1
All items less shelter................... 212.859 214.322 214.078 7.0 .6 -.1
Commodities less food.................... 161.774 162.241 160.006 8.3 -1.1 -1.4
Nondurables.............................. 212.970 214.380 212.998 10.2 .0 -.6
Nondurables less food.................... 201.185 202.415 199.000 14.2 -1.1 -1.7
Services less rent of shelter 2/......... 271.532 274.238 275.872 6.3 1.6 .6
Services less medical care services...... 276.853 279.306 280.888 4.3 1.5 .6
Energy................................... 268.490 275.268 264.974 29.5 -1.3 -3.7
All items less energy.................... 237.309 238.515 239.829 3.3 1.1 .6
All items less food and energy.......... 241.782 242.923 244.264 2.8 1.0 .6
1/ This index series was calculated using a Laspeyres estimator. All other item
stratum index series were calculated using a geometric means estimator.
2/ Index is on a December 1982=100 base.
3/ Special index based on a substantially smaller sample.
4/ Indexes on a December 1993=100 base.
5/ Indexes on a December 1997=100 base.
- Data not available.
Last Modified Date: September 16, 2008
Quick Links
Tools
|
Calculators
|
Help
|
Info
|
|