Winter Storm of January 31 to February 1, 2008
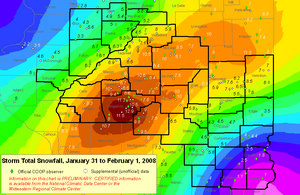
Preliminary storm total snowfall map. Click image to enlarge.
Event Summary:
A significant winter storm affected central Illinois during the January 31st through February 1st time frame, bringing widespread heavy snowfall to the region. The heaviest snow fell in a swath along and northwest of a Champaign, to Decatur, to Springfield line, where 6 to 10 inch amounts were common. A few locations picked up as much as 10 to 12 inches, with an unofficial report from Jerome (Sangamon County) of 12.9 inches! The snow was considerably lighter northwest of the Illinois River, where amounts were generally in the 3 to 6 inch range. Meanwhile further southeast along and south of I-70, the precipitation was initially mixed with rain and sleet, which tended to limit total accumulations to between 1 and 4 inches.
A vigorous upper-level disturbance tracked across the Rockies into the Southern Plains on January 31st, inducing surface cyclogenesis across Oklahoma. As the surface low pressure system began tracking northeastward, it tapped into ample moisture from the Gulf of Mexico, which resulted in the development of light snow across parts of central Illinois during the early afternoon of the 31st. Once the atmosphere moistened sufficiently, the snow became heavier and more widespread toward evening. Further southeast, the atmosphere was initially too warm to support snow, so the precipitation started out as a rain/sleet mixture south of I-70. As the evening progressed, the low deepened and tracked into western Kentucky. Bands of moderate to occasionally heavy snow set up across central Illinois, with widespread accumulations between 2 and 4 inches reported by midnight. During the overnight hours, the surface low continued to push into the Ohio Valley, while the strong upper-level disturbance that initially triggered it moved into the region. The added lift provided by the upper wave helped intensify the snow bands after midnight, producing snowfall rates between one and two inches per hour at times. Enough instability existed in the environment that a few reports of thunder were received, particularly across parts of Sangamon and Macon Counties. As the system wound up, an area of dry mid-level air known as the "dry slot" began to work northward, essentially cutting the precipitation off across locations east of I-57. Meanwhile, further west, the snow persisted for much of the night.
| Official Stations (includes climate and cooperative observer stations) |
Supplemental (unofficial) Stations (includes CoCoRaHS and SWOP stations) |
|
Lincoln 8.4 Central Illinois: East Central Illinois: Southeast Illinois: |
Central Illinois: East Central Illinois: Southeast Illinois: |
