Home > State & U.S. Historical Data > State Energy Profiles > Texas

State Energy Profile - Texas

Energy Information Administration - State Energy Profiles

http://tonto.eia.doe.gov/state
State Energy Profile for Texas
Last Update: January 02, 2009
Next Update: January 08 , 2009

LNG Import Terminal
Terminal Name: Golden Pass
(under construction) LNG Import Terminal
Terminal Name: Freeport
(under construction) Texas Energy Map - If you are unable to view this image contact the National Energy Information Center at 202-586-8800 for assistance

    Texas Quick Facts

  • Texas is the leading crude oil-producing State in the Nation (excluding Federal offshore areas, which produce more than any single State).
  • The State’s signature crude oil type, known as West Texas Intermediate (WTI), remains the major benchmark of crude oil in the Americas.
  • Texas’s 25 petroleum refineries can process more than 4.6 million barrels of crude oil per day, and they account for more than one-fourth of total U.S. refining capacity.
  • More than one-fourth of total U.S. natural gas production occurs in Texas, making it the Nation’s leading natural gas producer.
  • Texas also leads the Nation in wind-powered generation capacity; there are over 2,000 wind turbines in West Texas alone.
  • Texas produces and consumes more electricity than any other State, and per capita residential use is significantly higher than the national average.


Overview

Resources and Consumption

Texas leads the Nation in fossil fuel reserves and in non-hydropower renewable energy potential. Texas crude oil reserves represent almost one-fourth of total U.S. oil reserves, and Texas natural gas reserves account for almost three-tenths of total U.S. natural gas reserves. Although Texas’s oil reserves are found throughout the State in several geologic basins, the largest remaining reserves are concentrated in the Permian Basin of West Texas, which contains more than 20 of the Nation’s top 100 oil fields. Similarly, deposits of natural gas are found in abundance in several Texas production basins, with the largest fields heavily concentrated in the East Texas Basin in the northeastern part of the State. Texas’s fossil fuel reserves also include substantial deposits of lignite coal, found in narrow bands in the Gulf Coast region, and bituminous coal, found in north central and southwestern Texas.

Texas is also rich in renewable energy potential, including wind, solar, and biomass resources. Wind resource areas in the Texas Panhandle, along the Gulf Coast south of Galveston, and in the mountain passes and ridgetops of the Trans-Pecos offer Texas some of the greatest wind power potential in the United States. Solar power potential is also among the highest in the country, with high levels of direct solar radiation (suitable to support large-scale solar power plants) concentrated in West Texas. Due to its large agricultural and forestry sectors, Texas has an abundance of biomass energy resources. Although Texas is not known as a major hydropower State, substantial untapped potential exists in several river basins, including the Colorado River of Texas and the Lower Red.

Due to its large population and an energy-intensive economy, Texas leads the Nation in energy consumption, accounting for more than one-tenth of total U.S. energy use. Energy-intensive industries in Texas include aluminum, chemicals, forest products, glass, and petroleum refining.

Petroleum

Texas leads the United States in both crude oil production and refining capacity. Texas’s first major oil boom began in 1901 with the discovery of the Spindle Top oil field in the upper Gulf Coast basin. Since then, major discoveries have been made in East Texas, West Texas, and offshore in the Gulf of Mexico. Texas oil production increased until 1972, when it peaked at more than 3.4 million barrels per day. Afterward, production declined rapidly, and in recent years Texas crude oil output has fallen to less than one-third of its 1972 peak.

Although Texas oil production is in decline, the State’s signature crude oil type, known as West Texas Intermediate (WTI), remains the major benchmark of crude oil in the Americas. Because of its light consistency and low-sulfur content, the quality of WTI is considered to be high, and it yields a large fraction of gasoline when refined. Most WTI crude oil is sent via pipeline to Midwest refining centers, although much of this crude oil is also refined in the Gulf Coast region.

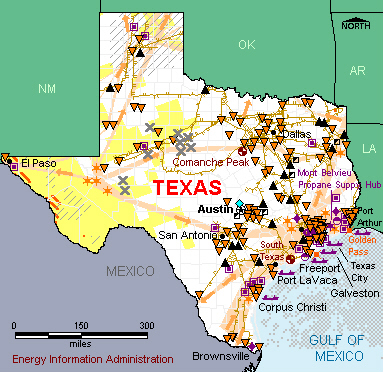
Texas’s 26 petroleum refineries can process nearly 4.8 million barrels of crude oil per day, and they account for more than one-fourth of total U.S. refining capacity. Most of the State’s refineries are clustered near major ports along the Gulf Coast, including Houston, Port Arthur, and Corpus Christi. These coastal refineries have access to local Texas production, foreign imports, and oil produced offshore in the Gulf of Mexico, as well as the U.S. government’s Strategic Petroleum Reserve, which operates two large storage facilities in Bryan Mound and Big Hill, Texas. Many of Texas’s refineries are sophisticated facilities that use additional refining processes beyond simple distillation to yield a larger quantity of lighter, higher value products, such as gasoline. Because of this downstream capability, Texas refineries often process a wide variety of crude oil types from around the world, including heavier, lower value varieties.

Refineries in the Houston area, including the Baytown refinery, the Nation’s largest refinery, make up the largest refining center in the United States. From Houston, refined product pipelines spread across the country, allowing Texas petroleum products to reach virtually every major consumption market east of the Rocky Mountains. This network includes the Colonial Pipeline system (Koch), which is the largest petroleum product pipeline system in the United States and is vital for supplying markets throughout the South and East Coast.

Texas’s total petroleum consumption is the highest in the Nation, and the State leads the country in consumption of asphalt and road oil, distillate fuel oil, jet fuel, liquefied petroleum gases (LPG), and lubricants. Texas LPG use is greater than the LPG consumption of all other States combined, due primarily to the State’s active petrochemical industry, which is the largest in the United States. Four separate motor gasoline blends are required in Texas to meet the diverse air quality needs of different parts the State, including reformulated motor gasoline blended with ethanol required in the metropolitan areas of Houston and Dallas-Forth Worth. The agriculture-rich Texas Panhandle has several corn- and milo-based ethanol plants that are operational or under construction.

Natural Gas

Texas is the Nation’s leading natural gas producer, accounting for more than one-fourth of total U.S. natural gas production. In the early days of Texas oil production, natural gas found with oil was largely considered a nuisance and was often flared (burned off) at the wellhead. Although some Texas cities and towns located near oil fields began using natural gas for energy, it was not until the State banned flaring after World War II that oil producers began to find new markets for natural gas. Two pipelines that once carried crude oil to the East Coast were converted to carry natural gas and a new natural gas pipeline to California was built, setting the stage for strong natural gas production growth in the 1950s and 60s. Texas natural gas production reached its peak in 1972 at more than 9.6 billion cubic feet of annual production. Since then, output has declined steadily to less than three-fifths of that level.

Today, an expansive network of interstate natural gas pipelines extends from Texas, reaching consumption markets from coast to coast, including those in California, the Midwest, the East Coast, and New England. Texas has 10 natural gas market hubs located in both East and West Texas, more than any other State, and its natural gas storage capacity is among the highest in the Nation. Most of Texas’s 34 active storage facilities are depleted oil and gas fields converted for storage use, although many sites have also been developed in salt dome formations. These storage facilities allow Texas to store its natural gas production during the summer when national demand is typically lower and to ramp up delivery quickly during the winter months when markets across the country require greater volumes of natural gas to meet their home heating needs. However, due to the growing use of natural gas for electricity generation in the United States, Texas has occasionally withdrawn natural gas from storage during the summer months to help meet peak electricity demand for air-conditioning use.

Texas consumes more natural gas than any other State and accounts for about one-fifth of total U.S. natural gas consumption. Texas natural gas demand is dominated by the industrial and electric power sectors, which together account for more than four-fifths of State use. Because Texas demand is high, and because the State’s natural gas infrastructure is well connected to consumption markets throughout the country, several companies have proposed building liquefied natural gas (LNG) import terminals along the Gulf Coast in Texas.

Coal, Electricity, and Renewables

Natural gas-fired power plants typically account for about one-half of the electricity produced in Texas and coal-fired plants account for much of the remaining generation. Although Texas produces a substantial amount of coal from 13 surface mines, including five of the 50 largest in the United States, the State relies on rail deliveries of subbitiminous coal from Wyoming for the majority of its supply. Nearly all of the coal mined in Texas is lignite coal, the lowest grade of coal, and all of it is consumed in the State, mostly in arrangements where a single utility operates both the mine and an adjacent coal-fired power plant. Although lower in energy content than other varieties of coal, lignite coal is also low in sulfur, an important consideration in the State’s efforts to lower emissions. Texas consumes more coal than any other State and its emissions of carbon dioxide and sulfur dioxide are among the highest in the Nation.

Texas is a major nuclear power generating State. Two nuclear plants, Comanche Peak and South Texas Project, typically account for about one-tenth of the State’s electric power production. Until the recent uprating (capacity improvement) of the Number 2 reactor at Palo Verde in Arizona, the two South Texas Project nuclear reactors were the largest in the Nation.

Although renewable energy sources contribute minimally to the Texas power grid, Texas leads the Nation in wind-powered generation capacity, and substantial new wind generation capacity is under construction in Texas. Texas surpassed California as the country’s largest wind energy producer in 2006. Currently, there are over 2,000 wind turbines in West Texas alone, and the numbers continue to increase as development costs continue to drop and wind turbine technology improves. At 736 MW, the Horse Hollow Wind Energy Center in central Texas is the largest wind power facility in the world.

Texas produces and consumes more electricity than any other State. Despite large net interstate electricity imports in some areas, the Texas Interconnect power grid is largely isolated from the integrated power systems serving the eastern and western United States, and most areas of Texas have little ability to export or import electricity to and from other States. Texas per capita residential use of electricity is significantly higher than the national average, due to high demand for electric air-conditioning during hot summer months and the widespread use of electricity as the primary energy source for home heating during typically mild winter months.


Data

Economy
Population and Employment Texas U.S. Rank Period
Population 23.9 million    2
2007
Civilian Labor Force 11.6 million    2
2007
Per Capita Personal Income $37,187    22
2007
Industry Texas U.S. Rank Period
Gross Domestic Product by State $1142.0 billion    2 2007
Land in Farms 129.9 million acres    1
2002
Market Value of Agricultural Products Sold $14.1 billion    2
2002

 Prices
Petroleum Texas U.S. Avg. Period
Domestic Crude Oil First Purchase $101.76/barrel
$98.5/barrel Sep-08
No. 2 Heating Oil, Residential $3.666/gal Sep-08
  Regular Motor Gasoline Sold Through Retail Outlets (Excluding Taxes) $3.148/gal $3.207/gal Sep-08
  State Tax Rate on Motor Gasoline
(other taxes may apply)
$0.2/gal $0.2159/gal Aug-08
  No. 2 Diesel Fuel Sold Through Retail Outlets (Excluding Taxes) $3.484/gal Sep-08
  State Tax Rate on On-Highway Diesel
(other taxes may apply)
$0.2/gal $0.2214/gal Aug-08
Natural Gas Texas U.S. Avg. Period
  Wellhead $6.60/thousand cu ft $6.40/thousand cu ft 2006
  City Gate $9.54/thousand cu ft $8.96/thousand cu ft Sep-08
  Residential $20.0/thousand cu ft $17.94/thousand cu ft Sep-08
Coal Texas U.S. Avg. Period
  Average Open Market Sales Price $19.47/short ton $26.20/short ton 2007
  Delivered to Electric Power Sector W $ 2.16 /million Btu Sep-08
Electricity Texas U.S. Avg. Period
  Residential 13.42 cents/kWh 11.94 cents/kWh Sep-08
  Commercial 10.89 cents/kWh 10.77 cents/kWh Sep-08
  Industrial 8.98 cents/kWh 7.36 cents/kWh Sep-08
       

 Reserves & Supply
Reserves Texas Share of U.S. Period
  Crude Oil 5,122 million barrels 24.0% 2007
  Dry Natural Gas 72,091 billion cu ft 30.3% 2007
  Natural Gas Liquids 3,658 million barrels 40.0% 2007
  Recoverable Coal at Producing Mines 737 million short tons 3.9 % 2007
Rotary Rigs & Wells Texas Share of U.S. Period
Rotary Rigs in Operation 834 47.1% 2007
Crude Oil Producing Wells 144,660 28.9% 2007
Natural Gas Producing Wells 83,218 18.5% 2006
Production Texas Share of U.S. Period
  Total Energy 10,830 trillion Btu 15.6% 2005
  Crude Oil 33,952 thousand barrels 28.6% Jul-08
  Natural Gas - Marketed 5,513,739 million cu ft 28.4% 2006
  Coal 41,948 thousand short tons NA 2007
Capacity Texas Share of U.S. Period
  Crude Oil Refinery Capacity (as of Jan. 1) 4,751,746 barrels/calendar day 27.2% 2008
  Electric Power Industry Net Summer Capability 100,754 MW 10.2% 2006
Net Electricity Generation Texas Share of U.S. Period
  Total Net Electricity Generation 32,247 thousand MWh 9.6% Sep-08
  Petroleum-Fired 6 thousand MWh 0.2% Sep-08
  Natural Gas-Fired 15,206 thousand MWh 19.6% Sep-08
  Coal-Fired 12,686 thousand MWh 7.8% Sep-08
  Nuclear 3,438 thousand MWh 5.1% Sep-08
  Hydroelectric 51 thousand MWh 0.3% Sep-08
  Other Renewables 546 thousand MWh 6.7% Sep-08
Stocks Texas Share of U.S. Period
  Motor Gasoline (Excludes Pipelines) 8,126 thousand barrels 13.8% Sep-08
  Distillate Fuel Oil (Excludes Pipelines) 10,493 thousand barrels 11.2% Sep-08
  Natural Gas in Underground Storage 526,535 million cu ft 7.1% Sep-08
  Petroleum Stocks at Electric Power Producers 1,079 thousand barrels 2.7 % Sep-08
  Coal Stocks at Electric Power Producers 14,804 thousand tons 10.2% Sep-08
Production Facilities Texas
  Major Coal Mines Jewett Mine/Texas Westmoreland Coal Co. • Oak Hill Strip/TXU Mining Co. LP • Beckville Strip/TXU Mining Co. LP • South Hallsville No. 1/Sabine Mining Co. • Big Brown Strip/TXU Mining Company LP
  Petroleum Refineries Age Refining Inc (San Antonio) • Alon USA Energy Inc (Big Springs) • BP Products North America Inc (Texas City) • Citgo Refining & Chemical Inc (Corpus Christi) • ConocoPhillips Company (Sweeny) • Deer Park Refining LTD Partnership (Deer Park) • Delek Refining LTD (Tyler) • Equistar Chemicals LP (Channelview) • ExxonMobil Refining & Supply Co (Baytown) • ExxonMobil Co (Beaumont) • Flint Hills Resources LP (Corpus Christi) • Houston Refining LP (Houston) • Marathon Petroleum Co LLC (Texas City) • Motiva Enterprises LLC (Port Arthur) • Pasadena Refining Systems Inc (Pasadena) • Premcor Refining Group Inc (Port Arthur) • South Hampton Resources Inc (Silsbee) • Total Petrochemicals Inc (Port Arthur) • Trigeant LTD (Corpus Christi) • Valero Energy Corporation (Sunray) • Valero Energy Corporation (Three Rivers) • Valero Refining Co Texas LP (Corpus Christi) •Valero Refining Co Texas LP (Houston) • Valero Refining Co Texas LP (Texas City) • Western Refining Company LP (El Paso) • WRB Refinging LLC (Borger)
  Major Non-Nuclear Electricity Generating Plants W A Parish (NRG Texas LLC) • Cedar Bayou (NRG Texas LLC) • Martin Lake (TXU Generation Co LP) • P H Robinson (NRG Texas LLC) • Sabine (Entergy Gulf States Inc)
  Nuclear Power Plants South Texas Project (STP Nuclear Operating Co) • Comanche Peak (TXU Generation Co LP)
       

 Distribution & Marketing
Distribution Centers Texas
Oil Seaports/Oil Import Sites Houston • Port Arthur • Corpus Christi • Texas City • Freeport • Beaumont • Brownsville • Galveston • Port LaVaca
  Natural Gas Market Centers Agua Dulce Hub (Production Center) • Carthage Hub (Market Hub) • Katy Hub (Market Hub) • Katy Storage Center (Market Hub) • Moss Bluff Hub (Market Hub) • Spindletop Storage Hub (Market Hub) • Waha (Lonestar) Hub • Waha (Encina) Hub • Waha (DEFS) Hub • Waha (EPGT) Texas Hub.
Major Pipelines Texas
Crude Oil All American • Amoco • Arco • Camden • Celex • Chevron • Coastal • Conoco • Duke • EOTT Energy • ETML • Exxon • Farmland • Fina • Genesis • Jayhawk • Koch • Matador • Mobil • Natural Gas Clearinghouse • Pactex • Phillips • Pride • Scurlock-Permian • Seaway • Shell • Sun • Texaco • Texas-New Mexico • Ultramar-Diamond Shamrock • Unocal • West Texas Gulf.
Petroleum Product ATA • Chevron • Citgo • Coastal • Conoco • DSE • Explorer • Exxon • Koch • Longhorn • Magellan • Mobil • Navajo • Phillips • Pride • Shell • Sigmor • SFPP • TEPPCO • Texaco • River • STOP • Trust • UDS.
Liquefied Petroleum Gases Chevron • Coastal • Conoco • Dettco • Dixie • Dow • DSE • Duke • Dynegy • Exxon • Highlands • Koch • MAPCO • Mitchell • Mobil • NuStar • Oxy • Phillips • Pride • Rio Grande • Sea Gull • Seadrift • Seminole • TEPPCO • Texas Eastman • Tejas • UPR • Valero.
  Interstate Natural Gas Pipelines ANR Pipeline Co. • Centerpoint Energy Gas Transmission Co. • Colorado Interstate Gas • El Paso Natural Gas Co. • Enbridge Pipelines (East Texas) • Florida Gas Transmission Co. • Gulf South Pipeline Co. • KM Interstate Gas Co. • Mississippi River Transmission Corp. • Natural Gas Pipeline Company of America • Northernal Natural Gas Co. • Oneok Westek Pipeline Co. • Oneok Gas Transportation Systems • Panhandle Eastern Pipeline Co. • Southern Natural Gas Co. • Southern Star Central Gas Pipeline Co. • Tennessee Gas Pipeline Co. • Texas Eastern Transmission Corp. • Texas Gas Transmission Co. • Transcontinental Gas Pipeline Co. • Transok Inc. • Transwestern Pipeline Co. • Trunkline Gas Co.
Fueling Stations Texas Share of U.S. Period
Motor Gasoline 13,760 8.4% 2007
Liquefied Petroleum Gases 525 22.9% 2007
Compressed Natural Gas 15 1.9% 2007
Ethanol 33 2.3% 2007
Other Alternative Fuels 58 5.0% 2007
       

 Consumption

per Capita Texas U.S. Rank Period
Total Energy 502 million Btu    5 2006
by Source Texas Share of U.S. Period
Total Energy 11,744 trillion Btu 11.8% 2006
Total Petroleum 1,199,918 thousand barrels 15.9% 2006
    Motor Gasoline 285,419 thousand barrels 8.5% 2006
    Distillate Fuel 141,350 thousand barrels 9.3% 2006
    Liquefied Petroleum Gases 422,776 thousand barrels 56.4% 2006
    Jet Fuel 81,452 thousand barrels 13.7% 2006
Natural Gas 3,433,863 million cu ft 14.9% 2006
Coal 103,763 thousand short tons 9.3% 2006
by End-Use Sector Texas Share of U.S. Period
Residential 1,579,620 billion Btu 7.6% 2006
Commercial 1,375,315 billion Btu 7.8% 2006
Industrial 5,926,088 billion Btu 18.4% 2006
Transportation 2,863,361 billion Btu 9.9% 2006
for Electricity Generation Texas Share of U.S. Period
Petroleum 12 thousand barrels 0.2% Sep-08
Natural Gas 123,520 million cu ft 19.8% Sep-08
Coal 8,916 thousand short tons 10.3% Sep-08
for Home Heating (share of households) Texas U.S. Avg. Period
Natural Gas 43% 51.2% 2000
Fuel Oil 0% 9.0% 2000
Electricity 49% 30.3% 2000
Liquefied Petroleum Gases 6% 6.5% 2000
Other/None 2% 1.8% 2000
       

 Environment
Special Programs Texas
Clean Cities Coalitions The Alamo Area (San Antonio) • Central Texas (Austin) • Dallas/Ft. Worth • East Texas • Houston-Galveston • South East Texas (Beaumont-Port Arthur) •
Alternative Fuels Texas Share of U.S. Period
  Alternative-Fueled Vehicles in Use 92,968 15.7% 2006
Ethanol Plants 0 0.0% 2008
Ethanol Plant Capacity 0 million gal/year 0.0% 2008
Ethanol Use in Gasohol 28,734 thousand gal 0.8% 2004
Electric Power Industry Emissions Texas Share of U.S. Period
  Carbon Dioxide
257,552,164 metric tons 10.5% 2006
Sulfur Dioxide
558,350 metric tons 5.9% 2006
  Nitrogen Oxide
260,057 metric tons 6.8% 2006
       
     = No data reported; NA = Not available; W = Withheld to avoid disclosure of individual company data.
Recent Updates

January 2, 2009
• Updated the following petroleum and natural gas statistics to October 2008:
  - Prices of crude oil, residential heating oil, motor gasoline, and diesel fuel
  - Prices of city gate and residential natural gas
  - Stocks of motor gasoline, distillate fuel oil, and natural gas in underground storage
• Updated population estimates to 2008
 

Sign up for State Energy Emails

References
Notes & Sources:
       Maps | Quick Facts & Overviews | Data
State Data Directory
About State Energy Profiles
   
Related Reports
State Energy Data System (SEDS)
tables that display comprehensive State data from as early as 1960 to the present 
State Electricity Profiles
tables that provide time series data from 1990 forward for key electricity indicators by State

State Renewable Electricity Profiles
tables that provide data for the most recent year on capacity and generation of electricity from renewable sources

State Compendium of Nuclear Power Plants
State-by-State reports on the nuclear industry
Natural Gas Residential Choice Programs
written overviews of the status of natural gas industry restructuring in each State, focusing on the residential customer class
Status of Electricity Restructuring by State
annotated map showing details of the status of electricity restructuring in each State
Regional Energy Profiles
reports and maps that explore regional variations in U.S. energy consumption