| US Imports of Steel Mill Products | |||
| FOR Bars-Reinforcing -- C & A |
|||
| Quantity in Metric Tons | |||
| Same Table - US Dollars |
Same Table - Average Unit Value |
||
| 'C & A' = Carbon and Alloy products, 'S' = Stainless products | |||
| Graph | Country | Census Data | License Data | |||||||||||||
|---|---|---|---|---|---|---|---|---|---|---|---|---|---|---|---|---|
| JUL07 | AUG07 | SEP07 | OCT07 | NOV07 | DEC07 | JAN08 | FEB08 | MAR08 | APR08 | MAY08 | JUN08 | JUL08 | AUG08 | SEP08 | ||
| M | WORLD | 264,191 | 105,102 | 114,663 | 55,408 | 60,888 | 49,804 | 115,313 | 108,264 | 110,462 | 157,383 | 51,307 | 60,723 | 79,308 | 62,943 | 33,060 |
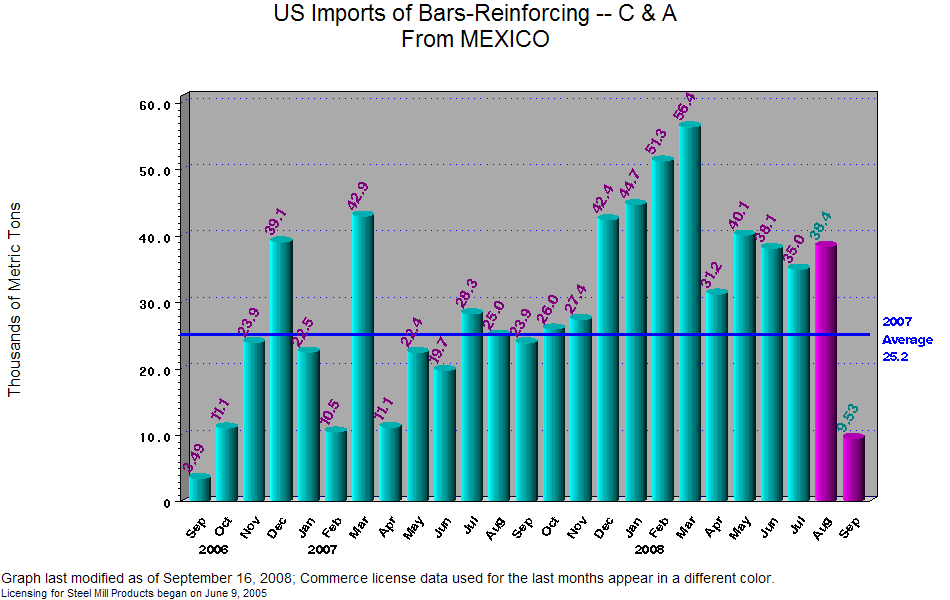
| M | MEXICO | 28,306 | 25,095 | 23,931 | 26,019 | 27,440 | 42,464 | 44,737 | 51,315 | 56,451 | 31,286 | 40,136 | 38,161 | 35,029 | 38,442 | 7,052 |
| M | JAPAN | 34,382 | 10,135 | 5,076 | 4,032 | 5,914 | . | 5,353 | . | 21,931 | 25,329 | 1,768 | 16,622 | 13,696 | 21,915 | 11,727 |
| M | TURKEY | 52,276 | 15,968 | 53,833 | . | 20,494 | . | 58,211 | 50,769 | 25,855 | 90,460 | 4,976 | . | 17,641 | 21.9 | 14,015 |
| M | DOMINICAN REPUBLIC | 2,338 | 3,302 | 2,510 | 4,863 | 3,220 | 1,602 | 5,594 | 4,695 | 5,376 | 8,332 | 2,453 | 3,827 | 9,867 | 1,918 | 264.4 |
| M | UNITED KINGDOM | . | 87.7 | . | . | . | . | . | . | . | . | 263.9 | 1,498 | 369.4 | 9.67 | . |
| M | CANADA | 879.2 | 1,665 | 498.9 | 519.3 | 486.2 | 1,511 | 1,197 | 773.1 | 36.7 | 1,376 | 1,490 | 93.0 | 94.6 | 314.5 | . |
| M | PANAMA | . | . | . | . | . | . | . | . | . | . | . | . | 1,173 | . | . |
| M | LUXEMBOURG | 285.7 | 34.4 | . | . | . | . | . | . | . | . | . | . | 876.3 | . | . |
| M | GERMANY | . | 346.9 | 50.9 | 18.1 | 144.5 | 568.7 | 35.0 | 671.1 | 586.6 | 514.6 | 131.7 | 177.6 | 474.2 | 238.1 | . |
| M | SWITZERLAND | 13.1 | 3,256 | . | 145.6 | 641.3 | 117.6 | 117.6 | . | 217.6 | . | 32.7 | 314.3 | 47.9 | 11.5 | . |
| M | AUSTRALIA | 52.5 | . | 32.0 | . | 98.8 | 176.2 | 17.0 | 36.0 | . | . | . | . | 37.3 | 18.8 | . |
| M | CHINA | 2,116 | 172.3 | 89.5 | 183.0 | . | 2.38 | . | 3.80 | . | . | 31.6 | . | . | 39.6 | . |
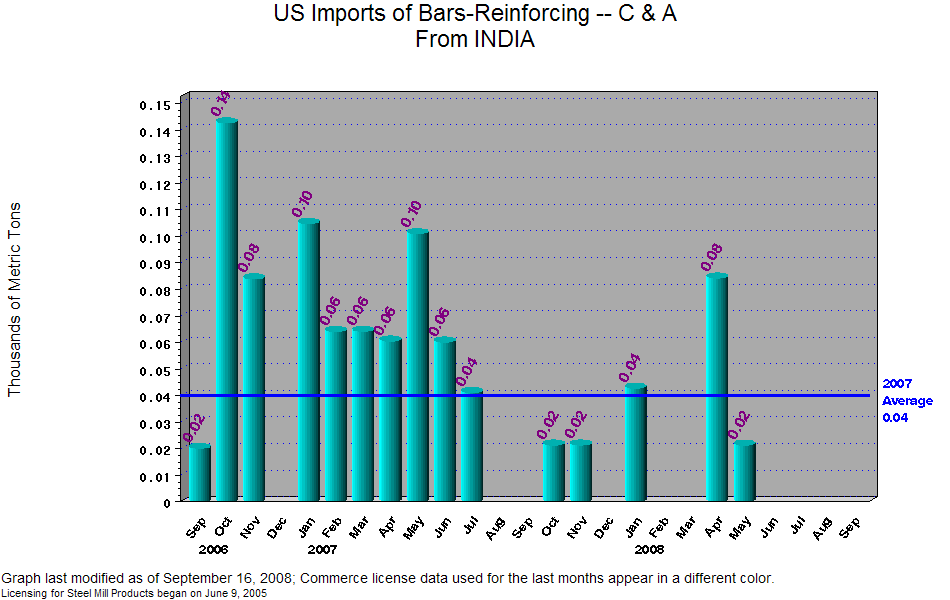
| M | INDIA | 41.1 | . | . | 21.3 | 21.3 | . | 42.7 | . | . | 84.2 | 21.3 | . | . | . | . |
| M | TAIWAN | 89,563 | 40,760 | 18,413 | 1,228 | 1,995 | . | 7.13 | . | 6.66 | . | . | 16.1 | . | 12.2 | . |
| M | BRAZIL | 15,631 | 4,277 | . | 4,176 | . | 1,914 | . | . | . | . | . | 11.9 | . | . | . |
| M | BELGIUM | . | . | . | . | 432.0 | 59.3 | . | . | . | . | . | . | . | . | . |
| M | HAITI | 16.0 | . | . | . | . | . | . | . | . | . | . | . | . | . | . |
| M | HONG KONG | 9,918 | . | . | . | . | . | . | . | . | . | . | . | . | . | . |
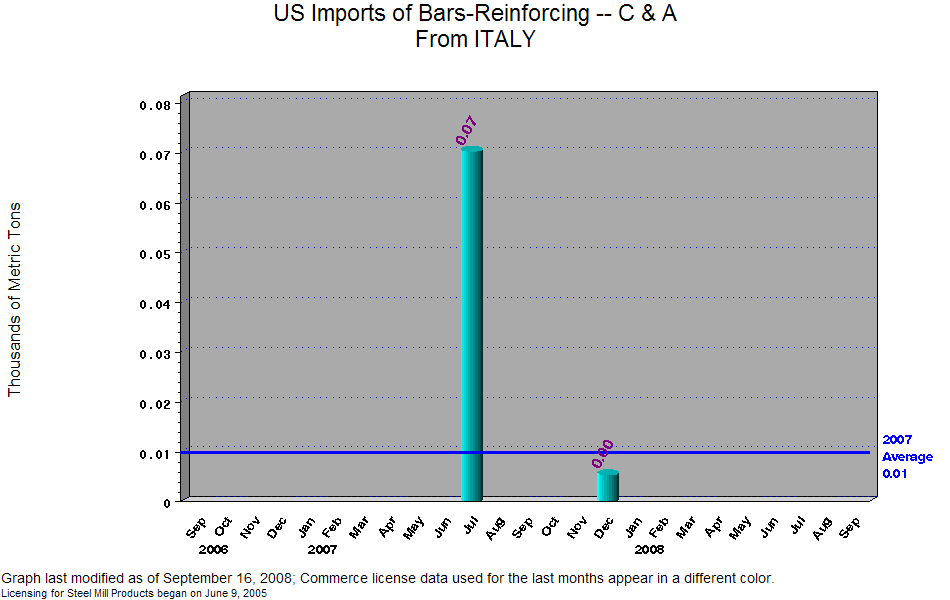
| M | ITALY | 70.3 | . | . | . | . | 5.42 | . | . | . | . | . | . | . | . | . |
| M | MALAYSIA | . | . | 10,227 | 8,087 | . | . | . | . | . | . | . | . | . | . | . |
| M | SINGAPORE | 10,088 | . | . | . | . | . | . | . | . | . | . | . | . | . | . |
| M | SPAIN | . | . | . | 6,097 | . | . | . | . | . | . | . | . | . | . | . |
| M | THAILAND | 18,198 | . | . | . | . | . | . | . | . | . | . | . | . | . | . |
| M | TRINIDAD AND TOBAGO | 12.9 | . | . | 16.0 | . | 1,380 | . | . | . | . | . | . | . | . | . |
| SOURCE: US Department of Commerce, Import Administration |
| Table last modified on: September 11, 2008, with |
| Licensing data collected through September 11, 2008 and |
| Final Census data compiled through July 2008 |
| Data listed in order of descending volume imported during last THREE months of census data,including preliminary data |
| Steel mill categories are defined by 10-digit HTS codes |
| To see License Data at HTS 6-digit level click on chart title at the top of the page. |
| Link to Annual Summary of Census Data |
| Link to Summary Level of Monthly Census Data |