| US Imports of Steel Mill Products | |||
| FOR Plates in Coils -- C & A |
|||
| Average Unit Value in US$ per Metric Ton | |||
| Same Table - Metric Tons |
Same Table - US Dollars |
||
| 'C & A' = Carbon and Alloy products, 'S' = Stainless products | |||
| Graph | Country | Census Data | License Data | |||||||||||||
|---|---|---|---|---|---|---|---|---|---|---|---|---|---|---|---|---|
| JUL07 | AUG07 | SEP07 | OCT07 | NOV07 | DEC07 | JAN08 | FEB08 | MAR08 | APR08 | MAY08 | JUN08 | JUL08 | AUG08 | SEP08 | ||
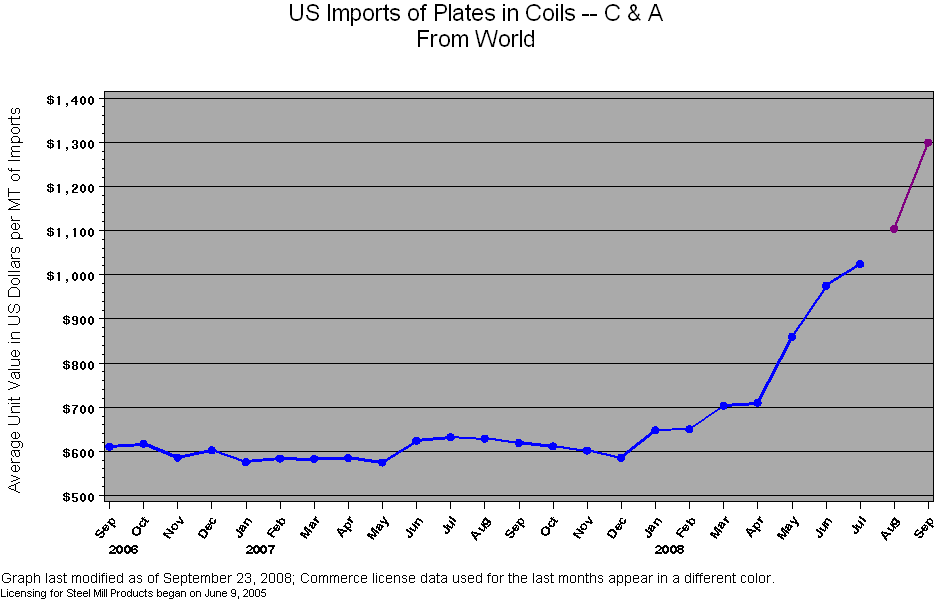
| M | WORLD | $632 | $629 | $619 | $612 | $602 | $586 | $648 | $651 | $704 | $710 | $860 | $975 | $1,024 | $1,104 | $1,336 |
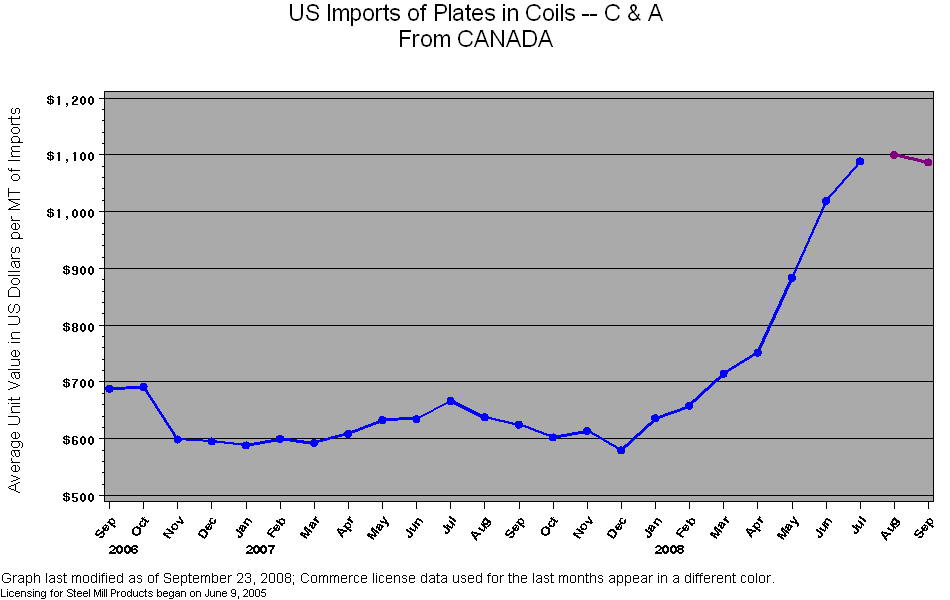
| M | CANADA | $667 | $638 | $625 | $603 | $614 | $580 | $636 | $659 | $715 | $752 | $884 | $1,019 | $1,089 | $1,100 | $1,058 |
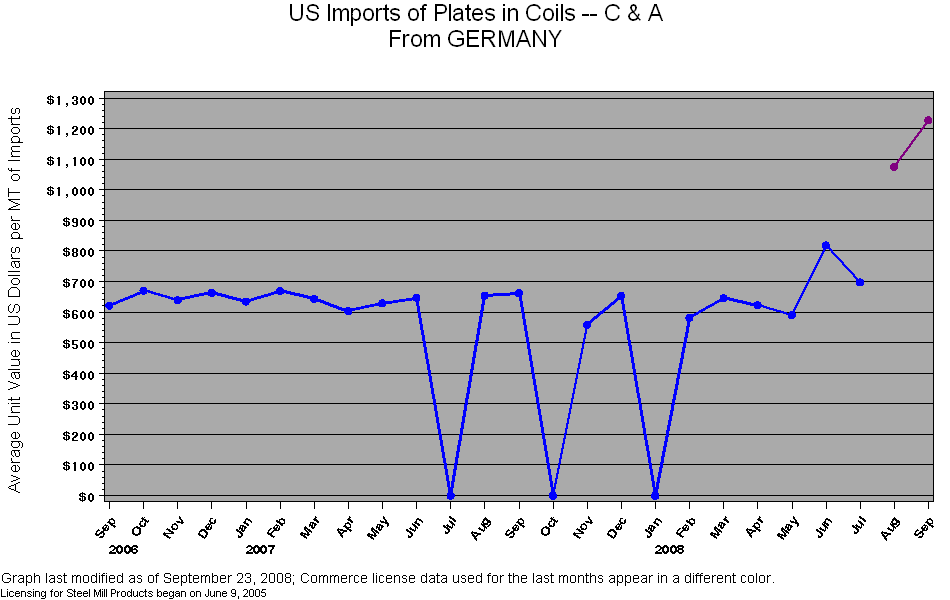
| M | GERMANY | . | $655 | $663 | . | $559 | $653 | . | $582 | $646 | $623 | $591 | $819 | $698 | $1,076 | $3,853 |
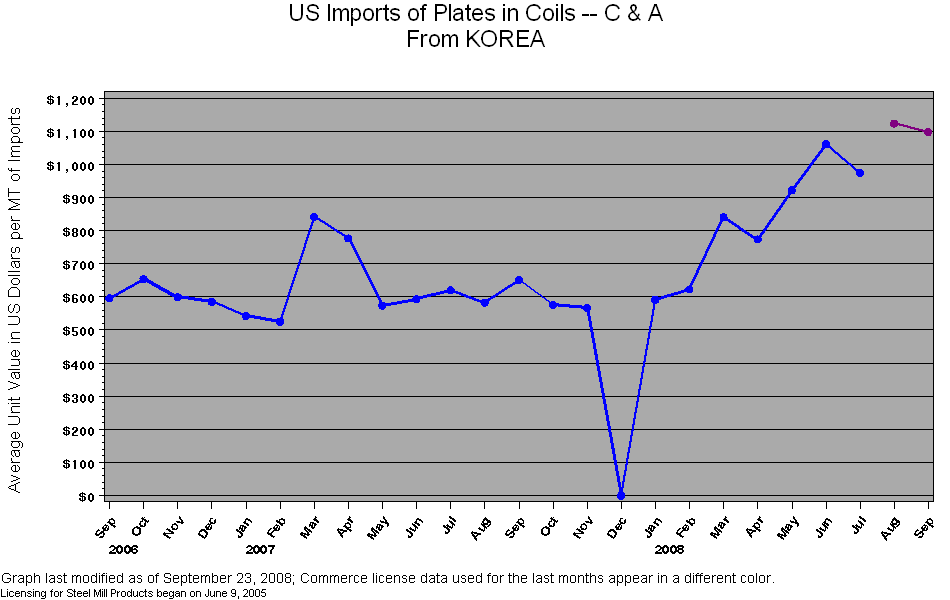
| M | KOREA | $620 | $583 | $651 | $576 | $567 | . | $592 | $623 | $841 | $774 | $922 | $1,062 | $975 | $1,124 | $1,100 |
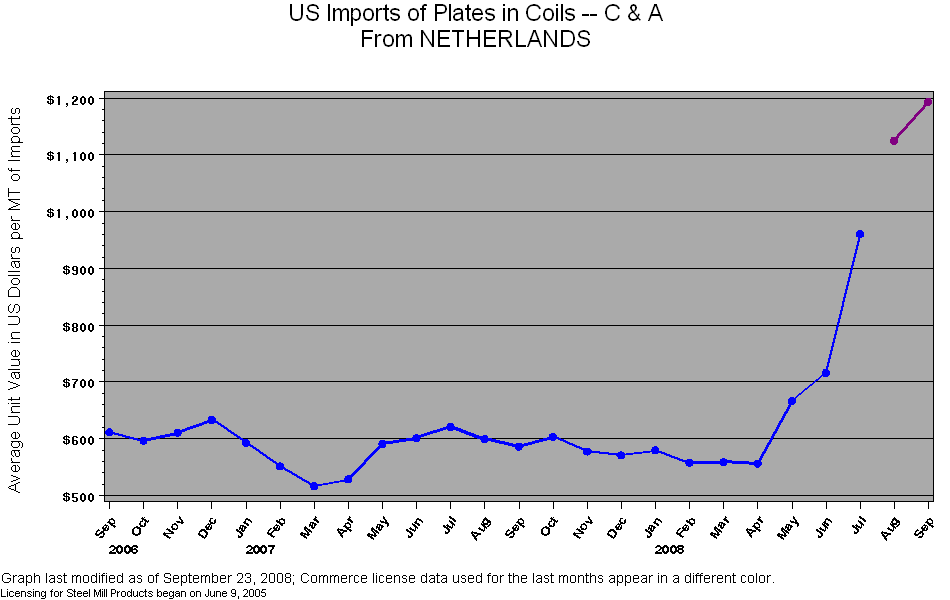
| M | NETHERLANDS | $621 | $600 | $587 | $604 | $578 | $571 | $580 | $558 | $559 | $557 | $667 | $716 | $961 | $1,125 | $1,191 |
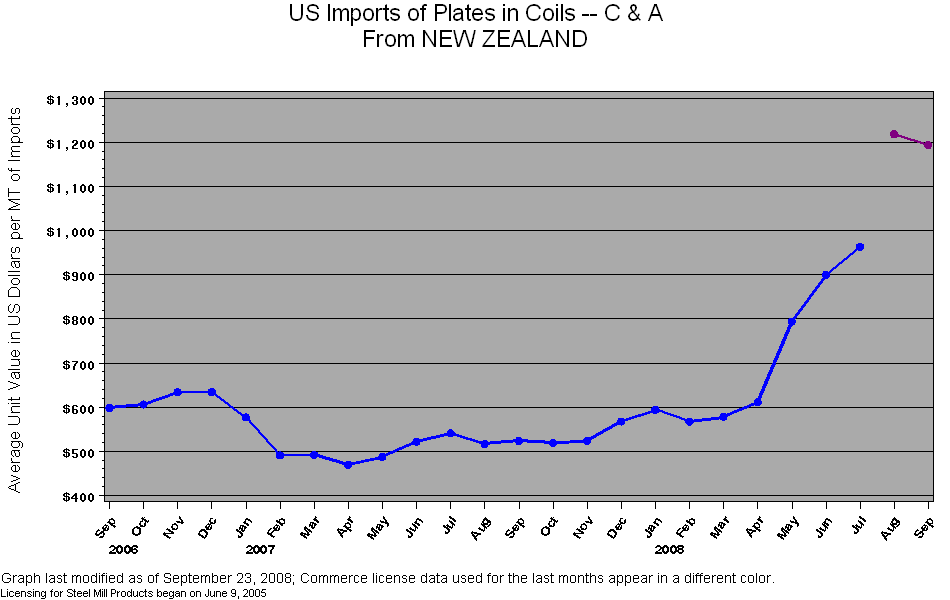
| M | NEW ZEALAND | $541 | $517 | $524 | $519 | $524 | $568 | $595 | $568 | $579 | $611 | $795 | $900 | $964 | $1,219 | $1,189 |
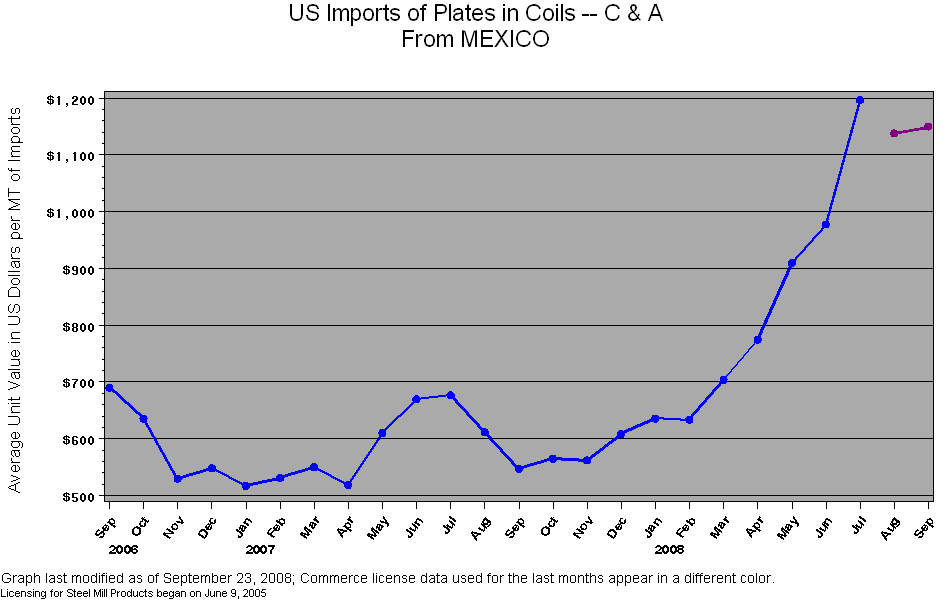
| M | MEXICO | $677 | $612 | $547 | $565 | $562 | $609 | $636 | $634 | $704 | $775 | $910 | $978 | $1,197 | $1,138 | $1,134 |
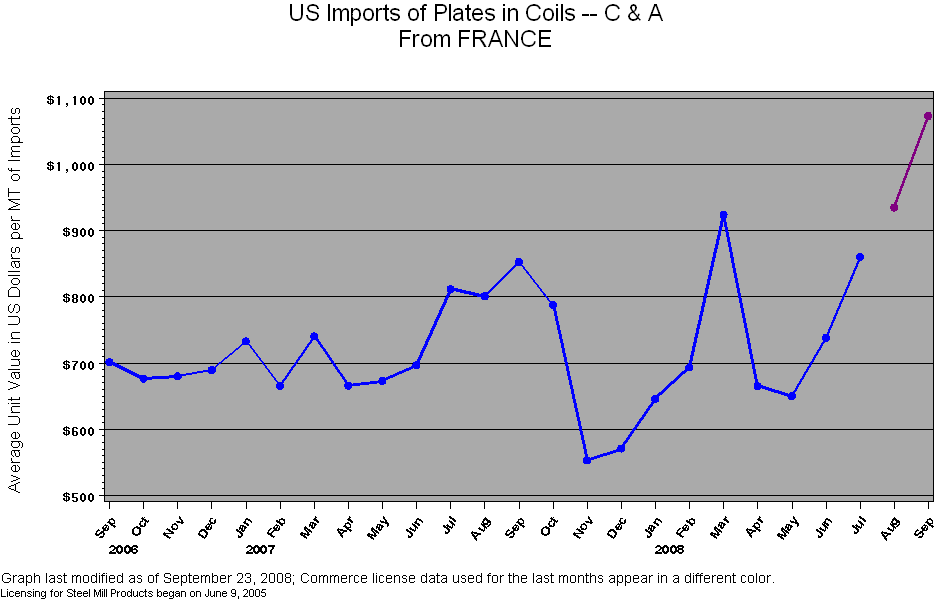
| M | FRANCE | $812 | $801 | $853 | $788 | $553 | $571 | $646 | $694 | $924 | $666 | $650 | $738 | $861 | $935 | . |
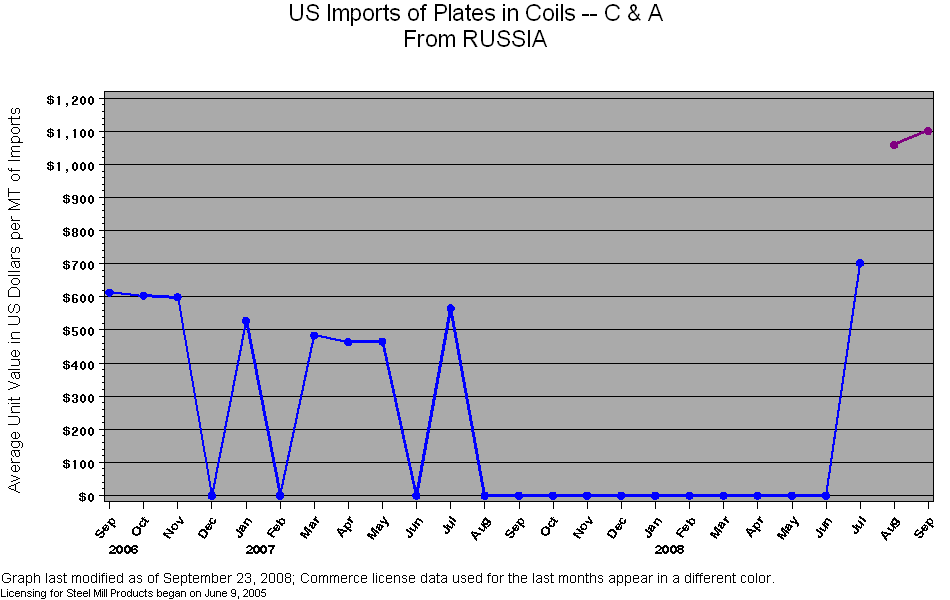
| M | RUSSIA | $566 | . | . | . | . | . | . | . | . | . | . | . | $702 | $1,059 | $1,101 |
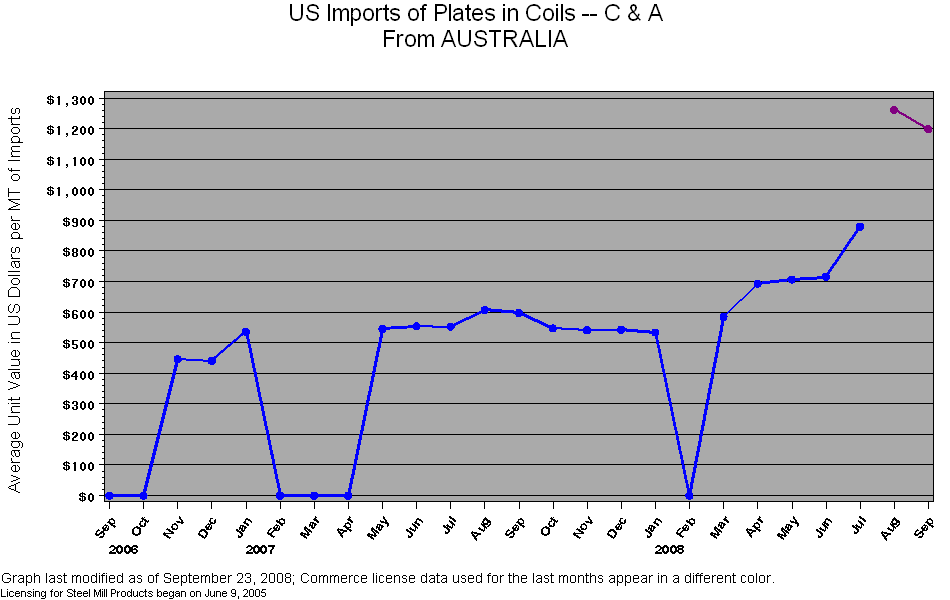
| M | AUSTRALIA | $553 | $607 | $598 | $547 | $541 | $543 | $534 | . | $585 | $694 | $707 | $716 | $880 | $1,262 | $1,199 |
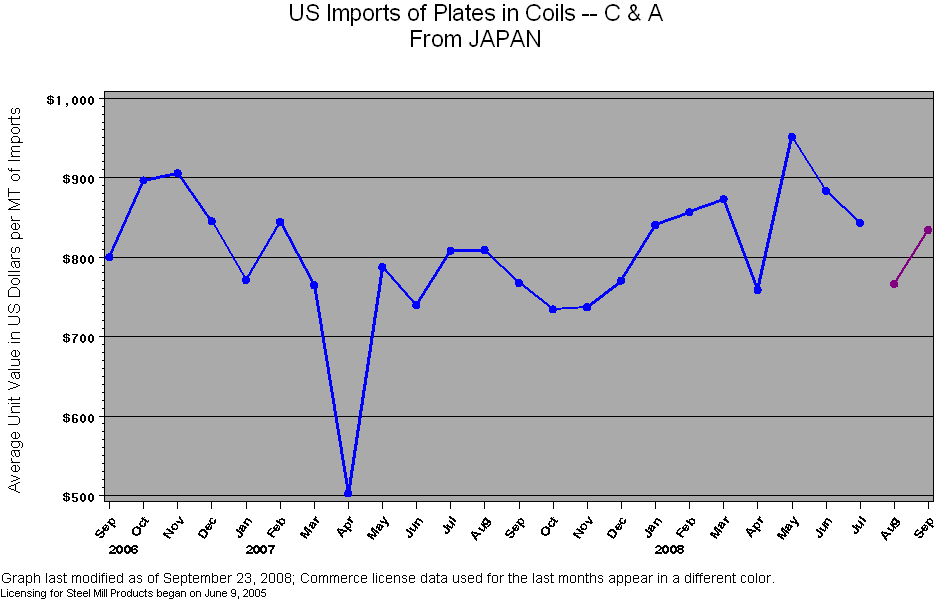
| M | JAPAN | $808 | $809 | $768 | $734 | $737 | $771 | $841 | $857 | $873 | $759 | $952 | $884 | $843 | $766 | $834 |
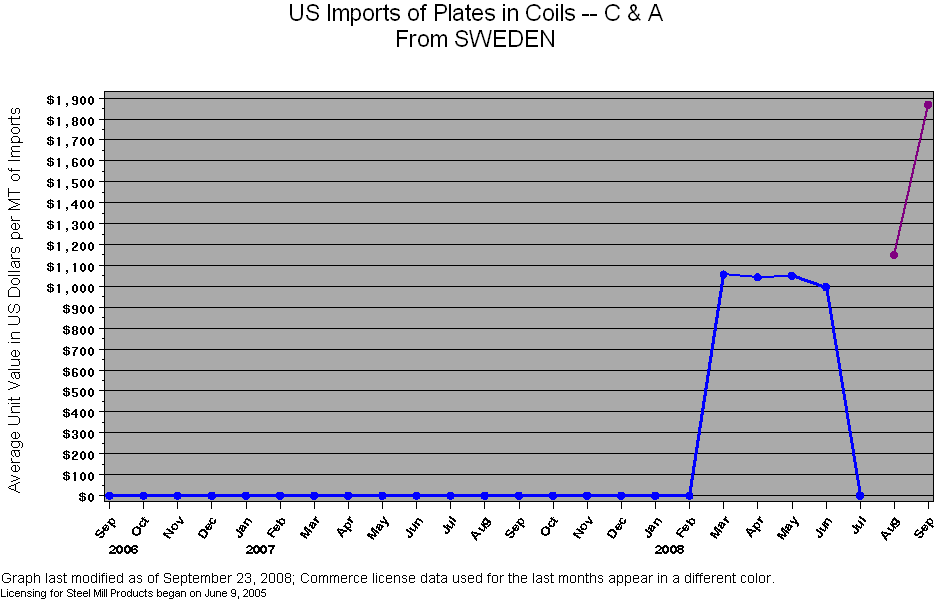
| M | SWEDEN | . | . | . | . | . | . | . | . | $1,058 | $1,044 | $1,051 | $998 | . | $1,151 | . |
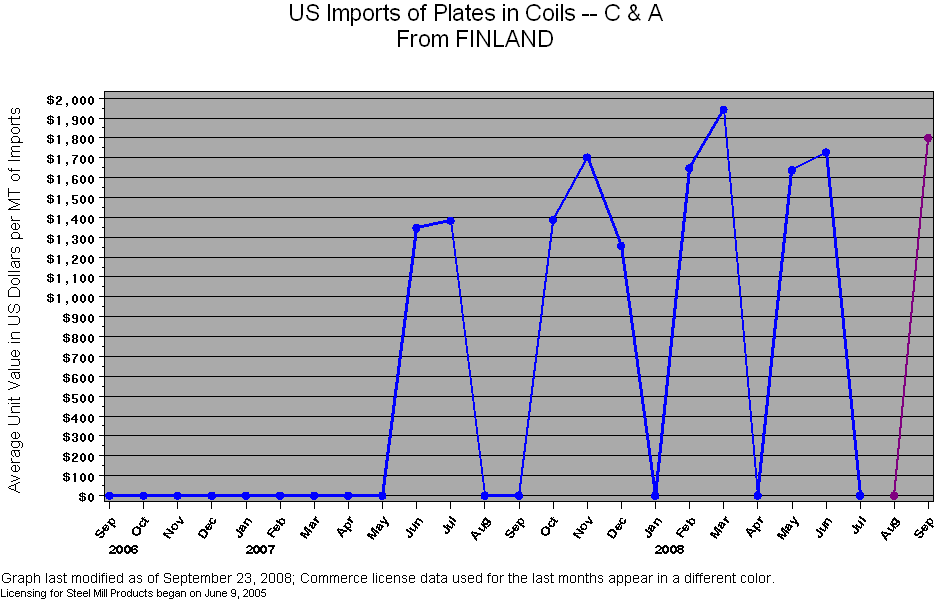
| M | FINLAND | $1,384 | . | . | $1,388 | $1,703 | $1,257 | . | $1,648 | $1,943 | . | $1,638 | $1,729 | . | . | $1,803 |
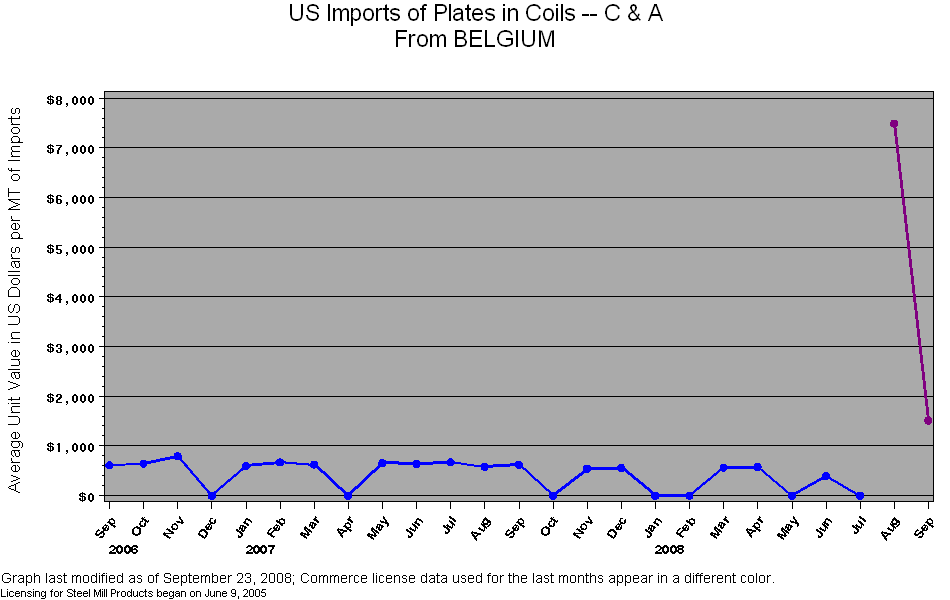
| M | BELGIUM | $672 | $580 | $622 | . | $543 | $559 | . | . | $567 | $577 | . | $394 | . | $7,492 | $1,513 |
| M | UNITED KINGDOM | . | $1,227 | $1,406 | $493 | $1,232 | . | . | . | $1,446 | $1,450 | $1,462 | $1,461 | $1,446 | $7,500 | . |
| M | TURKEY | . | . | . | . | . | . | . | . | . | . | $661 | . | . | . | $1,555 |
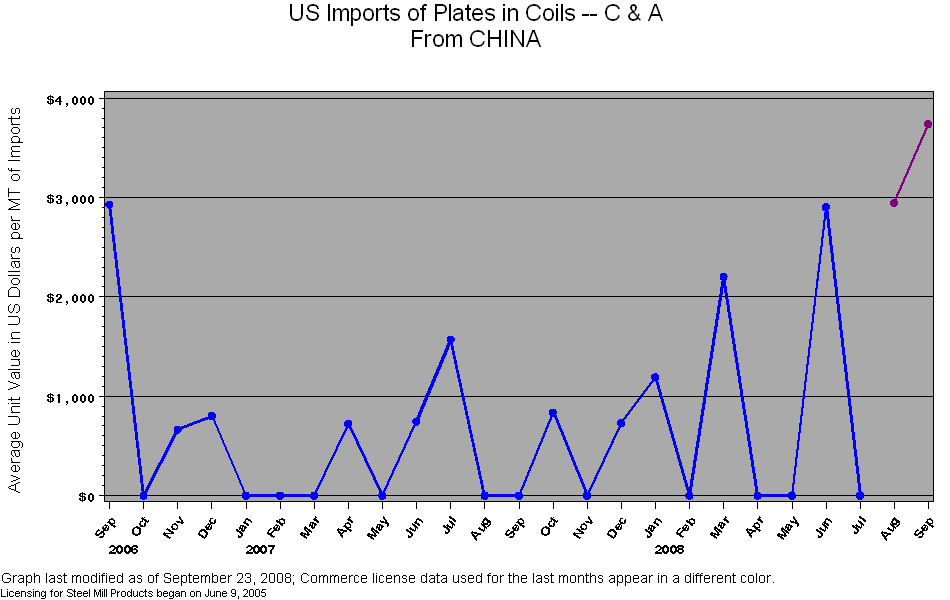
| M | CHINA | $1,572 | . | . | $837 | . | $731 | $1,192 | . | $2,203 | . | . | $2,904 | . | $2,947 | $3,741 |
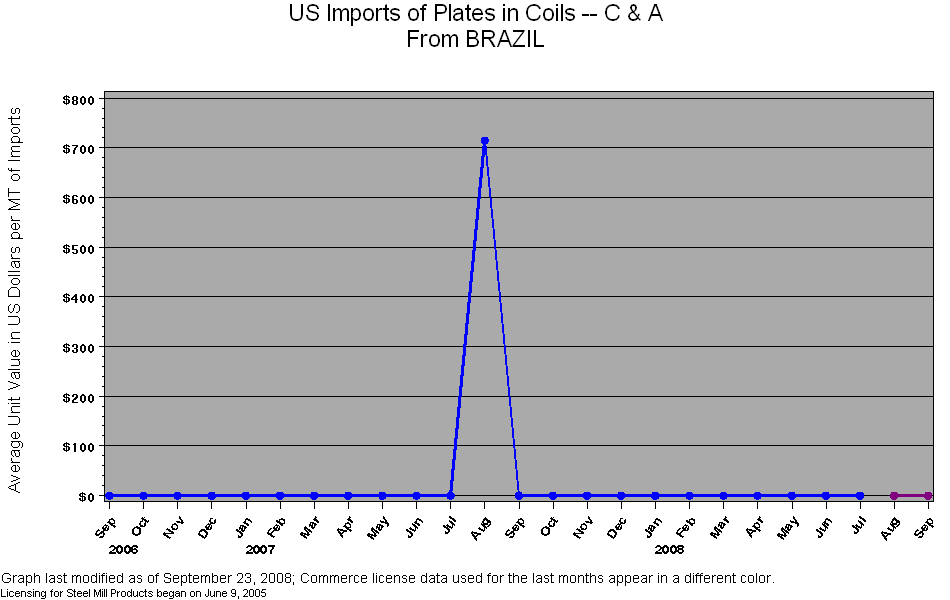
| M | BRAZIL | . | $715 | . | . | . | . | . | . | . | . | . | . | . | . | . |
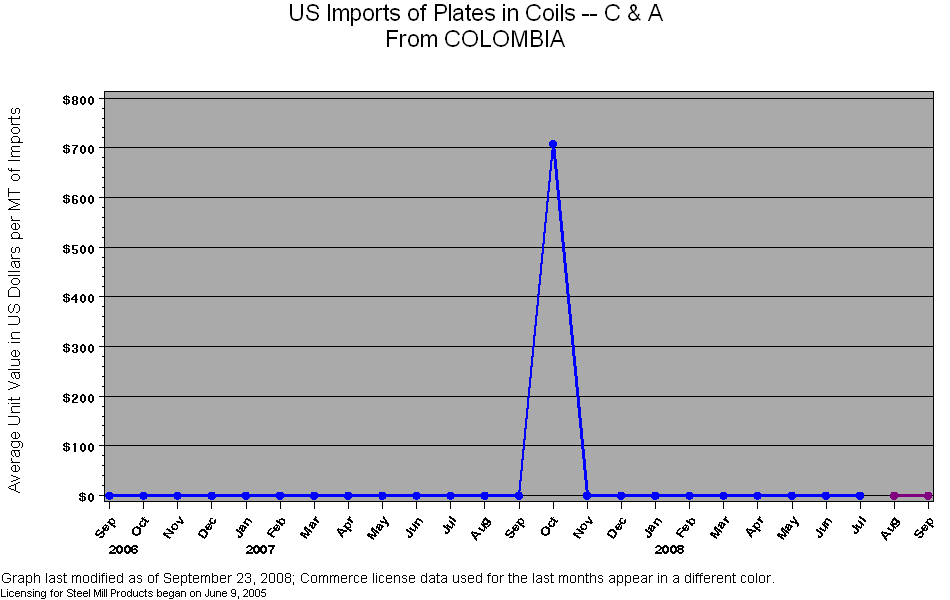
| M | COLOMBIA | . | . | . | $708 | . | . | . | . | . | . | . | . | . | . | . |
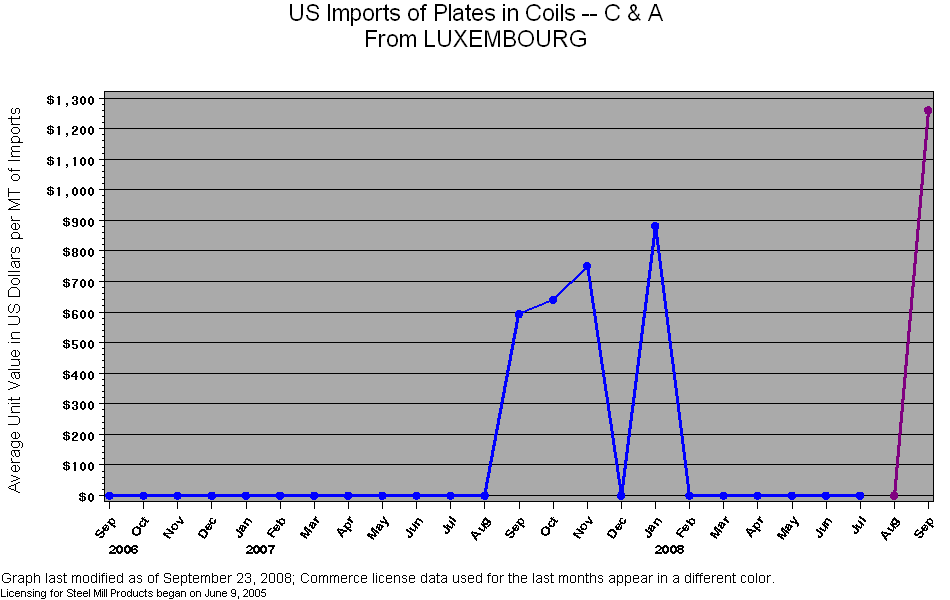
| M | LUXEMBOURG | . | . | $594 | $640 | $751 | . | $882 | . | . | . | . | . | . | . | $1,261 |
| M | MALAYSIA | . | . | . | . | . | . | . | . | . | . | . | . | . | . | $890 |
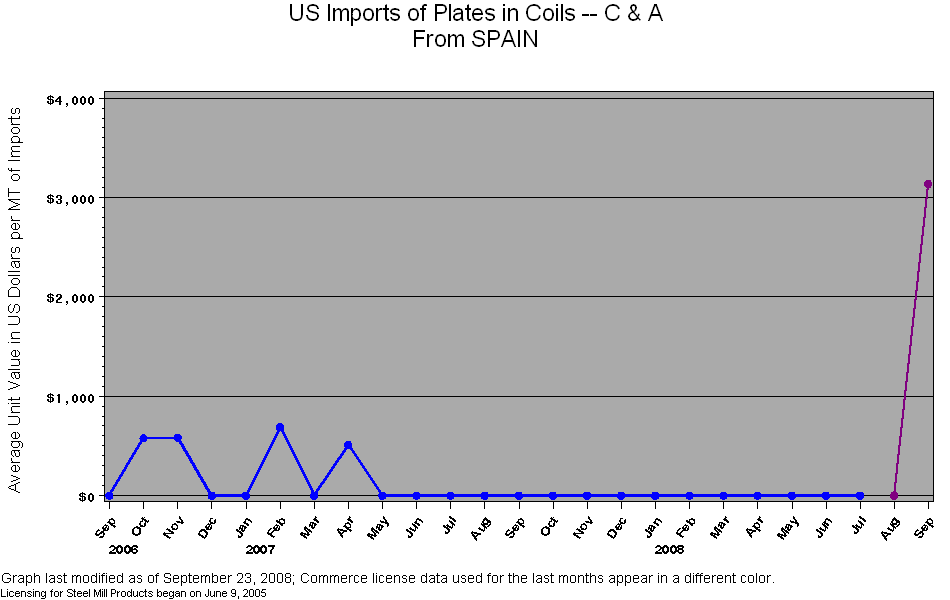
| M | SPAIN | . | . | . | . | . | . | . | . | . | . | . | . | . | . | $3,138 |
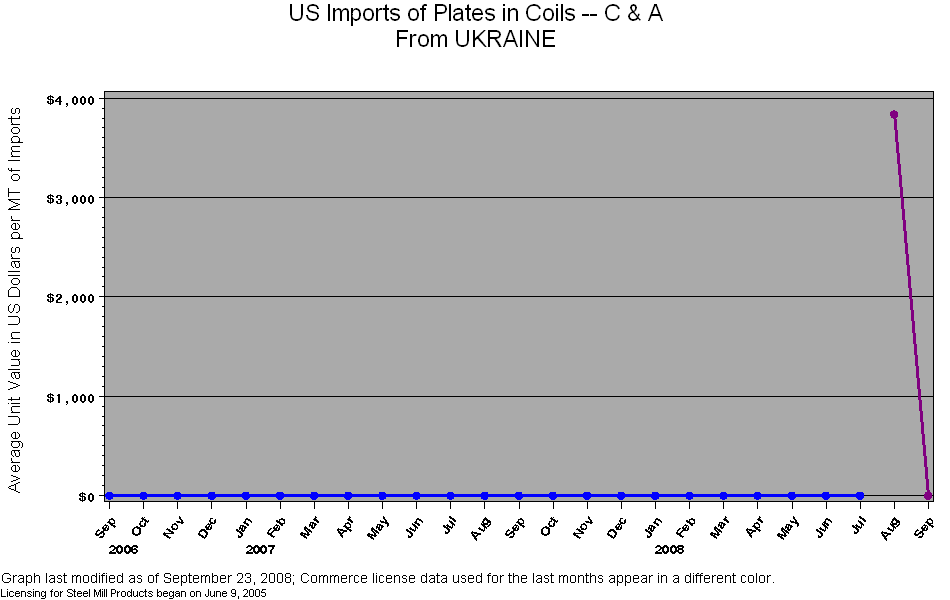
| M | UKRAINE | . | . | . | . | . | . | . | . | . | . | . | . | . | $3,840 | . |
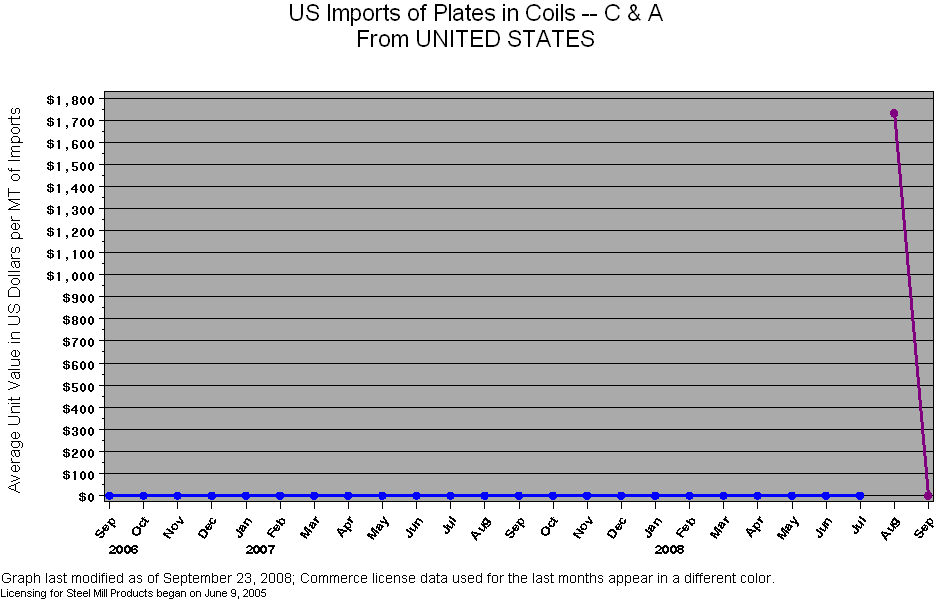
| M | UNITED STATES | . | . | . | . | . | . | . | . | . | . | . | . | . | $1,733 | . |
| SOURCE: US Department of Commerce, Import Administration |
| Table last modified on: September 16, 2008, with |
| Licensing data collected through September 16, 2008 and |
| Final Census data compiled through July 2008 |
| Data listed in order of descending volume imported during last THREE months of census data,including preliminary data |
| Steel mill categories are defined by 10-digit HTS codes |
| To see License Data at HTS 6-digit level click on chart title at the top of the page. |
| Link to Annual Summary of Census Data |
| Link to Summary Level of Monthly Census Data |