

|
FOR FURTHER INFORMATION: |
FOR RELEASE: |
|
CONSUMER PRICE INDEX FOR ST. LOUIS, MO-IL
Prices increase 3.2 percent from the first half of 2007 to the first half of 2008
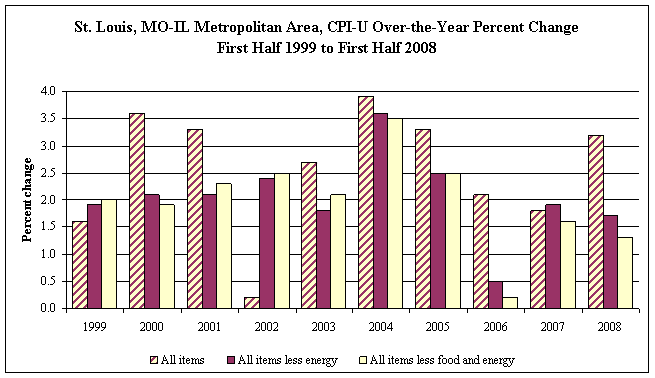
The Consumer Price Index for All Urban Consumers (CPI-U) for the St. Louis metropolitan area increased 3.2 percent from the first half of 2007 to the first half of 2008, the Bureau of Labor Statistics reported today. According to Regional Commissioner Stanley W. Suchman, rising prices for energy largely attributable to rising gasoline prices accounted for nearly one-half of the increase in the overall index. Energy prices, which include prices for motor fuel and household fuels, advanced 17.1 percent over the year. Excluding the impact of energy, the CPI for St. Louis rose 1.7 percent.
Among the eight major expenditure categories, rising prices for transportation had the largest impact on the overall index, reflecting higher motor fuel costs. Transportation prices rose 7.3 percent over the year driven by a 30.8 percent surge in motor fuel costs. Private transportation costs, which include prices for vehicles and motor fuel, were up 7.5 percent from the first half of 2007 to the first half of 2008.
Housing costs had the second largest effect on the overall index, increasing 1.5 percent due largely to a 1.8 percent rise in shelter costs. Within shelter, rent of primary residence increased 1.8 percent and owners' equivalent rent of primary residence rose 1.4 percent. Electricity prices were virtually unchanged after rising 6.4 percent in the same period one year ago. In contrast, charges for utility (piped) gas service were down 1.0 percent over the year. Prices for household furnishings and operations were up 0.6 percent.
Prices for food and beverages also contributed upward pressure on the all items index, as costs rose 3.7 percent from the first half of 2007 to the first half of 2008. Prices for food at home were up 4.3 percent and prices for food away from home increased 2.5 percent. Alcoholic beverages prices were 3.3 percent higher.
The index for education and communication rose 5.2 percent from the first half of 2007 to the first half of 2008, the second largest increase since semiannual reporting began in 1999. Over the same period, increases in the prior three years ranged from 1.0 percent to 2.3 percent.
Combined, the four remaining major groups accounted for less than one-eighth of the increase in the overall index. Recreation prices, which include admissions to movies, concerts, and sporting events, rose 3.1 percent from the first half of 2007 to the first half of 2008. Prices for other goods and services, which include tobacco and smoking products and personal care items, increased 3.9 percent since the first half of 2007 and the apparel index was up 1.7 percent. Medical care costs were 0.5 percent lower over the year after increasing more than 3 percent during the same period in each of the previous four years.
The St. Louis CPI-U stood at 198.278 for the first half of 2008. This means that a market basket of goods and services that cost $100.00 in 1982-84 cost $198.28 in the first half of 2008. Because metropolitan area CPI data are not adjusted for seasonal price variation, consumers and businesses should be cautious in drawing conclusions about long-term retail price trends from short-term changes in the metropolitan area indexes.
___________________________________________________________________________
Information in this release will be made available to sensory impaired individuals upon request.
Voice phone: 202-691-5200; TDD message referral phone number (Federal Relay Service):
1-800-877-8339.
___________________________________________________________________________
  Consumer Price Index for All Urban Consumers (CPI-U): Indexes for semiannual averages and percent changes
  for selected periods

  St. Louis, MO-IL  (1982-84=100 unless otherwise noted)


                                                     Semiannual average indexes        Percent change to
                                                                                      1st half 2008 from-
                 Item and Group
                                                  1st half    2nd half    1st half
                                                    2007        2007        2008      1st half    2nd half
                                                                                        2007        2007


              Expenditure category

  All items....................................    192.125     194.338     198.278         3.2         2.0
  All items (1967=100).........................    570.642     577.214     588.919           -           -

   Food and beverages..........................    194.464     197.064     201.675         3.7         2.3
    Food.......................................    193.009     195.671     200.189         3.7         2.3
     Food at home..............................    185.218     187.230     193.191         4.3         3.2
     Food away from home.......................    207.037     210.777     212.115         2.5          .6
    Alcoholic beverages........................    198.153     199.926     204.759         3.3         2.4

   Housing.....................................    184.323     185.961     187.115         1.5          .6
    Shelter....................................    208.193     209.558     211.913         1.8         1.1
     Rent of primary residence.................    186.814     189.558     190.131         1.8          .3
     Owners' equivalent rent of primary
         residence (1) ........................    215.722     216.290     218.842         1.4         1.2
    Fuels and utilities........................    175.060     182.620     176.550          .9        -3.3
     Household energy..........................    160.785     175.864     161.667          .5        -8.1
      Gas (piped) and electricity..............    164.134     179.640     163.438         -.4        -9.0
       Electricity.............................    128.369     149.336     128.511          .1       -13.9
       Utility (piped) gas service.............    204.489     206.334     202.514        -1.0        -1.9
    Household furnishings and operations.......    134.903     133.281     135.694          .6         1.8

   Apparel.....................................    123.821     125.583     125.935         1.7          .3

   Transportation..............................    176.631     180.346     189.492         7.3         5.1
    Private transportation.....................    177.436     181.261     190.663         7.5         5.2
     Motor fuel................................    241.060     261.217     315.425        30.8        20.8
      Gasoline (all types).....................    237.204     257.046     310.825        31.0        20.9
       Gasoline, unleaded regular (2)..........    231.553     249.524     302.708        30.7        21.3
       Gasoline, unleaded midgrade (2) (3).....    272.231     297.469     357.775        31.4        20.3
       Gasoline, unleaded premium (2)..........    227.885     252.169     301.686        32.4        19.6

   Medical care................................    344.824     342.893     343.086         -.5          .1

   Recreation (4)..............................    119.257     119.138     122.946         3.1         3.2

   Education and communication (4).............    122.171     125.765     128.582         5.2         2.2

   Other goods and services....................    260.852     260.630     271.104         3.9         4.0

           Commodity and service group

  All items....................................    192.125     194.338     198.278         3.2         2.0
   Commodities.................................    165.968     167.959     173.994         4.8         3.6
    Commodities less food and beverages........    149.701     151.382     157.897         5.5         4.3
     Nondurables less food and beverages.......    185.656     190.782     208.914        12.5         9.5
     Durables..................................    115.661     114.599     111.790        -3.3        -2.5
   Services....................................    219.928     222.383     224.312         2.0          .9

            Special aggregate indexes

  All items less medical care..................    184.501     186.855     190.900         3.5         2.2
  All items less shelter.......................    188.303     190.882     195.498         3.8         2.4
  Commodities less food........................    151.980     153.669     160.147         5.4         4.2
  Nondurables..................................    190.366     194.236     205.718         8.1         5.9
  Nondurables less food........................    187.045     191.918     209.009        11.7         8.9
  Services less rent of shelter (1) ...........    237.630     241.441     243.011         2.3          .7
  Services less medical care services..........    208.222     211.038     212.984         2.3          .9
  Energy.......................................    195.436     212.682     228.763        17.1         7.6
  All items less energy........................    194.316     195.627     197.646         1.7         1.0
   All items less food and energy..............    194.906     195.963     197.529         1.3          .8

    1 Index is on a November 1982=100 base.
    2 Special index based on a substantially smaller sample.
    3 Indexes on a December 1993=100 base.
    4 Indexes on a December 1997=100 base.
    - Data not available.
  NOTE: Index applies to a month as a whole, not to any specific date.
  Consumer Price Index for Urban Wage Earners and Clerical Workers (CPI-W):Indexes for semiannual averages
  and percent changes for selected periods

  St. Louis, MO-IL  (1982-84=100 unless otherwise noted)


                                                     Semiannual average indexes        Percent change to
                                                                                      1st half 2008 from-
                 Item and Group
                                                  1st half    2nd half    1st half
                                                    2007        2007        2008      1st half    2nd half
                                                                                        2007        2007

              Expenditure category

  All items....................................    190.919     193.393     197.848         3.6         2.3
  All items (1967=100).........................    561.693     568.973     582.079           -           -

   Food and beverages..........................    194.530     197.422     202.211         3.9         2.4
    Food.......................................    193.791     196.658     201.427         3.9         2.4
     Food at home..............................    185.487     187.496     193.360         4.2         3.1
     Food away from home.......................    207.684     211.483     213.080         2.6          .8
    Alcoholic beverages........................    187.890     190.955     194.618         3.6         1.9

   Housing.....................................    186.825     188.574     188.886         1.1          .2
    Shelter....................................    208.133     209.265     211.641         1.7         1.1
     Rent of primary residence.................    186.814     189.558     190.131         1.8          .3
     Owners' equivalent rent of primary
         residence  (1)........................    197.632     198.152     200.491         1.4         1.2
    Fuels and utilities........................    177.957     185.728     179.468          .8        -3.4
     Household energy..........................    161.982     177.410     162.635          .4        -8.3
      Gas (piped) and electricity..............    165.719     181.460     164.978         -.4        -9.1
       Electricity.............................    128.369     149.334     128.510          .1       -13.9
       Utility (piped) gas service.............    204.490     206.335     202.514        -1.0        -1.9
    Household furnishings and operations.......    132.219     130.042     129.677        -1.9         -.3

   Apparel.....................................    123.765     125.929     127.014         2.6          .9

   Transportation..............................    179.553     183.362     194.208         8.2         5.9
    Private transportation.....................    179.067     182.921     193.931         8.3         6.0
     Motor fuel................................    241.045     261.202     315.426        30.9        20.8
      Gasoline (all types).....................    237.204     257.047     310.826        31.0        20.9
       Gasoline, unleaded regular (2)..........    231.542     249.512     302.693        30.7        21.3
       Gasoline, unleaded midgrade (2) (3).....    272.231     297.469     357.775        31.4        20.3
       Gasoline, unleaded premium (2)..........    227.895     252.181     301.700        32.4        19.6

   Medical care................................    343.641     342.482     342.151         -.4         -.1

   Recreation (4)..............................    120.920     120.762     124.897         3.3         3.4

   Education and communication (4).............    119.223     122.789     125.230         5.0         2.0

   Other goods and services....................    259.408     259.208     269.651         3.9         4.0

           Commodity and service group

  All items....................................    190.919     193.393     197.848         3.6         2.3
   Commodities.................................    169.312     171.595     178.420         5.4         4.0
    Commodities less food and beverages........    154.678     156.655     164.173         6.1         4.8
     Nondurables less food and beverages.......    186.592     192.048     212.871        14.1        10.8
     Durables..................................    122.137     121.559     117.938        -3.4        -3.0
   Services....................................    217.846     220.554     222.343         2.1          .8

            Special aggregate indexes

  All items less medical care..................    184.529     187.095     191.634         3.9         2.4
  All items less shelter.......................    186.651     189.505     194.803         4.4         2.8
  Commodities less food........................    156.387     158.399     165.836         6.0         4.7
  Nondurables..................................    190.582     194.761     207.927         9.1         6.8
  Nondurables less food........................    187.028     192.374     212.091        13.4        10.2
  Services less rent of shelter  (1)...........    218.195     222.204     223.639         2.5          .6
  Services less medical care services..........    206.613     209.614     211.420         2.3          .9
  Energy.......................................    196.165     213.545     230.764        17.6         8.1
  All items less energy........................    192.241     193.653     195.575         1.7         1.0
   All items less food and energy..............    191.770     192.854     194.209         1.3          .7

    1 Index is on a November 1984=100 base.
    2 Special index based on a substantially smaller sample.
    3 Indexes on a December 1993=100 base.
    4 Indexes on a December 1997=100 base.
    - Data not available.
  NOTE: Index applies to a month as a whole, not to any specific date.
Last Modified Date: August 14, 2008