By Nicole S. Stoops
Jump to: Intro | Tables | Graphs | Sources
Information on educational attainment of the U.S. population has been collected in every decennial census since 1940. In 1940, educational attainment was collected for every person enumerated in the census (i.e., 100% data) and on a sample basis thereafter. At the national level, this report includes tables that show rates of educational attainment by age, sex, race, and Hispanic origin. At the regional and state levels, educational attainment data are shown by sex, race, and Hispanic origin. The tables show two attainment levels: the percent of the population 25 years and over with a high school diploma or more education and the percent with a bachelor’s degree or more.
Data are shown at the national, regional, and state levels from 1940 to 2000. Data for Alaska and Hawaii are shown from 1960 to 2000.
From 1940 to 1980, respondents were asked to report their highest grade or year of school completed. While the questionnaires themselves varied slightly, all of them asked a question that was based on the highest grade of school the respondent had completed. For example:
The answer categories all included the following:
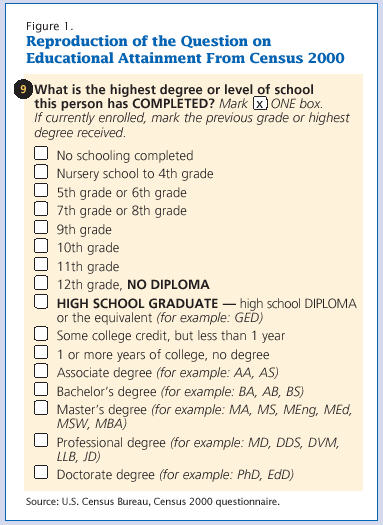
As society became more educated and credential oriented, the Census Bureau changed the educational attainment question in 1990 in order to capture degree completion more accurately by asking respondents to report their highest level of school completed or their highest degree received. The response categories include specific degrees, such as “High school graduate” and “Bachelor’s degree.” (See reproduction of the Census 2000 educational attainment question below.) For a more detailed discussion of the change in the educational attainment question, see Kominski 1992.
The chart below shows how the Census Bureau determined who was considered a high school graduate and a college graduate based on the two different forms of the educational attainment question:
|
|
High school graduates |
College graduates |
|
1940 to 1980 |
Respondents who reported completing 4 years of high school or more years of education |
Respondents who reported completing 4 years of college or more years of education |
|
1990 and 2000 |
Respondents who reported themselves as a high school graduate or as completing a high school diploma or its equivalent (e.g., GED) or more education |
Respondents who reported themselves as completing a bachelor’s degree or more education |
Whenever possible, we have excluded those who did not report their educational attainment from the base of the calculated percentages. In 1960, the number of people who did not report their educational attainment was not shown in the census tabulations, so they could not be excluded from the bases of the percentages. This will decrease the calculated percentages somewhat.
The collection and presentation of race and Hispanic origin data varied from census to census. For a comprehensive discussion of racial categories in the decennial census and of changes in these categories over the past two centuries, see Bennett, 2000b and 2000c. For a concise overview of the changes in the collection of race and Hispanic origin in the decennial censuses of the United States, see Gibson and Jung 2002.
In order to present the most consistent data over time, White and Black are the only races shown below the national level in this table package. In 1950 and 1960, detailed race data were only available at the national level from special reports on the Nonwhite population. At the state level in 1950 and 1960, the only race categories shown for educational attainment in the original census volumes are White and Nonwhite. Data by race by sex were not available for every state in 1950 due to insufficient size of the Nonwhite population.
We have presented attainment levels for the Black population in 1950 and 1960 based on the Nonwhite population numbers in states where at least 75 percent of the Nonwhite population was Black in 1970. For the sake of consistency, the attainment data presented for these states in 1940 is also based on the Nonwhite population. In states where the Black population comprised less than 75 percent of the Nonwhite population in 1970, no race data are shown prior to 1970 for lack of a consistent data series.
One of the most significant changes to the racial classifications in the decennial census was the addition of the option to choose more than one race in Census 2000. Also in 2000, American Indians and Alaska Natives were combined into one category and the Asian and Pacific Islander category was split into two groups. As a result of these changes, race data prior to 2000 are not directly comparable to 2000 data. For the purposes of this analysis, the data shown in 2000 are for those respondents who chose only one race. For example, the term ‘Black’ in 2000 refers to those respondents who chose a single race of Black or African American. The 2.4 percent of people who specified more than one race in 2000 are included in the ‘Other races’ category.
Collection of data on Hispanic origin has also changed over time in the decennial census. The first attempt at collecting data on Hispanic origin from the decennial census was in 1970. However, the data were collected using several different methods and sample sizes. The first year Hispanic origin data were collected on a 100% basis was 1980, so Hispanic origin is shown in this table package from 1980 to 2000.
This report was prepared in the Population Division of the U.S. Census Bureau. Jennifer Day, Assistant Division Chief of Labor Force Statistics and Outreach, provided a great deal of guidance in the development of this report. Population Division Demographic Reviewer, Campbell Gibson, provided valuable advice regarding the collection of historical data from past censuses. Kurt Bauman, Chief of the Education and Social Stratification Branch, and Gregg Robinson also provided useful comments and advice. Tim Fitzgerald of the Decennial Programs branch thoughtfully and carefully reviewed the report.
The following Census Bureau staff and interns aided in the collection, verification, and presentation of the data contained in this report: Andrea Curry, Cecily Darden, Jessica Davis, Amie Jamieson, James Noon, and Claire Shook-Finucane. Marie Pees, Chief of the Census Activities and Tabulation Staff, provided tabulations of data, which made the data collection work much easier. The following analysts from the Education and Social Stratification Branch reviewed the state-level graphs and provided useful comments: Jessica Davis, Kelly Holder, Camille Ryan, and Hyon Shin.