

FOR FURTHER INFORMATION: FOR RELEASE:
Cheryl Abbot March 18, 2008
(214) 767-6970
CONSUMER SPENDING PATTERNS IN
HOUSTON-GALVESTON-BRAZORIA, 2005-2006
Consumer units(1) in the Houston-Galveston-Brazoria, Texas metropolitan
area spent an average of $56,260 per year in 2005-2006, according to results
from the Bureau of Labor Statistics’ Consumer Expenditure Survey. Regional
Commissioner Stanley W. Suchman noted that this figure was 18.6 percent
higher than the U.S. average household expenditure of $47,421 during the same
period. Although local households spent more than the national average, they
tended to allocate their dollars similarly among the major categories,
differing significantly in only 6 of the 14 categories. (See table 1).
Transportation accounted for a significantly larger(2) portion of average
expenditures in the Houston area compared to the United States, whereas
spending on housing, food, and entertainment represented significantly
smaller-than-average shares of local expenditures. (See Chart A.)
Chart A. Percent distribution of total average expenditures for selected
categories, United States and Houston metropolitan area, Consumer Expenditure
Survey, 2005-2006
 This report contains annual data averaged over a two-year period, 2005
and 2006. The data are from the Consumer Expenditure Survey (CE), which is
collected on an ongoing basis by the U.S. Census Bureau for the Bureau of
Labor Statistics (BLS). The Consumer Expenditure Survey is the only national
survey that provides both complete data on household expenditures and the
demographic characteristics of those households. CE data are available for
the nation, the 4 geographic regions of the country, and 18 metropolitan
areas. Survey data cannot be used to make cost of living comparisons between
areas. Expenditures vary among areas not only because of economic factors
such as the prices of goods and services and family income, but also because
of differences such as the age of the population, climate, consumer tastes,
family size, etc. However, expenditure shares, or the percentage of a
consumer unit’s budget spent on a particular category, can be used to compare
spending patterns across areas. The survey provides average expenditures for
consumer units. An individual consumer unit may spend more or less than the
average, depending on its particular characteristics.
Though data for 18 metropolitan areas were available for the 2005-06
period, 3 in particular—Dallas, Miami, and Atlanta—were selected for
comparison with Houston, as they are all located in the South and had
populations that were similar in size.
Housing, the largest expenditure category, accounted for 30.6 percent of
a Houston area household’s total budget; this share was significantly lower
than the 33.3-percent national average. (See table 1.) Miami (37.6 percent)
and Atlanta (37.0 percent) had housing shares that were measurably above the
U.S. average, while the share in Dallas (33.5 percent) was not significantly
different. (See chart 1.)
The rate of homeownership in Houston, 70 percent, was higher than the
national average of 67 percent. Atlanta (69 percent) also had a higher
homeownership rate than the national average, while Dallas (65 percent) and
Miami (63 percent) were lower. The majority of Houston housing expenditures
went toward shelter costs (54.8 percent), which include mortgage interest,
property taxes, repairs, and rent, among other items. The Houston share was
significantly lower than the 58.6-percent spent nationally. (See table A.)
Similarly, household furnishings and equipment accounted for a smaller share
of local housing expenditures (9.8 percent) than in the U.S. (11.0 percent).
In contrast, expenses for utilities, fuels, and public services accounted for
24.3 percent of total housing expenditures in the Houston metropolitan area,
significantly more than the 20.9-percent national share. (See table 2 for
detailed expenditure levels.)
Table A. Percent distribution of housing expenditures, United States and selected
metropolitan areas, 2005-2006
===================================================================================
United
Category States Houston Atlanta Dallas Miami
===================================================================================
Total housing 100.0 100.0 100.0 100.0 100.0
Shelter 58.6 54.8 59.0 55.4 63.1
Utilities, fuels, and public services 20.9 24.3 23.4 24.8 21.5
Household operations 5.5 6.9 6.1 6.4 5.4
Housekeeping supplies 4.0 4.3 3.4 4.0 3.3
Household furnishings and equipment 11.0 9.8 8.1 9.5 6.7
===================================================================================
Note: Columns may not add to 100 due to rounding.
Transportation, the second-largest expenditure category in the Houston
area at 20.7 percent of total expenditures, was significantly higher than the
17.8-percent national average. In fact, Houston was the only area with an
above-average transportation share among the 18 published metropolitan areas
nationwide. Households in Miami (19.3 percent), Dallas (18.1 percent), and
Atlanta (17.4 percent) allocated shares for transportation that were not
significantly different from the nation. Six other areas located throughout
the country had lower-than-average transportation expenditure shares. (See
chart 2.)
Of the annual $11,636 transportation expenditure in the Houston area,
95.5 percent was used in buying and maintaining private vehicles; this
compared to a national average of 94.4 percent. (See table B for expenditure
shares and table 2 for detailed expenditure levels.) The average number of
vehicles per household in Houston was 1.9, which equaled the national
average. The average number of vehicles per household was close to the U.S.
average in Dallas (2.0), but lower in Atlanta (1.6) and Miami (1.5). In the
Houston area, 4.5 percent of the household transportation budget was spent on
public transit, which includes fares for taxis, buses, trains, and planes;
nationally, the average was 5.6 percent.
Table B. Percent distribution of transportation expenditures, United States
and selected metropolitan areas, 2005-2006
==============================================================================
United
Category States Houston Atlanta Dallas Miami
==============================================================================
Total transportation 100.0 100.0 100.0 100.0 100.0
Vehicle purchases (net outlays) 41.3 45.6 41.4 40.6 39.1
Gasoline and motor oil 25.2 23.6 28.0 24.9 25.3
Other vehicle expenses 27.9 26.4 25.9 29.1 30.3
Public transportation 5.6 4.5 4.8 5.4 5.3
==============================================================================
Note: Columns may not add to 100 due to rounding.
Payments for personal insurance and pensions averaged $6,478 and
accounted for 11.5 percent of the local household budget, close to the 11.0-
percent share allocated nationally. Atlanta (12.8 percent) and Dallas (12.3
percent) had an above-average share for these types of payments, while
consumer units in Miami (9.4 percent) allocated a significantly smaller share
of their budget to personal insurance and pensions.
The portion of a Houston household’s budget spent on food, 10.8 percent,
was significantly lower than the 12.7-percent share recorded nationally.
While consumer units in Miami (13.3 percent) allocated a larger share of
their annual budget to food, households in Dallas (12.3 percent) and Atlanta
(12.1 percent) spent less than the U.S. average.
Consumer units in Houston spent $3,231, or 53.3 percent, of their food
dollars on food prepared at home, significantly below the U.S. household
share of 55.7 percent. The remaining 46.7 percent of local food budgets was
spent on food prepared away from home, such as restaurant meals, carry-outs,
board at school, and catered meals. Compared to the national average,
Atlanta households also allocated a measurably smaller share to costs for
eating at home (47.4 percent), while Miami (63.7 percent) spent a
significantly higher share on food at home. The share in Dallas (54.7
percent) was not significantly different from the national average.
Out-of-pocket healthcare expenses -- which include health insurance
premiums, medical services, drugs (prescription and nonprescription), and
medical care supplies -- accounted for 5.8 percent of total household
expenditures in both Houston and Dallas, not significantly different from the
5.7-percent share recorded nationwide. However, the percentage spent on out-
of-pocket health care expenses was significantly less than the national
average in both Miami (5.2 percent) and Atlanta (4.6 percent).
Cash contributions accounted for 4.9 percent of an average consumer
unit’s spending in Houston, not significantly different from the national
average of 3.7 percent. This category consists of cash contributed to
persons or organizations outside the consumer unit, including alimony and
child support payments; care of students away from home; and contributions to
religious, educational, charitable, or political organizations. Expenditures
for cash contributions were below the U.S. average in Miami (3.1 percent) and
Atlanta (2.8 percent), but not significantly different in Dallas (3.9
percent).
Spending on apparel and services accounted for 4.6 percent of total
expenditures in Houston, not significantly different from the 4.0-percent
national average. Households in Atlanta (4.2 percent) and Dallas (3.8
percent) allocated a similar share of their total budgets for clothing when
compared to the typical U.S. household, while the expenditure share in Miami
(2.9 percent) was significantly lower than the nation.
Houston area households allocated a significantly lower share (4.5
percent) of their budgets to entertainment expenditures when compared to the
national average (5.0 percent). Consumer units in Dallas (4.3 percent) and
Miami (3.6 percent) also spent lower portions of their total budgets on
entertainment, while the share in Atlanta was not significantly different
from the U.S. average.
As noted, Houston is 1 of 18 areas nationwide for which Consumer
Expenditure data are available. Users interested in learning more about the
Consumer Expenditure Survey may contact the Southwest Information Office at
(214) 767-6970. Metropolitan area CE data and that for the four geographic
regions and the United States are available on the BLS Web site at
http://www.bls.gov/cex/. This release is available in text and PDF
format on the Dallas BLS Web site at http://www.bls.gov/ro6/.
Technical Note
The current Consumer Expenditure Survey (CE) program began in 1980. Its
principal objective is to collect information on the buying habits of American
consumers. The consumer expenditure data are used in a wide variety of
research by government, business, labor, and academic analysts. The data are
also required for periodic revision of the Consumer Price Index.
The survey consists of two components, a diary or recordkeeping survey,
and an interview survey. The Diary Survey, completed by participating consumer
units for two consecutive 1-week periods, collects data on frequently-purchased
smaller items. The Interview Survey, in which the expenditures of consumer
units are obtained in five interviews conducted every 3 months, collects data
for larger-cost items and expenditures that occur on a regular basis. The U.S.
Census Bureau collects the survey data.
Each component of the survey queries an independent sample of consumer
units which is representative of the U.S. population. Over the year, about
7,000 consumer units are sampled for the Diary Survey. The Interview Survey is
conducted on a rotating panel basis, with about 7,000 consumer units
participating each quarter. The data are collected on an ongoing basis in 91
areas of the country.
The integrated data from the BLS Diary and Interview Surveys provide a
complete accounting of consumer expenditures and income, which neither survey
component alone is designed to do.
The expenditure data in this release should be interpreted with care. The
expenditures are averages for consumer units with the specified
characteristics, regardless of whether or not a specific unit incurred an
expense for that specific item during the recording period. The average
expenditure may be considerably lower than the expenditure by those consumer
units that purchased the item. This study is not intended as a comparative
cost of living survey, as neither the quantity nor the quality of goods and
services has been held constant among areas. Differences may result from
variations in demographic characteristics such as consumer unit size, age,
preferences, income levels, etc. Users should keep in mind that prices for
many goods and services have risen since the survey was conducted.
In addition, sample surveys are subject to two types of errors. Sampling
errors occur because the data are collected from a representative sample rather
than the entire population. Nonsampling errors result from the inability or
unwillingness of respondents to provide correct information, differences in
interviewer ability, mistakes in recording or coding, or other processing
errors. The year-to-year changes are volatile and should be interpreted
carefully. Sample sizes for the metropolitan areas are much smaller than for
the nation, so the U.S. estimates and year-to-year changes are more reliable
than those for the metropolitan areas.
Some expenditure components are subject to large fluctuations from one
year to the next because these components include expensive items that
relatively few consumers purchase each year. Thus, shifts from year to year in
the number of consumers making such purchases can have a large effect on
average expenditures. Examples of these types of expenses are purchases of new
cars and trucks in the transportation component, and spending on boats and
recreational vehicles in the entertainment component.
The CE significance tests in this release compare expenditure shares for
the 14 major expenditure categories in the United States to expenditure shares
in selected metropolitan areas (areas in this release are listed below).
Expenditure shares that are above or below that for the nation after testing
for significance at the 95-percent confidence interval are identified in the
tables and charts of this release.
NOTE: A value that is statistically different from another does not
necessarily mean that the difference has economic or practical significance.
Statistical significance is concerned with our ability to make confident
statements about a universe based on a sample. It is entirely possible that a
large difference between two values is not significantly different
statistically, while a small difference is, since both the size and
heterogeneity of the sample affect the relative error of the data being tested.
Metropolitan areas definitions are based on Core-Based Statistical Areas
defined by the U.S. Office of Management and Budget. The metropolitan areas
and their component counties and cities discussed in this release are:
Atlanta, Ga. -- includes Barrow, Bartow, Carroll, Cherokee, Clayton, Cobb,
Coweta, Dawson, De Kalb, Douglas, Fayette, Forsyth, Fulton, Gwinnett, Haralson,
Henry, Newton, Paulding, Pickens, Pike, Rockdale, Spalding, and Walton Counties
in Georgia; and Cleburne County in Alabama
Dallas-Fort Worth, Texas -- includes Collin, Dallas, Delta, Denton, Ellis,
Henderson, Hood, Hunt, Johnson, Kaufman, Parker, Rockwall, Tarrant and Wise
Counties
Houston-Galveston-Brazoria, Texas -- includes Austin, Brazoria, Chambers,
Fort Bend, Galveston, Harris, Liberty, Montgomery, San Jacinto and Waller Counties
Miami-Fort Lauderdale, Fla. -- includes Broward and Miami Dade Counties
Definitions
Consumer unit - members of a household related by blood, marriage, adoption,
or other legal arrangement; a single person living alone or sharing a household
with others but who is financially independent; or two or more persons living
together who share responsibility for at least 2 out of 3 major types of
expenses - food, housing, and other expenses. The terms household or consumer
unit are used interchangeably for convenience.
Expenditures - consist of the transaction costs, including excise and sales
taxes, of goods and services acquired during the interview or recordkeeping
period. Expenditure estimates include expenditures for gifts, but exclude
purchases or portions of purchases directly assignable to business purposes.
Also excluded are periodic credit or installment payments on goods or services
already acquired. The full cost of each purchase is recorded even though full
payment may not have been made at the date of purchase.
Income before taxes - the total money earnings and selected money receipts
during the 12 months prior to the interview date.
===================================================================================
(1) See Technical Note for definition of a consumer unit. The terms consumer
unit and household are used interchangeably throughout this text for convenience.
(2) Statistical significance tests were introduced for metropolitan area
expenditure shares beginning with 2004-2005 data. See Technical Note for further
discussion of Consumer Expenditure significance testing.
===================================================================================
Table 1. Consumer unit characteristics and percent distribution of expenditures,
U.S. and selected metropolitan statistical areas, Consumer Expenditure Survey,
2005-2006
===============================================================================
United
Item States Houston Atlanta Dallas Miami
===============================================================================
Consumer unit characteristics:
Income before taxes $59,628 $68,659 $64,217 $66,261 $51,232
Age of reference person 48.7 45.7 46.1 44.9 50.4
Average number in consumer unit:
Persons 2.5 2.8 2.5 2.8 2.5
Children under 18 .6 .8 .7 .8 .6
Persons 65 and over .3 .2 .2 .2 .4
Earners 1.3 1.4 1.3 1.6 1.3
Vehicles 1.9 1.9 1.6 2.0 1.5
Percent homeowner 67 70 69 65 63
------------------------------------------------------------------------------
Average annual expenditures $47,421 $56,260 $43,727 $53,294 $42,379
Percent distribution: 100.0 100.0 100.0 100.0 100.0
Food 12.7 10.8 12.1 12.3 13.3
Alcoholic beverages 1.0 1.1 .6 .9 .6
Housing 33.3 30.6 37.0 33.5 37.6
Apparel and services 4.0 4.6 4.2 3.8 2.9
Transportation 17.8 20.7 17.4 18.1 19.3
Healthcare 5.7 5.8 4.6 5.8 5.2
Entertainment 5.0 4.5 4.3 4.3 3.6
Personal care products & services 1.2 1.3 1.1 1.3 1.5
Reading .3 .2 .2 .2 .1
Education 1.9 1.8 1.5 1.5 1.7
Tobacco products & smoking supplies .7 .5 .4 .5 .4
Miscellaneous 1.7 1.8 1.2 1.6 1.2
Cash contributions 3.7 4.9 2.8 3.9 3.1
Personal insurance and pensions 11.0 11.5 12.8 12.3 9.4
===============================================================================
NOTE: Columns may not add to 100 due to rounding.
Table 2. Consumer unit characteristics and average annual expenditures,
U.S. and selected metropolitan areas, Consumer Expenditure Survey, 2005-2006
==================================================================================
United
Item States Houston Atlanta Dallas Miami
==================================================================================
Consumer unit characteristics:
Income before taxes $59,628 $68,659 $64,217 $66,261 $51,232
Age of reference person 48.7 45.7 46.1 44.9 50.4
Average number in consumer unit:
Persons 2.5 2.8 2.5 2.8 2.5
Children under 18 .6 .8 .7 .8 .6
Persons 65 and over .3 .2 .2 .2 .4
Earners 1.3 1.4 1.3 1.6 1.3
Vehicles 1.9 1.9 1.6 2.0 1.5
Percent homeowner 67 70 69 65 63
----------------------------------------------------------------------------------
Average annual expenditures $47,421 $56,260 $43,727 $53,294 $42,379
Food 6,022 6,063 5,289 6,537 5,637
Food at home 3,357 3,231 2,506 3,573 3,593
Cereals and bakery products 446 382 323 468 464
Meats, poultry, fish, & eggs 781 784 661 805 910
Dairy products 373 329 234 392 427
Fruits and vegetables 572 587 443 596 727
Other food at home 1,185 1,149 846 1,312 1,066
Food away from home 2,665 2,832 2,783 2,964 2,044
Alcoholic beverages 462 604 265 461 255
Housing 15,782 17,198 16,158 17,854 15,928
Shelter 9,253 9,427 9,539 9,883 10,053
Owned dwellings 6,250 6,501 6,467 6,793 6,385
Rented dwellings 2,468 2,293 2,523 2,478 3,445
Other lodging 535 634 549 611 222
Utilities, fuels, & public services 3,291 4,179 3,773 4,424 3,421
Household operations 875 1,181 990 1,140 856
Housekeeping supplies 625 732 548 714 532
Household furnishings
and equipment 1,737 1,679 1,307 1,693 1,065
Apparel and services 1,880 2,608 1,847 2,048 1,242
Transportation 8,427 11,636 7,599 9,662 8,186
Vehicle purchases (net outlay) 3,482 5,305 3,146 3,919 3,199
Gasoline and motor oil 2,121 2,743 2,124 2,410 2,069
Other vehicle expenses 2,347 3,068 1,965 2,816 2,480
Public transportation 476 519 364 517 437
Healthcare 2,716 3,259 2,017 3,075 2,190
Entertainment 2,382 2,528 1,861 2,285 1,523
Personal care products and services 563 737 460 713 633
Reading 122 114 72 110 43
Education 914 998 652 799 724
Tobacco products & smoking supplies 323 274 190 260 168
Miscellaneous 827 1,025 522 839 524
Cash contributions 1,767 2,736 1,207 2,077 1,328
Personal insurance and pensions 5,237 6,478 5,587 6,573 4,000
Life & other personal insurance 351 441 266 382 221
Pensions and Social Security 4,886 6,038 5,321 6,191 3,779
==================================================================================
Chart 1. Expenditure shares spent on housing in all 18 metropolitan
statistical areas compared to the U.S. average, 2005-2006
This report contains annual data averaged over a two-year period, 2005
and 2006. The data are from the Consumer Expenditure Survey (CE), which is
collected on an ongoing basis by the U.S. Census Bureau for the Bureau of
Labor Statistics (BLS). The Consumer Expenditure Survey is the only national
survey that provides both complete data on household expenditures and the
demographic characteristics of those households. CE data are available for
the nation, the 4 geographic regions of the country, and 18 metropolitan
areas. Survey data cannot be used to make cost of living comparisons between
areas. Expenditures vary among areas not only because of economic factors
such as the prices of goods and services and family income, but also because
of differences such as the age of the population, climate, consumer tastes,
family size, etc. However, expenditure shares, or the percentage of a
consumer unit’s budget spent on a particular category, can be used to compare
spending patterns across areas. The survey provides average expenditures for
consumer units. An individual consumer unit may spend more or less than the
average, depending on its particular characteristics.
Though data for 18 metropolitan areas were available for the 2005-06
period, 3 in particular—Dallas, Miami, and Atlanta—were selected for
comparison with Houston, as they are all located in the South and had
populations that were similar in size.
Housing, the largest expenditure category, accounted for 30.6 percent of
a Houston area household’s total budget; this share was significantly lower
than the 33.3-percent national average. (See table 1.) Miami (37.6 percent)
and Atlanta (37.0 percent) had housing shares that were measurably above the
U.S. average, while the share in Dallas (33.5 percent) was not significantly
different. (See chart 1.)
The rate of homeownership in Houston, 70 percent, was higher than the
national average of 67 percent. Atlanta (69 percent) also had a higher
homeownership rate than the national average, while Dallas (65 percent) and
Miami (63 percent) were lower. The majority of Houston housing expenditures
went toward shelter costs (54.8 percent), which include mortgage interest,
property taxes, repairs, and rent, among other items. The Houston share was
significantly lower than the 58.6-percent spent nationally. (See table A.)
Similarly, household furnishings and equipment accounted for a smaller share
of local housing expenditures (9.8 percent) than in the U.S. (11.0 percent).
In contrast, expenses for utilities, fuels, and public services accounted for
24.3 percent of total housing expenditures in the Houston metropolitan area,
significantly more than the 20.9-percent national share. (See table 2 for
detailed expenditure levels.)
Table A. Percent distribution of housing expenditures, United States and selected
metropolitan areas, 2005-2006
===================================================================================
United
Category States Houston Atlanta Dallas Miami
===================================================================================
Total housing 100.0 100.0 100.0 100.0 100.0
Shelter 58.6 54.8 59.0 55.4 63.1
Utilities, fuels, and public services 20.9 24.3 23.4 24.8 21.5
Household operations 5.5 6.9 6.1 6.4 5.4
Housekeeping supplies 4.0 4.3 3.4 4.0 3.3
Household furnishings and equipment 11.0 9.8 8.1 9.5 6.7
===================================================================================
Note: Columns may not add to 100 due to rounding.
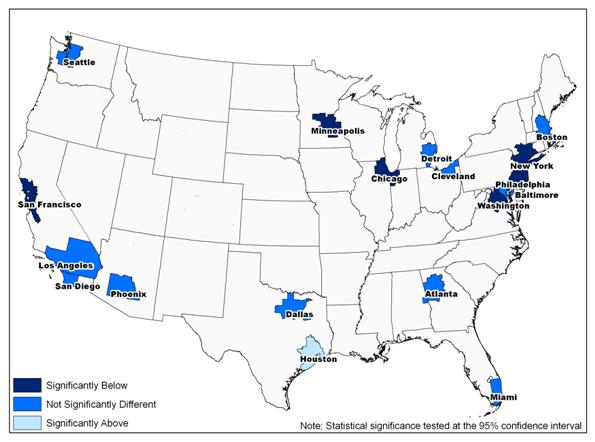
Transportation, the second-largest expenditure category in the Houston
area at 20.7 percent of total expenditures, was significantly higher than the
17.8-percent national average. In fact, Houston was the only area with an
above-average transportation share among the 18 published metropolitan areas
nationwide. Households in Miami (19.3 percent), Dallas (18.1 percent), and
Atlanta (17.4 percent) allocated shares for transportation that were not
significantly different from the nation. Six other areas located throughout
the country had lower-than-average transportation expenditure shares. (See
chart 2.)
Of the annual $11,636 transportation expenditure in the Houston area,
95.5 percent was used in buying and maintaining private vehicles; this
compared to a national average of 94.4 percent. (See table B for expenditure
shares and table 2 for detailed expenditure levels.) The average number of
vehicles per household in Houston was 1.9, which equaled the national
average. The average number of vehicles per household was close to the U.S.
average in Dallas (2.0), but lower in Atlanta (1.6) and Miami (1.5). In the
Houston area, 4.5 percent of the household transportation budget was spent on
public transit, which includes fares for taxis, buses, trains, and planes;
nationally, the average was 5.6 percent.
Table B. Percent distribution of transportation expenditures, United States
and selected metropolitan areas, 2005-2006
==============================================================================
United
Category States Houston Atlanta Dallas Miami
==============================================================================
Total transportation 100.0 100.0 100.0 100.0 100.0
Vehicle purchases (net outlays) 41.3 45.6 41.4 40.6 39.1
Gasoline and motor oil 25.2 23.6 28.0 24.9 25.3
Other vehicle expenses 27.9 26.4 25.9 29.1 30.3
Public transportation 5.6 4.5 4.8 5.4 5.3
==============================================================================
Note: Columns may not add to 100 due to rounding.
Payments for personal insurance and pensions averaged $6,478 and
accounted for 11.5 percent of the local household budget, close to the 11.0-
percent share allocated nationally. Atlanta (12.8 percent) and Dallas (12.3
percent) had an above-average share for these types of payments, while
consumer units in Miami (9.4 percent) allocated a significantly smaller share
of their budget to personal insurance and pensions.
The portion of a Houston household’s budget spent on food, 10.8 percent,
was significantly lower than the 12.7-percent share recorded nationally.
While consumer units in Miami (13.3 percent) allocated a larger share of
their annual budget to food, households in Dallas (12.3 percent) and Atlanta
(12.1 percent) spent less than the U.S. average.
Consumer units in Houston spent $3,231, or 53.3 percent, of their food
dollars on food prepared at home, significantly below the U.S. household
share of 55.7 percent. The remaining 46.7 percent of local food budgets was
spent on food prepared away from home, such as restaurant meals, carry-outs,
board at school, and catered meals. Compared to the national average,
Atlanta households also allocated a measurably smaller share to costs for
eating at home (47.4 percent), while Miami (63.7 percent) spent a
significantly higher share on food at home. The share in Dallas (54.7
percent) was not significantly different from the national average.
Out-of-pocket healthcare expenses -- which include health insurance
premiums, medical services, drugs (prescription and nonprescription), and
medical care supplies -- accounted for 5.8 percent of total household
expenditures in both Houston and Dallas, not significantly different from the
5.7-percent share recorded nationwide. However, the percentage spent on out-
of-pocket health care expenses was significantly less than the national
average in both Miami (5.2 percent) and Atlanta (4.6 percent).
Cash contributions accounted for 4.9 percent of an average consumer
unit’s spending in Houston, not significantly different from the national
average of 3.7 percent. This category consists of cash contributed to
persons or organizations outside the consumer unit, including alimony and
child support payments; care of students away from home; and contributions to
religious, educational, charitable, or political organizations. Expenditures
for cash contributions were below the U.S. average in Miami (3.1 percent) and
Atlanta (2.8 percent), but not significantly different in Dallas (3.9
percent).
Spending on apparel and services accounted for 4.6 percent of total
expenditures in Houston, not significantly different from the 4.0-percent
national average. Households in Atlanta (4.2 percent) and Dallas (3.8
percent) allocated a similar share of their total budgets for clothing when
compared to the typical U.S. household, while the expenditure share in Miami
(2.9 percent) was significantly lower than the nation.
Houston area households allocated a significantly lower share (4.5
percent) of their budgets to entertainment expenditures when compared to the
national average (5.0 percent). Consumer units in Dallas (4.3 percent) and
Miami (3.6 percent) also spent lower portions of their total budgets on
entertainment, while the share in Atlanta was not significantly different
from the U.S. average.
As noted, Houston is 1 of 18 areas nationwide for which Consumer
Expenditure data are available. Users interested in learning more about the
Consumer Expenditure Survey may contact the Southwest Information Office at
(214) 767-6970. Metropolitan area CE data and that for the four geographic
regions and the United States are available on the BLS Web site at
http://www.bls.gov/cex/. This release is available in text and PDF
format on the Dallas BLS Web site at http://www.bls.gov/ro6/.
Technical Note
The current Consumer Expenditure Survey (CE) program began in 1980. Its
principal objective is to collect information on the buying habits of American
consumers. The consumer expenditure data are used in a wide variety of
research by government, business, labor, and academic analysts. The data are
also required for periodic revision of the Consumer Price Index.
The survey consists of two components, a diary or recordkeeping survey,
and an interview survey. The Diary Survey, completed by participating consumer
units for two consecutive 1-week periods, collects data on frequently-purchased
smaller items. The Interview Survey, in which the expenditures of consumer
units are obtained in five interviews conducted every 3 months, collects data
for larger-cost items and expenditures that occur on a regular basis. The U.S.
Census Bureau collects the survey data.
Each component of the survey queries an independent sample of consumer
units which is representative of the U.S. population. Over the year, about
7,000 consumer units are sampled for the Diary Survey. The Interview Survey is
conducted on a rotating panel basis, with about 7,000 consumer units
participating each quarter. The data are collected on an ongoing basis in 91
areas of the country.
The integrated data from the BLS Diary and Interview Surveys provide a
complete accounting of consumer expenditures and income, which neither survey
component alone is designed to do.
The expenditure data in this release should be interpreted with care. The
expenditures are averages for consumer units with the specified
characteristics, regardless of whether or not a specific unit incurred an
expense for that specific item during the recording period. The average
expenditure may be considerably lower than the expenditure by those consumer
units that purchased the item. This study is not intended as a comparative
cost of living survey, as neither the quantity nor the quality of goods and
services has been held constant among areas. Differences may result from
variations in demographic characteristics such as consumer unit size, age,
preferences, income levels, etc. Users should keep in mind that prices for
many goods and services have risen since the survey was conducted.
In addition, sample surveys are subject to two types of errors. Sampling
errors occur because the data are collected from a representative sample rather
than the entire population. Nonsampling errors result from the inability or
unwillingness of respondents to provide correct information, differences in
interviewer ability, mistakes in recording or coding, or other processing
errors. The year-to-year changes are volatile and should be interpreted
carefully. Sample sizes for the metropolitan areas are much smaller than for
the nation, so the U.S. estimates and year-to-year changes are more reliable
than those for the metropolitan areas.
Some expenditure components are subject to large fluctuations from one
year to the next because these components include expensive items that
relatively few consumers purchase each year. Thus, shifts from year to year in
the number of consumers making such purchases can have a large effect on
average expenditures. Examples of these types of expenses are purchases of new
cars and trucks in the transportation component, and spending on boats and
recreational vehicles in the entertainment component.
The CE significance tests in this release compare expenditure shares for
the 14 major expenditure categories in the United States to expenditure shares
in selected metropolitan areas (areas in this release are listed below).
Expenditure shares that are above or below that for the nation after testing
for significance at the 95-percent confidence interval are identified in the
tables and charts of this release.
NOTE: A value that is statistically different from another does not
necessarily mean that the difference has economic or practical significance.
Statistical significance is concerned with our ability to make confident
statements about a universe based on a sample. It is entirely possible that a
large difference between two values is not significantly different
statistically, while a small difference is, since both the size and
heterogeneity of the sample affect the relative error of the data being tested.
Metropolitan areas definitions are based on Core-Based Statistical Areas
defined by the U.S. Office of Management and Budget. The metropolitan areas
and their component counties and cities discussed in this release are:
Atlanta, Ga. -- includes Barrow, Bartow, Carroll, Cherokee, Clayton, Cobb,
Coweta, Dawson, De Kalb, Douglas, Fayette, Forsyth, Fulton, Gwinnett, Haralson,
Henry, Newton, Paulding, Pickens, Pike, Rockdale, Spalding, and Walton Counties
in Georgia; and Cleburne County in Alabama
Dallas-Fort Worth, Texas -- includes Collin, Dallas, Delta, Denton, Ellis,
Henderson, Hood, Hunt, Johnson, Kaufman, Parker, Rockwall, Tarrant and Wise
Counties
Houston-Galveston-Brazoria, Texas -- includes Austin, Brazoria, Chambers,
Fort Bend, Galveston, Harris, Liberty, Montgomery, San Jacinto and Waller Counties
Miami-Fort Lauderdale, Fla. -- includes Broward and Miami Dade Counties
Definitions
Consumer unit - members of a household related by blood, marriage, adoption,
or other legal arrangement; a single person living alone or sharing a household
with others but who is financially independent; or two or more persons living
together who share responsibility for at least 2 out of 3 major types of
expenses - food, housing, and other expenses. The terms household or consumer
unit are used interchangeably for convenience.
Expenditures - consist of the transaction costs, including excise and sales
taxes, of goods and services acquired during the interview or recordkeeping
period. Expenditure estimates include expenditures for gifts, but exclude
purchases or portions of purchases directly assignable to business purposes.
Also excluded are periodic credit or installment payments on goods or services
already acquired. The full cost of each purchase is recorded even though full
payment may not have been made at the date of purchase.
Income before taxes - the total money earnings and selected money receipts
during the 12 months prior to the interview date.
===================================================================================
(1) See Technical Note for definition of a consumer unit. The terms consumer
unit and household are used interchangeably throughout this text for convenience.
(2) Statistical significance tests were introduced for metropolitan area
expenditure shares beginning with 2004-2005 data. See Technical Note for further
discussion of Consumer Expenditure significance testing.
===================================================================================
Table 1. Consumer unit characteristics and percent distribution of expenditures,
U.S. and selected metropolitan statistical areas, Consumer Expenditure Survey,
2005-2006
===============================================================================
United
Item States Houston Atlanta Dallas Miami
===============================================================================
Consumer unit characteristics:
Income before taxes $59,628 $68,659 $64,217 $66,261 $51,232
Age of reference person 48.7 45.7 46.1 44.9 50.4
Average number in consumer unit:
Persons 2.5 2.8 2.5 2.8 2.5
Children under 18 .6 .8 .7 .8 .6
Persons 65 and over .3 .2 .2 .2 .4
Earners 1.3 1.4 1.3 1.6 1.3
Vehicles 1.9 1.9 1.6 2.0 1.5
Percent homeowner 67 70 69 65 63
------------------------------------------------------------------------------
Average annual expenditures $47,421 $56,260 $43,727 $53,294 $42,379
Percent distribution: 100.0 100.0 100.0 100.0 100.0
Food 12.7 10.8 12.1 12.3 13.3
Alcoholic beverages 1.0 1.1 .6 .9 .6
Housing 33.3 30.6 37.0 33.5 37.6
Apparel and services 4.0 4.6 4.2 3.8 2.9
Transportation 17.8 20.7 17.4 18.1 19.3
Healthcare 5.7 5.8 4.6 5.8 5.2
Entertainment 5.0 4.5 4.3 4.3 3.6
Personal care products & services 1.2 1.3 1.1 1.3 1.5
Reading .3 .2 .2 .2 .1
Education 1.9 1.8 1.5 1.5 1.7
Tobacco products & smoking supplies .7 .5 .4 .5 .4
Miscellaneous 1.7 1.8 1.2 1.6 1.2
Cash contributions 3.7 4.9 2.8 3.9 3.1
Personal insurance and pensions 11.0 11.5 12.8 12.3 9.4
===============================================================================
NOTE: Columns may not add to 100 due to rounding.
Table 2. Consumer unit characteristics and average annual expenditures,
U.S. and selected metropolitan areas, Consumer Expenditure Survey, 2005-2006
==================================================================================
United
Item States Houston Atlanta Dallas Miami
==================================================================================
Consumer unit characteristics:
Income before taxes $59,628 $68,659 $64,217 $66,261 $51,232
Age of reference person 48.7 45.7 46.1 44.9 50.4
Average number in consumer unit:
Persons 2.5 2.8 2.5 2.8 2.5
Children under 18 .6 .8 .7 .8 .6
Persons 65 and over .3 .2 .2 .2 .4
Earners 1.3 1.4 1.3 1.6 1.3
Vehicles 1.9 1.9 1.6 2.0 1.5
Percent homeowner 67 70 69 65 63
----------------------------------------------------------------------------------
Average annual expenditures $47,421 $56,260 $43,727 $53,294 $42,379
Food 6,022 6,063 5,289 6,537 5,637
Food at home 3,357 3,231 2,506 3,573 3,593
Cereals and bakery products 446 382 323 468 464
Meats, poultry, fish, & eggs 781 784 661 805 910
Dairy products 373 329 234 392 427
Fruits and vegetables 572 587 443 596 727
Other food at home 1,185 1,149 846 1,312 1,066
Food away from home 2,665 2,832 2,783 2,964 2,044
Alcoholic beverages 462 604 265 461 255
Housing 15,782 17,198 16,158 17,854 15,928
Shelter 9,253 9,427 9,539 9,883 10,053
Owned dwellings 6,250 6,501 6,467 6,793 6,385
Rented dwellings 2,468 2,293 2,523 2,478 3,445
Other lodging 535 634 549 611 222
Utilities, fuels, & public services 3,291 4,179 3,773 4,424 3,421
Household operations 875 1,181 990 1,140 856
Housekeeping supplies 625 732 548 714 532
Household furnishings
and equipment 1,737 1,679 1,307 1,693 1,065
Apparel and services 1,880 2,608 1,847 2,048 1,242
Transportation 8,427 11,636 7,599 9,662 8,186
Vehicle purchases (net outlay) 3,482 5,305 3,146 3,919 3,199
Gasoline and motor oil 2,121 2,743 2,124 2,410 2,069
Other vehicle expenses 2,347 3,068 1,965 2,816 2,480
Public transportation 476 519 364 517 437
Healthcare 2,716 3,259 2,017 3,075 2,190
Entertainment 2,382 2,528 1,861 2,285 1,523
Personal care products and services 563 737 460 713 633
Reading 122 114 72 110 43
Education 914 998 652 799 724
Tobacco products & smoking supplies 323 274 190 260 168
Miscellaneous 827 1,025 522 839 524
Cash contributions 1,767 2,736 1,207 2,077 1,328
Personal insurance and pensions 5,237 6,478 5,587 6,573 4,000
Life & other personal insurance 351 441 266 382 221
Pensions and Social Security 4,886 6,038 5,321 6,191 3,779
==================================================================================
Chart 1. Expenditure shares spent on housing in all 18 metropolitan
statistical areas compared to the U.S. average, 2005-2006
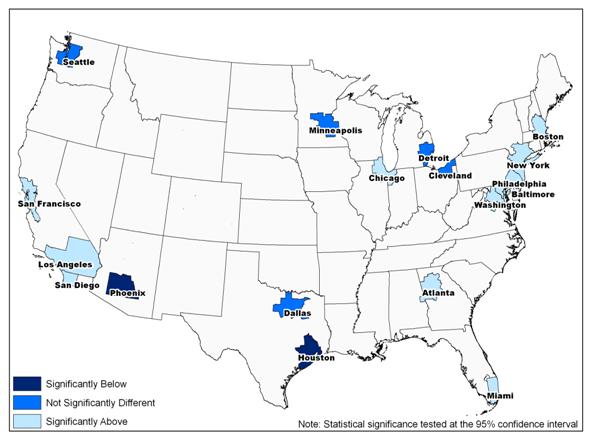 Chart 2. Expenditure shares spent on transportation in all 18 metropolitan
statistical areas compared to the U.S. average, 2005-2006
Chart 2. Expenditure shares spent on transportation in all 18 metropolitan
statistical areas compared to the U.S. average, 2005-2006
Last Modified Date: March 18, 2008