

Images & Animations
-
Credit
NASA/Goddard Space Flight Center Scientific Visualization Studio
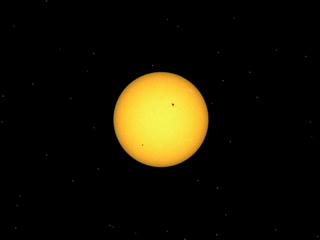
SOHO/MDI Investigates Solar Flows Under Sunspots
SOHO/MDI performs a 'sonogram' of the sun, revealing the subsurface temperature profile around a sunspot. Red isosurfaces denote regions where the sound speed (and temperature) are higher than average while blue isosurfaces directly under the spot illustrate where the sound speed (and temperature) are lower than average.
A fly-in to the solar surface. The view dives below the surface to reveal temperature anomalies derived from helioseismology.
Metadata
-
Sensor
SOHO/MDI -
Animation ID
2232 -
Video ID
SVS2001-0026 -
Start Timecode
01:03:25:00 -
End Timecode
01:04:21:12 -
Animator
Tom Bridgman -
Studio
SVS -
Visualization Date
2001/08/31 -
Scientist
Junwei Zhao (Stanford University), Alexander G. Kosovichev (Stanford University), Thomas L. Duvall Jr. (NASA/GSFC), Phil Sherrer (Stanford University), Neal Hurlburt (LMSAL), A. M. Rucklidge (University of Cambridge) -
Citation
Zhao, J., Kosovichev, A.G., & Duvall, T.L. 2001, Astrophysical Journal, 557, 384. Hurlburt, N.E. & Rucklidge, A.M. 2000, Monthly Notices of the Royal Astronomical Society, 314, 793 -
Datasets
MDI -
Keywords
Sun, Sunspots, Helioseismology -
DLESE Subject
Space science -
Data Date
1998/06/18 -
Story URL
http://www.gsfc.nasa.gov/topstory/20010919sunspot.html -
Animation Type
Regular