

Images & Animations
-
Credit
NASA/Goddard Space Flight Center Scientific Visualization Studio
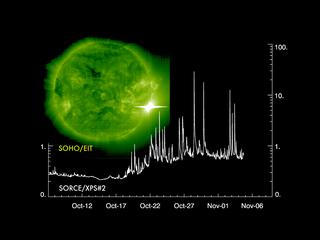
SORCE Monitors Solar Variability during Record Solar Flares - Video version
The SORCE mission monitors solar variability to determine its impact on the Earth's climate. The X-ray photometer aboard SORCE observes the record-breaking solar flares in the Fall of 2003. The line graph shows the photometer's measured solar radiation flux in the 1-7 nanometer wavelength band (x-ray) measured in milliwatts per square meter. The ultraviolet (195 Angstrom) imagery from SOHO/EIT (green) illustrates where the flares (the bright white spots) are located on the solar disk. This version has the contents slightly smaller for use in video.
The MONSTER: X28 solar flare on November 4, 2003
Metadata
-
Sensor
SORCE/XPS -
Animation ID
2918 -
Video ID
None -
Start Timecode
00:00:00:00 -
End Timecode
00:00:00:00 -
Animator
Tom Bridgman, Marte Newcombe -
Studio
SVS -
Visualization Date
2004/02/18 -
Scientist
Gary Rottman (University of Colorado), Tom Woods (University of Colorado) -
Datasets
SOHO/EIT -
Keywords
Solar Flare, Solar Radiation, X-ray, Ultraviolet, Solar Active Region -
DLESE Subject
Space science -
Data Date
2003/10/25-2003/11/07 -
Pao ID
G04-009 -
Animation Type
Regular