Energy Information Administration Brochures
| Brochure #: DOE/EIA-X012 Release Date: May 2008 Next Release Date: May 2009 |
 |
Greenhouse Gases, Climate Change, and Energy
What Are Greenhouse Gases?
Many chemical compounds found in the Earth’s atmosphere act as “greenhouse gases.” These gases allow sunlight to enter the atmosphere freely. When sunlight strikes the Earth’s surface, some of it is re-radiated back towards space as infrared radiation (heat). Greenhouse gases absorb this infrared radiation and trap the heat in the atmosphere. Many gases exhibit these “greenhouse” properties. Some of them occur in nature (water vapor, carbon dioxide, methane, and nitrous oxide), while others are exclusively human made (certain industrial gases). Over time, if atmospheric concentrations of greenhouse gases remain relatively stable, the amount of energy sent from the sun to the Earth’s surface should be about the same as the amount of energy radiated back into space, leaving the temperature of the Earth’s surface roughly constant.
Why Are Atmospheric Levels Increasing?
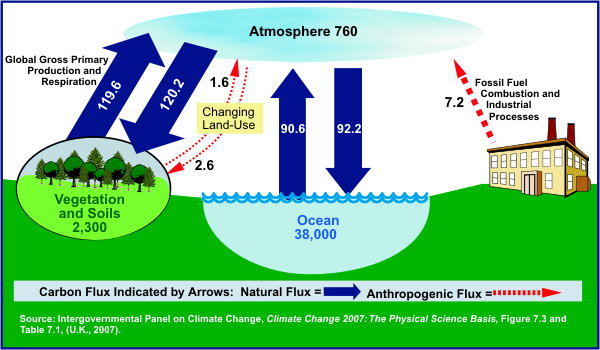
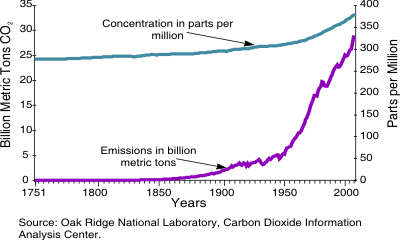
Levels of several important greenhouse gases have increased by about 25 percent since large-scale industrialization began around 150 years ago (Figure 1). During the past 20 years, about three-quarters of anthropogenic (human-caused) emissions came from the burning of fossil fuels. Concentrations of carbon dioxide in the atmosphere are naturally regulated by numerous processes collectively known as the “carbon cycle” (Figure 2).
Figure 1.Carbon Dioxide Emissions and Carbon Dioxide
Concentrations (1751-2004)
The movement (“flux”) of carbon between the atmosphere and the land and oceans is dominated by natural processes, such as plant photosynthesis. While these natural processes can absorb some of the net 6.2 billion metric tons (7.2 billion metric tons less 1 billion metric tons of sinks) of anthropogenic carbon dioxide emissions produced each year (measured in carbon equivalent terms), an estimated 4.1 billion metric tons are added to the atmosphere annually. This positive imbalance between greenhouse gas emissions and absorption results in the continuing increase in atmospheric concentrations of greenhouse gases.
Figure 2. Global Carbon Cycle (Billion Metric Tons Carbon)
What Effect Do Greenhouse Gases Have on Climate Change?
In computer-based models, rising concentrations of greenhouse gases produce an increase in the average surface temperature of the Earth over time. Rising temperatures may, in turn, produce changes in precipitation patterns, storm severity, and sea level commonly referred to as “climate change.”Assessments by the Intergovernmental Panel on Climate Change (IPCC) suggest that the Earth’s climate has warmed between 0.6 and 0.9 degrees Celsius over the past century and that human activity affecting the atmosphere is “very likely” an important driving factor.1 The IPCC’s Fourth Assessment Report (Summary for Policymakers) states, “Most of the observed increase in globally averaged temperatures since the mid-20th century is very likely due to the observed increase in anthropogenic greenhouse gas concentrations.” It goes on to state, “The observed widespread warming of the atmosphere and ocean, together with ice mass loss, support the conclusion that it is extremely unlikely that global climate change of the past 50 years can be explained without external forcing, and very likely that it is not due to known natural causes alone.”
1According to the IPCC “very likely” indicates that there is a 90 percent chance that this is the case.What Are the Sources of Greenhouse Gases?
In the United States, greenhouse gas emissions come primarily from the combustion of fossil fuels in energy use. Energy use is largely driven by economic growth with short-term fluctuations in its growth rate created by weather patterns affecting heating and cooling needs, as well as changes in the fuel used in electricity generation. Energy-related carbon dioxide emissions, resulting from the combustion of petroleum, coal, and natural gas, represented 82 percent of total U.S. anthropogenic greenhouse gas emissions in 2006 (Figure 32). The connection between energy use and carbon dioxide emissions is explored in the box on the reverse side (Figure 4).
2Values expressed as carbon dioxide equivalents (CO2e) are calculated based on their global warming potential (GWP). GWP is the ratio of the warming that would result from the emission of one kilogram of a greenhouse gas to that from the emission of one kilogram of carbon dioxide over a fixed period of time such as 100 years.Figure 3. U.S. Anthropogenic Greenhouse Gas Emissions by Gas,
2006 (Million Metric Tons of Carbon Dioxide Equivalent)
Another greenhouse gas, methane, comes from landfills, coal mines, oil and natural gas operations, and agriculture; it represented 9 percent of total emissions. Nitrous oxide (5 percent of total emissions), is emitted through the use of nitrogen fertilizers, from burning fossil fuels and from certain industrial and waste management processes. Several human-made gases, hydrofluorocarbons (HFCs), perfluorocarbons (PFCs) and sulfur hexafluoride (SF6), that are released as byproducts of industrial processes and through leakage, represented 2 percent of total emissions.
The Energy Connection . . . Fossil fuels are made up of hydrogen and carbon. When fossil fuels are burned, the carbon combines with oxygen to yield carbon dioxide. The amount of carbon dioxide produced depends on the carbon content of the fuel; for example, for each unit of energy produced, natural gas emits about half and petroleum fuels about three-quarters of the carbon dioxide produced by coal.
Fossil fuels supply 85 percent of the primary energy consumed in the United States and are responsible for 98 percent of emissions of carbon dioxide. Eighty percent of U.S. carbon dioxide emissions come from the use of coal and petroleum fuels. Although the industrial sector is the largest energy consumer (including direct fuel use and purchased electricity), the transportation sector emits more carbon dioxide because of its near complete dependence on petroleum fuels. The residential and commercial sectors have lower emission levels than the transportation and industrial sectors, with the majority of their emissions coming from the combustion of fossil energy to produce purchased electricity.
Electricity generation consumes 40 percent of U.S. primary energy and is responsible for 40 percent of carbon dioxide emissions. In the electric power sector, coal accounts for 83 percent of the emissions. The bar graphs in the figure below show emissions from electricity generation apportioned among energy-use sectors.
Figure 4. U.S. Primary Energy Consumption and Carbon Dioxide Emissions, 2006.
What is the Prospect for Future Emissions?
World carbon dioxide emissions are expected to increase by 1.8 percent annually between 2004 and 2030 (Figure 5). Much of the increase in these emissions is expected to occur in the developing world where emerging economies, such as China and India, fuel economic development with fossil energy. Emissions from the countries outside the Organization for Economic Cooperation and Development (OECD) are expected to grow above the world average at 2.6 percent annually between 2004 and 2030.
Figure 5. World Carbon Dioxide Emissions by Region,
2003-2030 (Billion Metric Tons of Carbon Dioxide)
Note: Explanations for OECD and Non-OECD can be found on EIA’s web site at:
http://www.eia.doe.gov/oiaf/ieo/pdf/appk.pdf
Source: Energy Information Administration, International Energy Outlook 2007
(Washington, DC, May 2007).In 2004, the United States produced about 22 percent of global carbon dioxide emissions from burning fossil fuels, primarily because the U.S. economy is the largest in the world and it meets 85 percent of its energy needs through burning fossil fuels. The United States is projected to lower its carbon intensity by 36 percent from 2004 to 2030
(Figure 6).Figure 6. Carbon Intensity by Region, 2003-2030 (Metric
Tons of Carbon Dioxide per Million 2000 Dollars)

Source: Energy Information Administration, International Energy Outlook 2007
(Washington, DC, May 2007).
Note: Explanations for OECD and Non-OECD can be found on EIA’s web site at:
http://www.eia.doe.gov/oiaf/ieo/pdf/appk.pdf


The Energy Information Administration (EIA) is an inde-pendent statistical agency, within the U.S. Department of Energy. whose purpose is to provide reliable and unbiased energy information. For further information, contact: Telephone: 202.586.8800, 9:00am-5:00pm Eastern time. This and other consumer-oriented brochures can be accessed on the Web at: http://tonto.eia.doe.gov/reports/reportsA.asp?type=other |