Data & Statistics
Other Features
Featured Data & Statistics
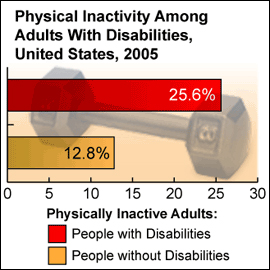
Physical Activity Among Adults With Disabilities—United States, 2005
October is National Disability Awareness Month in the United States. Today, about 50 million Americans, or one in five people, are living with at least one disability, and most Americans will experience a disability at some time during the course of their lives. Some disabilities are easy to see, such as when a person uses a wheelchair or when someone has lost an arm. Other disabilities, like a developmental disability such as autism or a chronic condition like arthritis, may not be as easy to see. Some people may live with a disability all their lives. Others may have a disability when they are young or as an older adult. Different kinds of disabilities affect people in different ways. And the same disability can affect each person differently.
Since the Americans with Disabilities Act was passed 17 years ago, we have removed or reduced many social barriers. Buildings are more accessible. Employment opportunities are greater. This has enabled people with disabilities to become more independent and involved in their world. But are they healthier? Often they are not. CDC research shows that people with disabilities generally report poorer health than people without disabilities.
The health benefits of physical activity have been well documented and are supported by recommendations in Healthy People 2010 regarding the frequency, intensity, and duration of physical activity for optimal health; however, the majority of U.S. adults do not follow these recommendations. Physical inactivity is particularly prevalent among adults with a disability, who are at increased risk for secondary health conditions that can result from their disabilities or from their behavior, lifestyle, or environment. To estimate the state-specific prevalence of physical activity and physical inactivity among adults with and without a disability, CDC analyzed data from the 2005 Behavioral Risk Factor Surveillance System. Compared with adults with no disability, a smaller proportion of adults with a disability met the national targets for physical activity (37.7% versus 49.4%; p<0.01), and a larger proportion were physically inactive (25.6% versus 12.8%; p<0.01). Public health measures to promote and increase physical activity among all adults should include consideration for the needs of adults with disabilities.
For more information, see:
- Centers for Disease Control and Prevention. Physical Activity Among Adults With a Disability—United States, 2005. MMWR 2007;56:1021-1024.
- CDC's Disability and Health Activities
Page last reviewed: October 17, 2007
Page last updated: October 17, 2007
Content source: National Center on Birth Defects and Developmental Disabilities
Content owner: National Center for Health Marketing
URL for this page: http://www.cdc.gov/DataStatistics/2007/physicalactivity/