U.S. Department of Labor
Office of the Assistant Secretary for Policy
www.dol.gov/asp
Search / A to Z Index
Find It!:
By Topic
|
By Audience
|
By Top 20 Requested Items
|
By Form
|
By Organization
|
By Location
October 5, 2008
DOL Home
>
OASP
>
Chartbook of International Labor Comparisons
> Chart 4.5
CHART 4.5
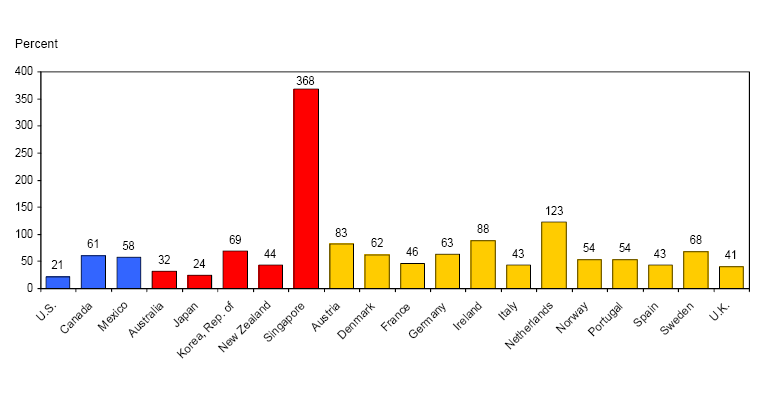
Trade in goods as a percent of GDP, 2005
This indicator shows the relative importance of trade in goods to an economy; the United States and Japan had the lowest ratios.
The relatively high figures for Singapore and the Netherlands reflect their status as platforms for re-exports and trans-shipments.
Text only
SOURCE:
World Bank.