|
North Pole Weather Data from 2005 Deployment
In April 2005, PMEL deployed a weather station, radiometer buoy,
and a CRREL thermistor buoy at Borneo ice camp near the North Pole,
as part of the North
Pole Environmental Observatory. These instruments transmit data
via satellite using the ARGOS system. Plots of their data, updated
roughly every week, will be displayed on these pages.
Weather data plot
Ice-temperature plot
Map of station drift
Weather plot: This plot presents incoming short-wave solar radiation measured by one of the radiometer buoys, along with air temperature, air pressure, and winds measured by the meteorological station. The last transmission from the radiometers was on December 31.
Download preliminary data: 22207_plot.wx 22204_roger.rad (click for header information)


Ice-temperature plot: Plots of air, ice, and ocean temperature as measured by Mass Balance buoys developed by CRREL. The buoys at the Borneo site were funded through PMEL.
We plot the snow-pinger data above the contour and the underwater pinger data below the contour. The pingers are instruments which measure their distance from a solid surface - the snow or ice. They therefore show how much snow and ice are being melted from (or added to) the upper and lower surfaces of the ice.
The thermistor buoy is still transmitting, but the data it sends are mainly missing-data codes.
Download preliminary ice-temperature data (Borneo): 09114.cplot (see Note) (click for header information)
Note: File 09114.cplot has been edited. The thermistors at 80, 90, 100, and 120 cm (near the ice surface) began to show temperatures above 3C in early July. Adjoining thermistors did not reach these temperatures, and the weather station temperatures were generally between -1C and +0.5C.

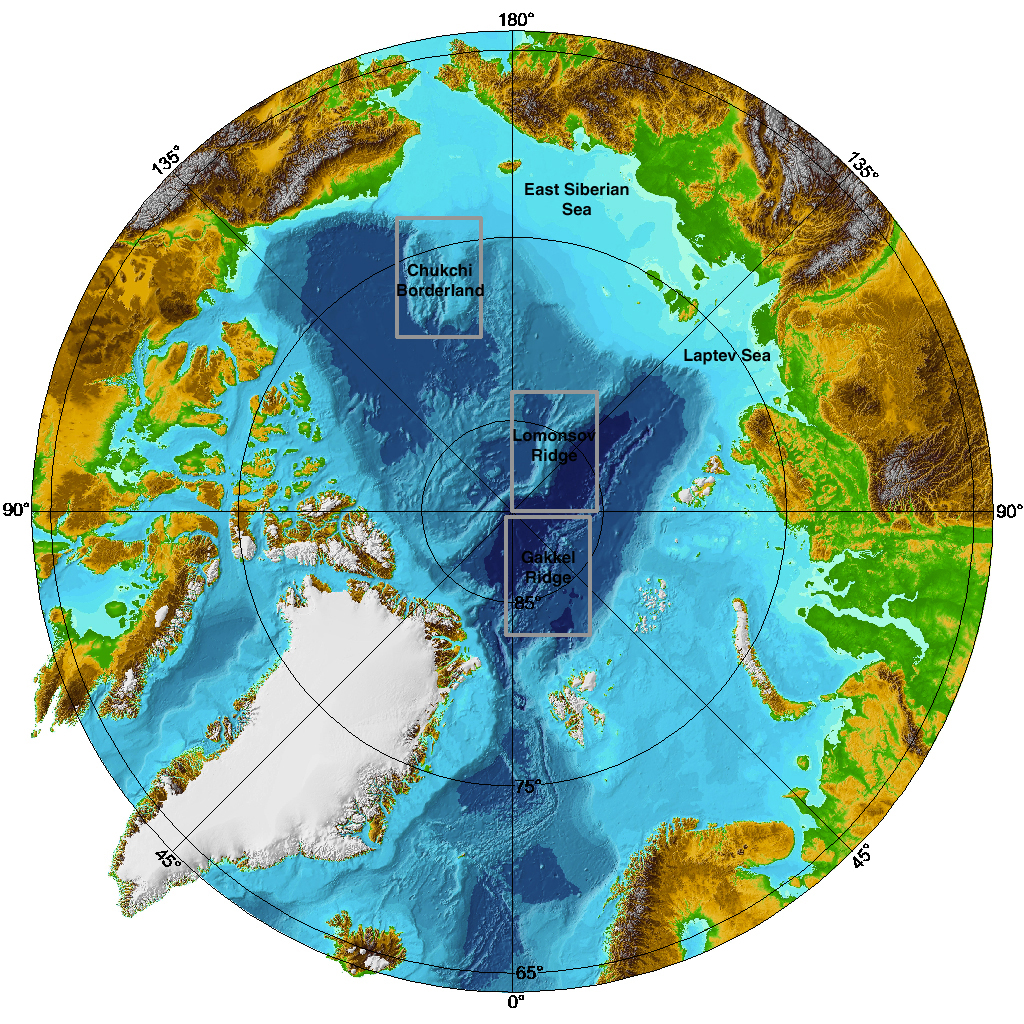
Map of station drift: Drift of the North Pole station since its deployment in April 2005. Station locations are obtained from the ARGOS system. Jamstec deployed its instruments at the Borneo site this year, and we did not set out buoys for the International Arctic Buoy Program as we did last year. The buoys are now in a narrow band of ice east of Greenland and are sustaining damage from ice deformation or waves. The final transmission from the weather station was on January 20.

Click here to calculate sunrise/sunset times for any location on the earth.
More Information :
|


