|
||||||||||
|
||||||||||
|
|
|
Crime trends |
||||
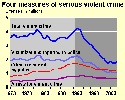
| Serious violent crime |
||||
|
|
Serious violent crime levels declined since 1993. | |||
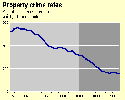
| Property crime rates |
||||
|
Property crime rates continue to decline. | |||
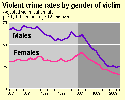
| Gender of violent crime victims |
||||
|
Violent crime rates declined for both males and females since 1994. |
|||
| Firearm-related crime |
||||
|
Firearm-related crime has plummeted since 1993, then slightly increased in 2005. |
|||
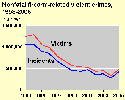
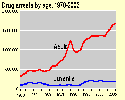
| Drug arrests |
||||
|
The estimated number of arrests for drug abuse violations for adults has been increasing, while the number for juveniles stabilized. | |||
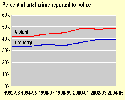
| Reporting to the
police |
||||
|
The percentage of crimes reported to the
police has been increasing. |
|||
Trends in Federal investigations and prosecutionsSee also Federal justice statistics |
||||
| Outcomes of Federal
court cases |
||||
|
The proportion of those convicted in Federal court who are sentenced to prison has been increasing. |
|||
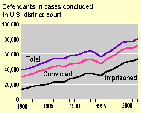
| Federal court cases
by offense type |
||||
|
Of cases concluded in Federal district court since 1989, drug cases have increased at the greatest rate. |
|||
Trends in Felony convictions in State courtsSee also Criminal sentencing |
||||
| Convictions in
State courts |
||||

|
The number of adults convicted of a felony in State courts has been increasing. |
|||
| Sentences in State
courts |
||||
|
Over two thirds of the felons convicted in State courts were sentenced to prison or jail. |
|||
Correctional trends |
||||
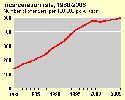
| Correctional populations |
||||

|
The number of adults in the correctional population has been increasing. | |||
| Prison population
by conviction offense |
||||
|
Prisoners convicted of a violent offense make up over half of the prison population |
|||
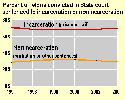
| Incarceration rate |
||||
|
After sharp increases in the 1980s and 1990s, the incarceration rate has recently grown at a slower pace. | |||
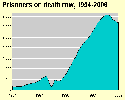
| Prisoners
under sentence of death |
||||
|
The number of prisoners under sentence of death decreased for the sixth consecutive year in 2006. |
|||
| Prisoners
under sentence of death by race |
||||
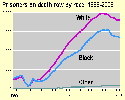
|
Since the death penalty was reinstated by the Supreme Court in 1976, more than half of those under sentence of death have been white. |
|||
| Executions |
||||
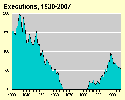
|
In 2007, 42 inmates were executed, 11 fewer than in 2006. | |||
| Suicide and homicide rates |
||||
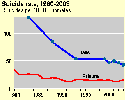
|
Suicide and homicide rates in State prisons and jails declined. | |||
Expenditure trendsSee also Expenditure and employment |
||||
| Expenditure by
function |
||||
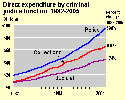
|
Direct expenditure for each of the major criminal justice functions (police, corrections, judicial) has been increasing. | |||
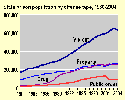
| Expenditure by level of government |
||||
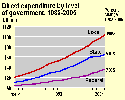
|
Local governments spend more on criminal justice than State governments or the Federal government.
|
|||
Civil justice trendsSee also Civil justice |
||||
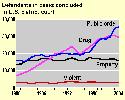
| Tort
cases filed in 15 States |
||||
|
The number of tort cases filed in 15 States increased through 1996, than decreased but has stabilized recently.
|
|||
| Tort cases concluded
by trial in U.S. district courts |
||||

|
Since its peak in 1985, the number of tort trials terminated in U.S. district courts declined. | |||
| BJS home page | Top of this page |