Issues in Focus
Introduction
Each year, this section of the AEO provides in-depth discussions on topics of special interest that may affect annual projections, including significant changes in assumptions and recent developments in technologies for energy production, supply, and consumption. In view of recent increases in construction costs, including the costs of constructing power plants, refineries, and other energy-related facilities, this year’s topics include a discussion of cost trends and the implications for energy markets. Other issues discussed this year include the implications of increased reliance on natural gas in the electricity generation sector, warming weather trends and their effects on energy demand, LNG imports, and world oil prices and production trends.
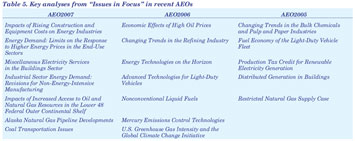
The topics explored in this section represent current, emerging issues in energy markets; but many of the topics discussed in AEOs published in recent years are relevant today. Table 5 provides a list of titles from the 2005, 2006, and 2007 AEOs that are likely to be of interest to today’s readers. They can be found on EIA’s web site at www.eia.doe.gov/oiaf/aeo/otheranalysis/aeo_analyses. html.
Impacts of Uncertainty in Energy Project Costs
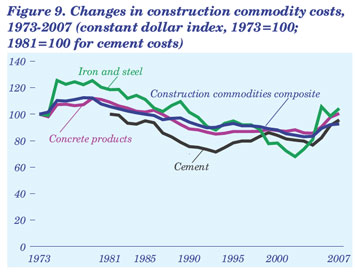
From the late 1970s through 2002, steel, cement, and concrete prices followed a general downward trend. Since then, however, iron and steel prices have increased by 8 percent in 2003, 10 percent in 2004, and 31 percent in 2005. Although iron and steel prices declined in 2006, early data for 2007 show another increase. Cement and concrete prices, as well as the composite cost index for all construction commodities, have shown similar trends but with smaller increases in 2004 and 2005 (Figure 9).
Recent increases in the costs of basic commodities and increases in capital costs for energy equipment and facilities could have significant effects on future energy supplies and consumption. Higher capital costs could change both the competition among fuels and technologies and the marginal costs of new energy supplies. In the electric power sector, for example, capital costs are generally lower for generating plants that use fossil fuels than for plants that use nuclear or renewable fuels. If capital costs increased on a proportional basis for plants of all types, then capital-intensive nuclear and renewable power plants would become even less competitive with fossil-fired plants when new capacity is planned. In addition, over the long term, higher capital costs would lead to higher energy prices, which in turn could slow the growth of energy consumption.
The AEO2008 version of NEMS includes updated assumptions about the costs of new power plants, the costs of drilling and pipeline construction in the oil and natural gas industry, refinery costs, and capital costs in the LNG supply chain. In the reference case, energy project costs are assumed to level off over the long term. To examine the effects of different assumptions about future costs, high and low energy project cost cases were developed, assuming higher and lower costs than in the reference case.
Power Plant Construction
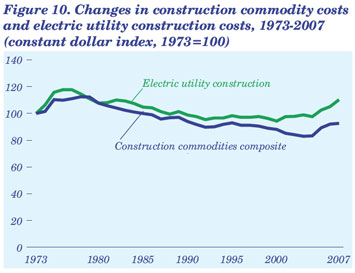
In the electric power industry, cost estimates for individual construction projects to be completed over the next decade have increased by 50 percent or more in recent years [53]. Increased costs have been reported for power plants of all types, including coal, nuclear, natural gas, and wind. The Handy-Whitman index for electric utility construction (which is used as a proxy for all electric power industry projects) provides an average cost index for six regions in the United States, starting from 1973. A simple average of the regions is used in Figure 10 to show the national trend for power plant construction relative to the cost index for construction materials. The two indexes diverge in the early 2000s, when power plant construction costs began to show a flat to slightly increasing trend, while general construction costs continued to decline. With the sharpest increases in electric utility construction costs occurring over the past 3 years, the electric utility construction cost index for 2007 is 17 percent higher than its low point in 2000.
Oil and Natural Gas Industry
Exploration and Production
According to the American Petroleum Institute’s Joint Association Survey of Drilling Costs (JAS), the average real cost of drilling an onshore well almost doubled in 2004 and increased by another 10 percent in 2005. The increases are attributable in part to the increased drilling activity brought on by higher prices for crude oil and natural gas; however, there is a great deal of uncertainty as to whether the recent escalation in drilling costs represents a fundamental shift in the drilling services industry or is a temporary aberration that will be corrected in the near term.
Natural Gas Pipelines
Historical trends in pipeline construction costs are more difficult to identify, because the cost data are not readily available; however, average real capital costs for lower 48 pipeline construction appear to have increased by some 70 percent over the past 3 years. Anecdotal evidence suggests that new estimates for the cost of constructing an Alaska pipeline are 50 percent higher than the estimates published in May 2002, and estimates for a Mackenzie Delta pipeline also are higher than the preliminary estimates from 2003.
LNG Facilities
Construction cost estimates for new natural gas liquefaction facilities scheduled to come on line between 2008 and 2011 increased by 50 percent in 2006 relative to those reported a year earlier for the same period. Some of the increase may be due to strong growth in demand for LNG liquefaction capacity. This cost pressure will not persist as markets adjust and additional projects are announced and completed; however, a portion of the increase is due to increased material costs, shortage of experienced workers, and construction bottlenecks that are likely to persist or take longer to resolve. The costs for regasification facilities and receiving terminals have also increased sharply—by more than 50 percent— over the past few years. Based on contracts signed between 2000 and 2006, LNG shipping costs have also risen by more than 7 percent over the past few years.
Petroleum Refineries and Ethanol Plants The Nelson-Farrar refinery construction cost indexes, which track overall costs for refinery construction, show a 30-percent increase from 2003 to 2005 in real dollar terms. Similarly, the Chemical Engineering Plant Cost Index (CEPCI) shows a significant increase in ethanol plant construction costs over recent years. Because there has not been a significant increase in U.S. refining construction activity over the past few years, cost increases in the petroleum refining sector largely reflect higher prices for the various commodities used in the refining industry (steel, nickel, cobalt, etc.) rather than significant increases in demand for refinery services and equipment.
Case Descriptions
Reference Case
The AEO2008 reference case includes updated information on the current costs of construction and investment in the energy industry, based on recent data and estimates that show higher costs than were assumed for AEO2007. In most of the AEO2008 cases, the higher cost levels are assumed to continue throughout the projections. For the electric power sector, initial costs for all technologies are 15 percent higher than those in AEO2007 and continue to be higher throughout the projection, although overnight costs fall over time as a result of technology learning.
For the oil and natural gas industry, regional drilling costs are calculated annually from econometrically derived equations, which are based on historical data from the American Petroleum Institute’s JAS, and estimates of the number of wells being drilled and the average depth of each well. The cost increases seen after 2003 are represented by an explicit multiplier that captures the combined impacts of various cost factors other than drilling activity and well depth. In the reference case, the cost escalation factor is applied and held constant over the projection, but its effect is partially offset by an annual technology improvement factor that reflects learning and increased efficiency.
Pipeline construction costs are based on average construction cost data filed between 1992 and 2008, and they are assumed to remain constant through 2030. The reference case also assumes that the recent, higher estimates for an Alaska pipeline and a pipeline from the Mackenzie Delta remain constant through 2030.
Construction costs for new natural gas liquefaction facilities were increased by 50 percent in AEO2008 to match the 2006 cost estimate for facilities scheduled for completion between 2008 and 2011. The construction costs are assumed to remain constant at that level through 2015, then decline to only 15 percent above their pre-2006 levels in 2018 as the market adjusts, after which the costs are assumed to remain constant at the 2018 level through 2030. LNG shipping costs and construction costs for regasification facilities are assumed to be 15 percent and 7 percent higher, respectively, than their 2006 level throughout the AEO2008 projection.
Construction costs for refineries and for ethanol production plants are assumed to remain constant at 2006 levels through 2030, based on the Nelson-Farr index and CEPCI, respectively.
High Energy Project Cost Case
The high energy project cost case assumes that the cost of construction will continue to rise. For electricity generation plants, the base capital cost for all technologies rises at a rate of 2.5 percent per year— similar to the average increase over the past 3 years— through 2030, offset in part by learning effects.
For the oil and natural gas industry, the escalation factor for drilling costs is assumed to increase to twice its original value by 2010 and remain constant thereafter. It is offset in part by an annual technology improvement factor. Pipeline construction costs are assumed to start at the reference case level but grow to about 25 percent above the reference case level in 2030.
LNG liquefaction costs match the reference case increase through 2008 and add an additional 20 percent thereafter. Construction costs for LNG regasification facilities are 15 percent above the reference case level in 2008 and then held constant through 2030. LNG shipping costs are increased to 7 percent above the reference case level in 2008 and then held constant through 2030.
For the refining sector, construction costs are increased above the reference case level by a factor equal to the percentage difference between the 2004 and 2006 Nelson-Farrar index values and held constant. Construction costs for corn and cellulosic ethanol plants are treated similarly, using the CEPCI.
Low Energy Project Cost Case
The low energy project cost case generally assumes that the cost of construction will decline to the levels of 5 to 10 years ago. For the electricity sector, the 15-percent capital cost escalation factor included in the reference case is phased out over 10 years, so that overnight construction costs for all generating technologies
are 15 percent lower than those in the reference
case by 2017.
For the oil and natural gas industry, the drilling cost
escalation factor applied in the reference case is
phased out by 2010. Pipeline construction costs start
at the reference case level but decline gradually to
about 25 percent below the reference case level in
2030. For LNG liquefaction facilities, construction
costs are reduced gradually from those in the reference
case, returning to 2006 levels by 2015 and
remaining constant thereafter. Similarly, construction
costs for LNG regasification facilities and costs
for LNG shipping costs decline gradually from reference
case levels, return to 2006 levels by 2018, and
remain constant thereafter. Refinery construction
costs are assumed to return to 2004 levels by 2008 and
then remain constant through 2030.
Results
Electricity: Capacity Additions and Generation
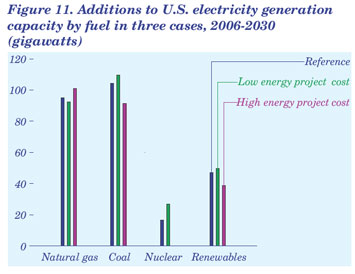
The projected mix of generating capacity types added in the electric power sector from 2006 to 2030 does not vary significantly among the reference, high energy project cost, and low energy project cost cases, because increases or decreases in construction costs have similar impacts on new builds for all technology types on a percentage basis. For example, coal-fired technologies provide about 40 percent of all new capacity additions in each of the three cases. More capital-intensive technologies, including nuclear and renewables, are affected somewhat more, however, than those with lower capital costs, including natural-gas- and coal-fired plants.
In the high energy project cost case, coal-fired capacity additions are reduced by 13 gigawatts from the reference case level, but with higher costs leading to higher electricity prices and lower demand, less new generating capacity is needed overall. As a result, the coal share of new builds remains almost the same as in the reference case. The technology most affected is nuclear power: no new nuclear capacity is built before 2030 in the high energy project cost case (Figure 11). Renewable capacity additions are 17 percent lower than in the reference case, but total generation from renewable plants is about the same in order to meet the requirements of State and regional RPS programs. The increase in renewable generation comes primarily from biomass co-firing at existing coal plants.
Because they are the least expensive to build, natural gas capacity additions increase in the high energy project cost case relative to the reference case, meeting 43 percent of new capacity needs. As a result, natural- gas-fired generation in 2030 is 22 percent higher than in the reference case. Average electricity prices in 2030 are 9 percent higher in the high energy project cost case than in the reference case.
In the low energy project cost case, more capacity of all types except natural gas is added over the projection period. The largest increase is in nuclear capacity additions, which are 10 gigawatts higher than in the reference case. Because capital costs make up a smaller share of total costs for natural-gas-fired capacity additions than for other technologies, they are slightly less economical in the low energy project cost case and about 3 gigawatts lower than in the reference case. The fuel shares of total generation in 2030 are similar in the low energy project cost case and the reference case, with a small decrease in the natural gas share (to 13 percent, compared with 14 percent in the reference case). The nuclear share of total generation increases from 18 percent in the reference case to 19 percent in the low energy project cost case. Electricity prices in 2030 are 4 percent lower in the low energy project cost case than in the reference case.
Natural Gas: Supply, Consumption, and Prices
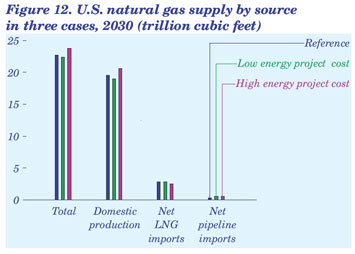
Natural gas supply volumes are determined primarily by consumption levels, particularly for electric power generation. Capital costs play a role in determining the relative shares of total supply derived from conventional, unconventional, LNG imports, and other supply categories.
Total domestic natural gas production in 2030 differs by 1.6 trillion cubic feet between the low and high energy project cost cases (Figure 12). Lower 48 onshore production differs by 1.1 trillion cubic feet between the two cases, with conventional and unconventional production accounting for 0.6 and 0.5 trillion cubic feet of the total difference. Production from Alaska and offshore production differ by 0.4 and 0.2 trillion cubic feet, respectively, between the low and high energy project cost cases.
In 2030, total net natural gas imports are 3.1 trillion cubic feet in the high energy project cost case and 3.4 trillion cubic feet in the low energy project cost case. LNG imports account for more than 80 percent of total net natural gas imports in all the cases, and the capital costs for LNG facilities are by far the largest component of LNG supply costs. Net LNG imports are 2.5 trillion cubic feet in 2030 in the high energy project cost case, compared with 2.8 trillion cubic feet in the low energy project cost case. The picture for net pipeline imports of natural gas from Canada and Mexico is more complex. In the reference case, because recent cost estimates indicate that a Mackenzie Delta pipeline would not be economical to build [54], net pipeline imports total only 0.3 trillion cubic feet in 2030. In the low energy project cost case, a Mackenzie pipeline would begin operation in 2014, providing about 420 billion cubic feet per year through 2030; as a result, net pipeline imports to the United States total 0.5 trillion cubic feet in 2030. In the high energy project cost case, with higher U.S. prices for natural gas inducing more production and exports from Canada, net U.S. pipeline imports total 0.6 trillion cubic feet in 2030.
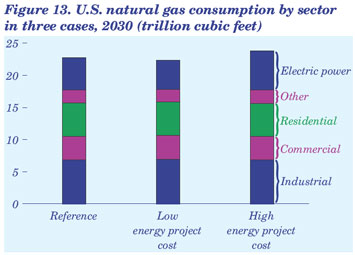
Differences in total natural gas consumption in the energy project cost cases are determined primarily by the different amounts used for electricity generation. Because coal, nuclear, and renewables are more competitive with natural gas in the low energy project cost case and capture a larger share of new capacity additions, natural gas consumption in the electric power sector in 2030 is 0.4 trillion cubic feet lower than the reference case projection of 5.0 trillion cubic feet (Figure 13).
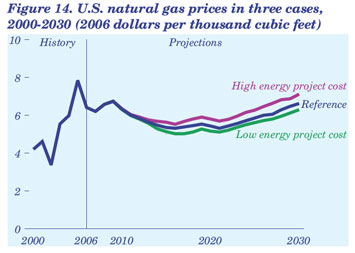
As a result of the lower level of natural gas use for electricity generation in the low energy project cost case, total domestic natural gas consumption and prices in 2030 are lower than in the reference case: consumption by 0.3 trillion cubic feet (from 22.7 trillion cubic feet in the reference case) and wellhead gas prices by $0.33 (2006 dollars) per thousand cubic feet (from $6.63 in the reference case) (Figure 14).
In the high energy project cost case, new natural-gasfired electricity generation capacity is considerably less expensive than competing technologies, and the natural gas share of capacity additions increases, resulting in higher total consumption and prices for natural gas than in the reference case. The increase in consumption for electricity generation leads to higher total domestic consumption (by 1.1 trillion cubic feet) and higher price levels (by $0.49 per thousand cubic feet) for natural gas than in the reference case. Because of the higher prices, natural gas consumption in the residential, commercial, and industrial sectors in 2030 is lower than projected in the reference case.
Petroleum Liquids Supply
A large part of the domestic oil resource base has been produced, and new oil reservoir discoveries are expected to be smaller, more remote (offshore deepwater, for example), and more costly to exploit. With a few exceptions—namely, deepwater Gulf of Mexico and offshore Alaska—the remaining domestic petroleum basins have been significantly depleted. Consequently, EOR using miscible CO2 is the primary extraction technique expected to keep onshore oil production at a relatively high level through 2030. The assumptions in the low and high energy project cost cases were applied only to the domestic resource. Depletion of domestic oil resources constrains the high and low energy project cost assumptions from having a significant impact on domestic oil production. The low and high energy project cost cases would show larger impacts if the assumptions were applied to world liquid supplies.
A slow, continuous decline in oil production is projected for the onshore United States, even with the relatively high oil prices [55]. Future domestic onshore oil production is dominated by large oil fields that were discovered decades ago, and EOR only extends their productive life. For example, although the Prudhoe Bay Field started production in 1976, the largest share of Alaska’s oil production still comes from Prudhoe Bay. Although large oil fields on Alaska’s North Slope came into production more recently [56], the long-term trend is for Alaska’s oil production to decline as the Prudhoe Bay Field declines. The AEO2008 reference case and low and high energy project cost cases include constant or declining U.S. oil production, as smaller and smaller new fields come into production while the larger existing fields continue to be depleted [57].
In the low energy project cost case, total domestic oil production in 2030 is 18,000 barrels per day higher than projected in the reference case. In the high energy project cost case, higher drilling costs reduce both the rates of return on oil production and the cash flow of oil producers, and as a result total domestic production in 2030 is about 300,000 barrels per day lower than in the reference case.
Because EOR is highly capital-intensive, most of the variation in domestic oil production across the three cases reflects differences in EOR production. In the reference case, CO2 EOR production in 2030 totals 1.31 million barrels per day, as compared with 1.33 million barrels per day in the low energy project cost case and 980,000 barrels per day in the high energy project cost case.
For deepwater production in the Gulf of Mexico, the reference case projects an increase from about 970,000 barrels per day in 2006 to 2.0 million barrels per day from 2013 through 2019, followed by a decline to 1.6 million barrels per day in 2030. The projections in the low energy project cost case are nearly the same, because the constraints on deepwater development are not prices and costs but long development lead times and limited infrastructure. In the high energy project cost case, the capital intensity of deepwater development constrains oil production in the Gulf in the earlier years, with a peak production level of 1.9 million barrels per day from 2013 through 2019. As oil prices increase later in the projection period, however, small deepwater fields that were uneconomical in earlier years begin to be developed. In 2030, deepwater production in the Gulf is about 30,000 barrels per day higher in the high energy project cost case than projected in the reference case [58].
Both CTL and BTL production are also capitalintensive and vary significantly on a percentage basis across the three cases. Combined production from CTL and BTL facilities is about 620,000 barrels per day in 2030 in the low energy project cost case, compared with 510,000 barrels per day in the high energy project cost case.
The only other petroleum supply category significantly affected in the energy project cost cases is natural gas liquids (NGL). In the high energy project cost case, which projects considerably more natural gas production than the low case, NGL production is also higher, at 1.6 million barrels per day, compared with 1.5 million barrels per day in the low case. As a result, the difference in combined CTL and BTL production between two cases is almost completely offset by the difference in NGL production.
Crude oil prices are not projected to vary significantly across the three cases. The reference case projects a price of $70.45 per barrel for low-sulfur light crude oil in 2030 (2006 dollars), compared with $70.33 per barrel in the low energy project cost case and $70.65 per barrel in the high energy project cost case. Accordingly, total domestic consumption of petroleum liquids does not vary by much, at 22.7 million barrels per day in the high energy project cost case and 22.8 million barrels per day in the low energy project cost case. Imports of crude oil and liquid fuels make up the difference between the projections for liquids production and consumption in each case, varying from 55.5 percent of total U.S. supply in 2030 in the high energy project cost case to 54.0 percent in the low energy project cost case. As noted above, the impacts would be more significant if the assumptions in the low and high energy project cost cases were applied to global markets.
Limited Electricity Generation Supply and Limited Natural Gas Supply Cases
Development of U.S. energy resources and the permitting and construction of large energy facilities have become increasingly difficult over the past 20 years, and they could become even more difficult in the future. Growing public concern about global warming and CO2 emissions also casts doubt on future consumption of fossil fuels—particularly coal, which releases the largest amount of CO2 per unit of energy produced. Even without regulations to limit greenhouse gas emissions in the United States, the investment community may already be limiting the future use of some energy options. In addition, there is considerable uncertainty about the future availability of, and access to, both domestic and foreign natural gas resources.
To examine the effects of uncertainty about future supplies of electricity and natural gas, three alternative cases were developed for AEO2008. The limited electricity generation supply case assumes that higher construction and operating costs together with other factors, such as lack of public acceptance, will limit the use of energy sources other than natural gas for power generation—including coal without CCS technology, nuclear power, and renewable fuels. The limited natural gas supply case assumes that no Arctic natural gas pipeline will be in operation before 2030, the availability of LNG to U.S. regasification terminals will be limited, the U.S. oil and natural gas resource base will be less than in the reference case, access to the resource base will be more limited than assumed in the reference case, and that improvements in oil and natural gas exploration and development technologies will be slower than in the reference case. Finally, a combined limited case includes all the assumptions from the first two cases.
Assumptions
Limited Electricity Generation Supply Case
In the AEO2008 reference case, based on existing laws and regulations, the use of natural gas for electricity generation continues to increase in the near term, then declines as generators increasingly turn to coal, renewables, and new nuclear power capacity in the longer term. New coal-fired capacity without CCS could be limited, however, by policy changes aimed at limiting CO2 emissions. Several States already are beginning to implement emission reduction programs, and the U.S. Congress is discussing potential Federal programs. In California and Washington State, recent legislation has set emission standards for electric power plants that would preclude new coal-fired plants without CCS from providing power to those States (see “Legislation and Regulations”). There are also several proposals at the Federal level that would impose caps on CO2 emissions. The limited electricity generation supply case, in addition to assuming that new coal-fired power plants without CCS cannot be built, also assumes that construction costs for new plants with CCS will be 25 percent higher than in the reference case.
Currently, new nuclear capacity is being proposed in response to incentives provided in EPACT2005, rising fossil fuel prices, and concerns about CO2 emissions; however, there continue to be concerns about nuclear waste disposal, public acceptance, and the ability to build new plants on time and within budget. It is likely that some new nuclear plants will be built, given current interest levels and financial incentives, but if early builds encounter delays in construction or licensing or significant cost overruns (as occurred with the first generation of nuclear plants), the longterm potential for nuclear electricity in the United States could be reduced.
The limited electricity generation supply case assumes the same amount of new nuclear capacity as in the reference case by 2030; however, in circumstances where the reference case assumes that current capacity factors, averaging over 90 percent nationally, will be maintained throughout each plant’s 60-year lifetime, the limited electricity generation supply case assumes that the national average capacity factor for nuclear power plants will fall to 70 percent in 2030. To date, no nuclear power plant has operated for 40 years, and industry experience in maintaining older nuclear plants is limited. Thus, it is possible that replacement of major components on older plants could cause significant outages, or that gradual breakdowns could lead to lower capacity factors.
Adding large amounts of economical renewable capacity may also face challenges. The reference case projects a large increase in renewable capacity (mostly wind and biomass), mainly to meet the requirements of State RPS programs. There is also some public resistance to the siting of new wind and biomass plants, however, and their costs may increase after the “best” sites have been used. The limited electricity generation supply case assumes the same amounts of new wind and biomass capacity as in the reference case, but the availability of new biomass energy crops is delayed until 2020, compared with 2010 in the reference case. Biomass gasification technology is a new, unproven design that could run into delays and cost overruns, and in addition it could take many years to develop the infrastructure to grow, cultivate, harvest, and transport new energy crops. The costs for all other new renewable capacity (geothermal, landfill gas, solar thermal, and solar PV) are assumed to be 25 percent higher than in the reference case. Again, these technologies are new, and there is considerable uncertainty about initial cost estimates.
Limited Natural Gas Supply Case
The limited natural gas supply case represents an environment in which numerous natural gas supply options are unavailable, less available, or more costly to develop than in the reference case.
Among the most significant uncertainties for future natural gas supply are the development of natural gas pipelines in the Arctic region of North America, the future availability of LNG imports, the size of the domestic natural gas resource base, and the rate of technological improvement in the industry. Currently, two large natural gas pipelines are under consideration for development in the Arctic region: a Mackenzie Delta pipeline in Canada and an Alaska pipeline [59], both of which are large, expensive construction projects. It is expected that 6 years will be required to permit, license, design, construct, and open the Mackenzie pipeline and 9 years will be required to do the same for the Alaska pipeline. A number of factors could delay completion of the projects beyond 2030, however, including: higherthan- expected construction costs that would make the pipelines unprofitable throughout the projection period; higher-than-expected State and Provincial taxes and royalties on natural gas production; environmental concerns requiring expensive remediation; delays in regulatory approval and permitting; and difficulties in addressing the concerns of native peoples whose lands are crossed by the pipelines. Accordingly, the limited natural gas supply case assumes that neither pipeline will be opened before 2030.
The future availability of LNG imports depends critically on the development of new LNG supply sources throughout the world, which in turn will require the construction of large, expensive liquefaction facilities and LNG tankers. Typically their financing is supported by multi-decade contract commitments from large natural gas consumers, such as natural gas and electric utilities; however, those large consumers face considerable uncertainty of their own, including whether new nuclear generating capacity will reduce long-term requirements for natural gas supply, whether alternative supplies will be available from other sources at lower prices, and whether suitable pricing mechanisms will be available to ensure that LNG suppliers earn a reasonable rate of return while the consumers pay prices that are reasonable in comparison with the prices of other sources of natural gas supply.
It is possible that potential LNG suppliers could face considerable difficulty in obtaining customer commitments sufficient to support the financing required for development of LNG supplies that are able to satisfy world demand for natural gas. Further, if LNG supplies are scarce relative to world demand, overseas natural gas prices could exceed U.S. domestic prices, drawing LNG supplies away from the U.S. market. Alternatively, new sources of LNG supply could be fully committed to overseas customers under long-term contracts, making spot purchases of LNG either unavailable or prohibitively expensive.
Availability of supplies could also be limited by policies adopted by the countries that produce LNG. For example, LNG producers could operate in concert to limit LNG supplies in order to increase prices or to make more natural gas available to their own consumers. They might also adopt production taxes, excise taxes, and tariffs that would make LNG economically unattractive in the United States.
The LNG assumptions used in the limited natural gas supply case are identical to those used in the low LNG case (discussed later in “Issues in Focus”), with U.S. gross imports of LNG held constant at 1.0 trillion cubic feet per year from 2009 through 2030 [60]. The LNG restrictions apply to the United States only; LNG imports to Canada and Mexico remain sensitive to prices, and new LNG import capacity is assumed to be constructed in those countries according to predetermined price triggers.
The actual size of the domestic oil and natural gas resource base is another source of uncertainty. The USGS and Minerals Management Service (MMS) calculate the U.S. undiscovered oil and natural gas resource base on a probabilistic basis, reporting a mean estimate, a 95-percent probability estimate, and a 5-percent probability estimate of technically recoverable oil and natural gas resources in each major U.S. petroleum basin. As an example, for the U.S. lower 48 onshore basins, the USGS mean probability estimate of undiscovered natural gas resources is 483 trillion cubic feet, the 95-percent probability estimate is 291 trillion cubic feet, and the 5-percent probability estimate is 735 trillion cubic feet [61], illustrating the wide range of uncertainty with regard to the size of the U.S. oil and natural gas resource base.
The AEO2008 reference case assumes that the technically recoverable U.S. oil and natural gas resource base is equal to the USGS and MMS mean estimates. Given the uncertainty inherent in those estimates, however, the actual resource base could be considerably smaller. Further, the ability to develop the resource base could be limited by other factors, including the possibility that future laws and regulations could place more Federal and State land off limits to oil and natural gas production. The limited natural gas supply case assumes that the U.S. unproven oil and natural gas resource base and Canada’s undiscovered natural gas resource base are 15 percent smaller than the estimates used in the reference case.
Another factor that could reduce available natural gas supplies is a slowdown in the rate of technological progress. Technological progress generally reduces the cost of finding, developing, and producing natural gas resources. In addition to their direct impacts on costs, technology improvements can increase finding and success rates, which have an impact on the average costs of production. A slower rate of progress results in higher capital and operating costs for oil and natural gas exploration and development than would otherwise be the case. The limited natural gas supply case assumes a technological progress rate that is one-half the rate in the reference case.
Results
Electricity Generation
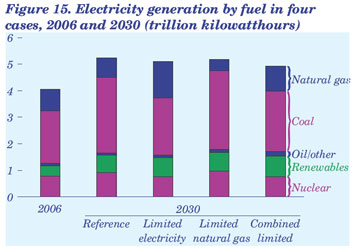
In 2006, coal-fired power plants supplied 49 percent of U.S. electricity generation. In the AEO2008 reference case, coal’s market share is maintained through 2020 and grows to 54 percent in 2030, primarily as a result of projected increases in natural gas prices. In the limited electricity generation supply case, natural gas supplies are unchanged from those in the reference case, while generation from other fuels is constrained. As a result, the coal share of total generation drops to 42 percent in 2030, and the natural gas share increases from 20 percent in 2006 to 27 percent in 2030, as compared with 14 percent in 2030 in the reference case (Figure 15). By assumption, nuclear, wind, and biomass remain at or below reference case levels from 2006 through 2030, while generation from other renewables and from oil increases slightly. Although delivered natural gas prices to the electric power sector in 2030 are 16 percent higher in the limited electricity generation supply case than in the reference case because of higher demand, the price increase is not enough to shift generation from natural gas to the competing technologies.
In the limited natural gas supply case, no constraints are assumed for any electricity generation technology relative to the reference case, but natural gas supplies are limited. As a result, in 2030, delivered natural gas prices to the electric power sector are 39 percent higher than in the reference case, and natural-gasfired generation is 42 percent less than in the reference case. With no technology restrictions, natural gas is displaced by increases in the use of coal, nuclear, and some renewables (geothermal, biomass, and wind) for electricity generation.
In the combined limited case, all the fuel choices for electricity generation are more expensive than in the reference case. Natural-gas-fired generation in 2030 is higher than in the reference case, but with higher natural gas prices (84 percent higher than those in the reference case) the difference is smaller than in the limited electricity generation supply case. Coalfired plants with CCS are built, increasing the demand for coal, and investment in new renewable technologies increases, including geothermal and offshore wind. Oil-fired generation also increases substantially, because it is less expensive to use distillate than natural gas even in some newer combined-cycle plants. Total electricity generation is 6 percent lower in the combined limited case than in the reference case, as higher costs for fuel and for plant construction result in higher prices and lower demand for electricity.
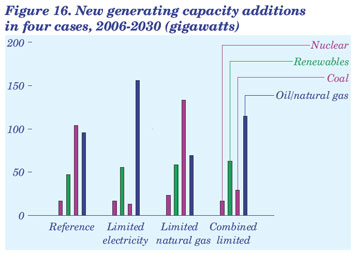
The technology mix for new capacity additions differs dramatically among the three limited cases (Figure 16). In the limited electricity generation supply case, the only new coal-fired builds are those currently under construction, and almost all the additional coal-fired plants projected to be built in the reference case are replaced by new natural-gas-fired capacity (an additional 60 gigawatts). Nuclear generating capacity is the same as in the reference case, and renewable capacity additions are 8 gigawatts higher.
In the limited natural gas supply case, higher natural gas prices reduce natural-gas-fired capacity additions, while additions of coal-fired, renewable, and nuclear capacity increase relative to the reference case. Because more older generating units are retired in the limited natural gas supply case (primarily, those using natural gas) more new capacity is added than in the reference case.
In the combined limited case, 17 gigawatts of new coal-fired capacity with CCS is built. Natural-gasfired capacity also increases relative to the reference case, but by a smaller amount than is projected in the limited electricity generation supply case. More new capacity using renewable technologies that are not constrained by assumption, including geothermal, landfill gas, and offshore wind, is built in the combined case than in the reference case, even though their construction costs are assumed to be higher than in the reference case.
Natural Gas Consumption
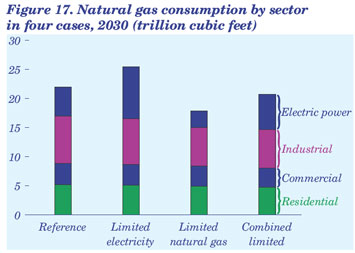
Natural gas consumption for electric power generation in 2030 varies widely across the cases, from 43 percent below the reference case level in the limited natural gas supply case to 78 percent above the reference case level in the limited electricity generation supply case (Figure 17). The largest difference from the reference case is in the limited electricity generation supply case, because constraints on competing fuels, such as the CCS requirement for new coal-fired plants, make natural gas the fuel of choice for new capacity.
In the limited electricity generation supply case, natural gas consumption for electricity generation is 3.9 trillion cubic feet above the reference case level in 2030, while total U.S. natural gas consumption in 2030 is only 3.6 trillion cubic feet higher than in the reference case. Higher natural gas prices in the limited electricity generation supply case reduce residential, commercial, and industrial natural gas consumption in 2030 by a total of 0.4 trillion cubic feet from the reference case projection.
In the limited natural gas supply case, where only natural gas supply is constrained, higher natural gas prices cause natural gas to lose market share in all the end-use consumption sectors. In 2030, total natural gas consumption is 3.8 trillion cubic feet less in the limited natural gas supply case than in the reference case. In the electric power sector, which is particularly fuel flexible and price sensitive, natural gas consumption in 2030 is 2.2 trillion feet lower than in the reference case.
In the combined limited case, total natural gas consumption in 2030 is 3 percent lower than projected in the reference case, although natural gas use for electricity generation is 21 percent (1.1 trillion cubic feet) higher than in the reference case. In comparison, natural gas consumption in the electric power sector in 2030 is 3.9 trillion cubic feet higher in the limited electricity generation supply case and 2.2 trillion cubic feet lower in the limited natural gas supply case than in the reference case. The constraints on other sources of electricity generation in the limited electricity generation supply case thus have a much more pronounced effect on natural gas consumption in the electric power sector than do the natural gas supply constraints in the limited natural gas supply case.
In all three cases, higher natural gas prices reduce natural gas consumption in the residential, commercial, and industrial sectors relative to the reference case. In the combined limited case, natural gas consumption in the end-use sectors in 2030 is 14 percent lower than in the reference case. In the short term there is little potential in those sectors for fuel switching, which generally occurs only over the long term as older equipment is retired. In the residential and commercial sectors, most of the reduction in natural gas consumption in the three cases results from conservation and more efficient appliances. In the industrial sector, where there is some fuel-switching capability, part of the decrease is attributable to fuel substitution. In addition, although not quantified here, higher prices could drive some industrial users to either shut down operations or move them outside the United States to locations where fuel and other operating costs are lower.
In the end-use sectors, the largest reduction in natural gas consumption occurs in the combined limited case, because the highest natural gas prices are also projected in the combined case. In 2030, natural gas consumption is 19 percent lower in the industrial sector, 8 percent lower in the residential sector, and 10 percent lower in the commercial sector than projected in the reference case.
Natural Gas Supply
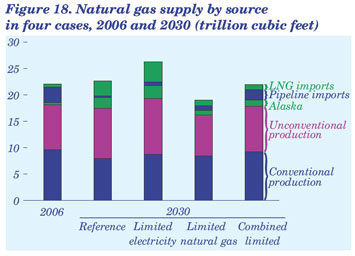
As consumption patterns shift across the cases, the mix of natural gas supply sources changes considerably (Figure 18). These changes are dictated largely by the natural gas supply conditions assumed in the limited natural gas supply case and in the combined limited case, which assumes that no Alaska natural gas pipeline is built and that gross LNG imports do not increase after 2009. Consequently, in these two cases, lower 48 sources provide most of the incremental natural gas supply. In the limited electricity generation supply case, all natural gas sources contribute to incremental supply in 2030. The largest increase is 1.1 trillion cubic feet from unconventional natural gas production, which consists of tight gas, shale gas, and coalbed methane. Unconventional natural gas makes up the bulk of the undiscovered resource base and shows significant growth in the reference case projections. Conventional natural gas production (onshore and offshore) in 2030 is 0.6 trillion cubic feet above the reference case level. Alaskan production and LNG imports, which are not constrained in this case, both respond to higher prices, increasing by 0.4 and 1.0 trillion cubic feet, respectively. Offshore production is slightly higher, by 0.2 trillion cubic feet, and pipeline imports are higher by 0.4 trillion cubic feet.
In the limited natural gas supply case, where total natural gas consumption in 2030 is 3.8 trillion cubic feet less than in the reference case, the lack of an Alaska pipeline and the constraint on U.S. LNG imports account for 2.9 trillion cubic feet of the reduction in natural gas supply. Unconventional natural gas production is also reduced by 1.8 trillion cubic feet, whereas domestic production from other sources, particularly onshore conventional resources, is increased by 0.4 trillion cubic feet and pipeline imports are increased by 0.6 trillion cubic feet.
The decrease in unconventional natural gas production in the limited natural gas supply case relative to the reference case is a direct result of the changes in supply assumptions. Because the undiscovered unconventional resource base is considerably larger than the conventional resource base, the assumption of a 15-percent smaller resource base has the greatest volumetric impact on unconventional natural gas resources. Technology advances already have made most conventional supplies economically recoverable, and thus a reduced rate of technological progress has a larger impact on the cost of developing unconventional and offshore resources. Deepwater offshore resources are further constrained by infrastructure limitations and long lead times for the construction of new production platforms and pipelines. Thus, conventional production increases, unconventional production decreases, and there is only a small increase in offshore production in the limited natural gas supply case relative to the reference case.
Although the natural gas technology and resource assumptions in the limited natural gas supply case apply to Canada as well as to the United States, LNG imports into Canada and Mexico are not constrained [62] and are responsive to higher prices. As a result, both countries are projected to increase their LNG imports and make more natural gas available to the U.S. market by pipeline.
In the combined limited case, net natural gas pipeline imports in 2030 are almost 6 times the reference case level. Although U.S. pipeline imports of natural gas might be expected to increase in the limited electricity generation supply case, the assumed opening of an Alaska natural gas pipeline reduces Canadian exports to the United States.
Before 2025, the largest source of incremental U.S. natural gas supply in the combined limited case is conventional lower 48 natural gas production. In 2030, however, higher natural gas prices cause net pipeline imports to become the largest source of incremental supply. Net pipeline imports in 2030 are 1.6 trillion cubic feet higher and account for slightly more than one-half of the total increase in natural gas supply in the combined limited case relative to the reference case. LNG imports into Canada and Baja California, Mexico, are 1.1 trillion cubic feet higher in the combined limited case than in the reference case in 2030, accounting for more than 50 percent of the increase in net pipeline imports. Other domestic production accounts for the remainder of the difference in incremental supply between the two cases in 2030, with onshore conventional production 1.3 trillion cubic feet higher and offshore production 0.2 trillion cubic feet higher in the combined limited case than in the reference case. The increases in domestic conventional natural gas production and pipeline imports offset declines in unconventional production and Alaska production. They also offset a decline in LNG imports that are eliminated from the combined limited case by assumption but are available in the reference case.
Natural Gas Prices
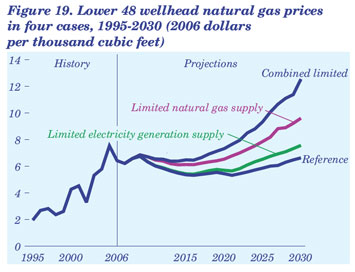
In each of the three limited cases, natural gas prices are higher than projected in the reference case (Figure 19). The assumptions for the limited natural gas supply case have a more significant impact on price than those for the limited electricity generation supply case, with natural gas wellhead prices 45 percent and 14 percent higher in 2030 than in the reference case, respectively. The largest difference from the reference case is in the combined limited case, with prices 89 percent higher than in the reference case in 2030. End-use prices for natural gas increase in response to the higher wellhead prices and moderate consumption, while price increases both result from and contribute to changes in the mix of supply sources.
The reason for the large price variations across the cases is the need to turn to more expensive sources of supply to satisfy the demand for natural gas as consumption increases and available sources of supply diminish. With the exception of Alaska and unconventional natural gas, the domestic conventional natural gas resource base is largely depleted, and only limited production increases are possible in response to consumption increases. Most of the large conventional fields have already been discovered, leaving only the smaller and deeper fields that are more costly to develop.
In the limited electricity generation supply case, which assumes the same resource base and rate of technological progress as in the reference case, unconventional natural gas production increases in response to higher prices. The assumptions for the limited natural gas supply case limit technological progress and reduce the size of the resource base, causing a much greater price increase than in the limited electricity generation supply case. Increased demand for natural gas in the limited electricity generation supply case raises the natural gas wellhead price in 2030 to $7.57 per thousand cubic feet, compared with $6.63 per thousand cubic feet in the reference case. In the limited natural gas supply case, the wellhead price in 2030 is $9.61 per thousand cubic feet, and in the combined limited case it is $12.55 per thousand cubic feet.
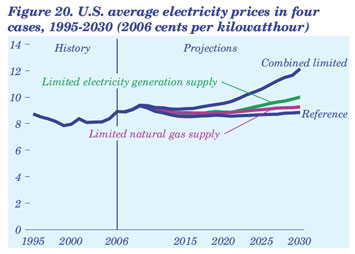
Electricity Prices
In the AEO2008 reference case, real electricity prices are projected to remain relatively flat, with the 2030 price slightly below the current price. In the three limited cases, all with higher natural gas prices, electricity prices in 2030 are 4 percent to 36 percent higher than 2006 prices (Figure 20). Electricity prices in 2030 in the limited electricity generation supply case are higher than those in the limited natural gas supply case, even though natural gas prices are lower, because there are more options to change the generation mix in the limited natural gas supply case. In the limited electricity generation supply case, with capacity additions largely restricted to natural gas technologies, electricity prices are more sensitive to changes in natural gas prices and are 13 percent higher in 2030 than projected in the reference case. In comparison, electricity prices in 2030 in the limited natural gas supply case are 5 percent higher than in the reference case. In the combined limited case, electricity prices in 2030 are 37 percent higher than in the reference case.
Trends in Heating and Cooling Degree-Days: Implications for Energy Demand
Weather-related energy use, in the form of heating, cooling, and ventilation, accounted for more than 40 percent of all delivered energy use in residential and commercial buildings in 2006. Given the relatively large amount of energy affected by ambient temperature in the buildings sector, EIA has reevaluated what it considers “normal” weather for purposes of projecting future energy use for heating, cooling, and ventilation. In AEO2008, estimates of “normal” heating and cooling degree-days are based on the population-weighted average for the 10-year period from 1997 through 2006.
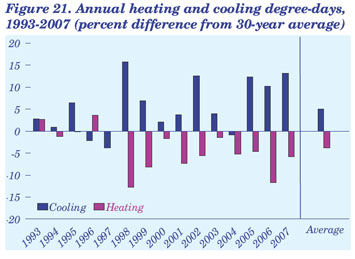
In previous AEOs, EIA used the National Oceanic and Atmospheric Administration (NOAA) 30-year average for heating and cooling degree-days as a benchmark for normal weather. Over the past several years, however, many energy analysts have questioned the use of the 30-year average, given the recent trend toward warmer weather relative to the 30-year average. Figure 21 shows percentage differences from the 30-year average in heating and cooling degreedays for the past 15 years. Over the 15-year period, only two winters have been colder, and all but three summers have been warmer, than the 30-year average; and on average, the winters have been 4 percent warmer and the summers 5 percent warmer than the 30-year average. Five of the 15 summers were more than 10 percent warmer than the 30-year average, whereas only 2 of the 15 winters were 10 percent warmer than the average, indicating a larger change for summer than for winter weather over the past 15 years. This suggests that the 30-year average is heavily weighted by years before 1993 and is less representative of heating and cooling degree-days in more recent years.
The recent changes in average heating and cooling degree-days have not only affected the accuracy of AEO projections for heating and cooling demand. Underestimating summer demand for cooling—particularly, peak demand—can undermine the plans made by electricity producers for wholesale power purchases and capacity additions. Overestimating winter demand for heating can affect plans for natural gas storage and supply. Consequently, many energy analysts have suggested that shorter time periods provide a more appropriate basis for projecting “normal” weather. For example, Cambridge Energy Research Associates, Inc., now uses a 15-year period (1991-2005) to estimate normal weather in its projections for heating and cooling degree-days [63], and NOAA, responding to customer feedback, has undertaken a process to revise its traditional 30-year average by creating “optimal climate normals” that will be more representative of current weather trends [64]. EIA decided to use the 10-year average to provide a better match with recent trends in heating and cooling degree-days.
Heating and Cooling Degree-Days in AEO2008
All the AEO2008 projections use the 1997-2006 average as a proxy for normal weather from 2009 through 2030. The 10-year average is based on heating and cooling degree-day data by State, provided by NOAA, and State population weights provided by the U.S. Census Bureau. The State population projections allow for dynamic estimates of heating and cooling degree-days at the Census Division level. Where State populations are expected to shift within and across Census Divisions, the projections for average heating and cooling degree-days at the national level can vary from year to year.
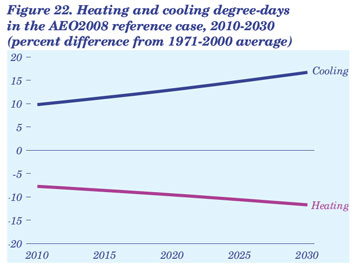
Figure 22 shows differences in heating and cooling degree-days in the AEO2008 projection for 2010-2030 from the 1971-2000 30-year average published by NOAA. (It should be noted that the projection is not based on any assumption about global warming. Rather, expected U.S. population shifts cause the numbers of average heating and cooling degree-days to change over the projection period.) In 2010, the number of U.S. cooling degree-days in the AEO2008 reference case is about 10 percent greater than the NOAA 30-year average with fixed population weights, and the number of heating degree-days is 8 percent less [65]. Accordingly, electricity providers are projected to see more peak summer demand, and direct fuel use for heating in buildings is projected to decline through 2030 as a result of State population shifts, all else being equal.
Impacts on the AEO2008 Projections
Fuel Use in Buildings and for Electricity Generation
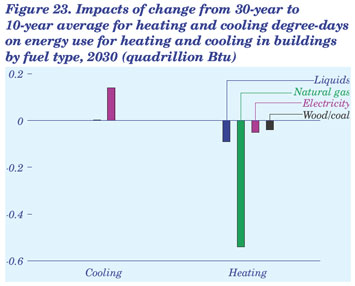
Because space heating accounts for more direct energy use in buildings than does cooling, use of the 10-year averages for heating and cooling degree-days results in a 2.4-percent net decrease (about 0.6 quadrillion Btu) in buildings sector energy consumption in 2030, as compared with the same projection based on 30-year average heating and cooling degree-days (Figure 23). For electricity providers, on the other hand, the increase in electricity use for cooling is more than the decrease in electricity use for heating, and the result is a 0.7-percent net increase (about 0.4 quadrillion Btu) in fuel use for electricity generation. The effect on total net energy consumption in the reference case is small, amounting to a 0.4-percent decrease (about 0.4 quadrillion Btu) in 2030. As a result, expenditures for energy purchases in residential and commercial buildings are 0.4 percent lower in 2030 ($1.8 billion in 2006 dollars), and total CO2 emissions in 2030 are reduced by 0.1 percent (10 million metric tons).
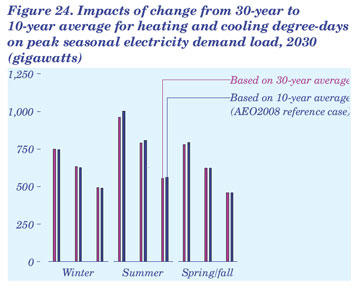
Electricity Prices
As expected, the additional summer demand for cooling that results from using the 10-year average for cooling degree-days shifts more electricity demand into the summer peak period (Figure 24). In 2030, demand in the summer peak period increases by 4.4 percent, whereas winter demand is reduced by 0.8 percent. The increase in summer peak demand leads to higher real electricity prices, with average increases of 2.3 percent for residential customers and 0.3 percent for commercial customers.
Liquefied Natural Gas: Global Challenges
U.S. imports of LNG in 2007 were more than triple the 2000 total, and they are expected to grow in the long term as North America’s conventional natural gas production declines. With U.S. dependence on LNG imports increasing, competitive forces in the international markets for natural gas in general and LNG in particular will play a larger role in shaping the U.S. market for LNG. Key factors currently shaping the future of the global LNG market include the evolution of project economics, worldwide demand for natural gas, government policies that affect the development and use of natural resources in countries with LNG facilities, and changes in seasonal patterns of LNG trade.
Changing Project Economics
From the mid-1990s through 2002, a major factor underlying the growth of global LNG markets was declining costs throughout the LNG supply chain. Since 2003, however, costs have escalated, especially in the area of liquefaction. The result has been a delay in commitments to the construction of new liquefaction capacity, which in turn creates uncertainty about the future availability of LNG supplies.
The cost of liquefaction capacity can vary widely, depending on location, quality of natural gas supplies, and plant design (including whether the planned capacity is an expansion of an existing plant or a new greenfield plant). In general, however, the available data indicate that construction costs for new liquefaction capacity have more than tripled since the early 2000s [66]. Some of the reasons for the increase are higher raw material costs for commodities such as nickel and steel, a shortage of experienced workers and contractors, full construction order books, and longer delivery times for key pieces of equipment. Although economies of scale can reduce unit costs, those reductions have not been sufficient to offset increases in other costs.
For regasification facilities and receiving terminals, the available data suggest that the construction costs for new projects have increased by more than 50 percent over the past 5 years [67]. In addition, construction costs for LNG tankers have increased by 40 to 50 percent since 2003 [68], primarily because of rising costs for materials and equipment. Wood Mackenzie reports that ship prices remain on “an upward trend driven by a surge in new orders of large tankers, bulk carriers, and containerships, which compete with LNG carriers for berth space” [69].
Worldwide Demand for Natural Gas
Contributing to the uncertainty about LNG supply availability is a worldwide increase in natural gas consumption and its effect on prices. In EIA’s International Energy Outlook 2007, annual worldwide natural gas consumption in 2030 varies by 35 trillion cubic feet between the high and low macroeconomic growth cases, or around plus or minus 11 percent when compared with the reference case [70].
For some countries, such as Japan and South Korea, relatively slow growth is expected for natural gas consumption, but because they are almost entirely dependent on LNG imports to meet natural gas demand, any increase is likely to affect LNG markets. For India and China, on the other hand, natural gas consumption has increased much more rapidly. Both countries have been actively searching for new domestic natural gas resources, and both have been pursuing pipeline projects that could bring more imported supplies to domestic consumers. China has been negotiating with Russia to obtain supplies, India has been negotiating with Iran, and both countries have been competing for pipeline supplies from Central Asia and Myanmar. The success or failure of domestic natural gas exploration efforts in India and China and the possible construction of new pipelines is likely to affect their demand for LNG imports and, ultimately, how much LNG will be available to the United States.
Currently, the Organization for Economic Cooperation and Development (OECD) countries account for the majority of LNG imports. In 2006, 12 OECD countries [71] were net importers of LNG, and they accounted for just over 90 percent of all LNG imports. Five non-OECD countries [72] accounted for the remaining 10 percent. Among the world’s net exporters of LNG, however, 11 of 12 were non-OECD countries [73], and Australia was the only OECD country with net LNG exports in 2006. At the same time, natural gas consumption has been increasing at a faster rate in the non-OECD countries than in the OECD countries as a whole.
Resource Development Policies
In addition to the uncertainty associated with natural gas demand growth and project costs, many countries that are net LNG exporters have government policies or agreements that promote domestic natural gas consumption. Any expansion (or rollback) of such policies could affect their future domestic consumption of natural gas and the supplies available for export.
Indonesia, Egypt, and Australia have or are considering domestic natural gas supply requirements for projects under development. Indonesia’s 2001 Oil and Gas Law imposes a 25-percent domestic market obligation on new contracts for natural gas production sharing, although implementation of the law is still uncertain [74]. In 2005, Egypt reduced the portion of natural gas reserves available for export from one-third to one-quarter.
Unlike Egypt and Indonesia, Australia does not have any national regulations that require natural gas resources to be reserved for domestic markets; however, the Western Australia state government has negotiated an agreement with Northwest Shelf LNG developers to reserve 4.7 trillion cubic feet of Northwest shelf natural gas for the domestic market and, more recently, has negotiated a similar agreement with Gorgon LNG developers to set aside 15 percent of reserves for the domestic market. The Western Australia government has also been considering domestic reservation requirements for all future natural gas projects that would liquefy production for export [75]. Such a requirement could discourage development of marginal export projects, leaving some resources undeveloped.
Domestic reservation requirements promote natural gas consumption by keeping domestic natural gas prices low. In addition, many countries that are net LNG exporters foster domestic consumption further by directly regulating domestic natural gas prices and keeping them below LNG net-back equivalent prices. Both China and India, two of the world’s newest LNG importers, also regulate the prices that electricity generators pay for natural gas. Without belowmarket prices, generators probably would be unable to use natural gas to generate power profitably for sale to domestic electricity markets, where prices also are regulated.
Seasonal Usage Patterns
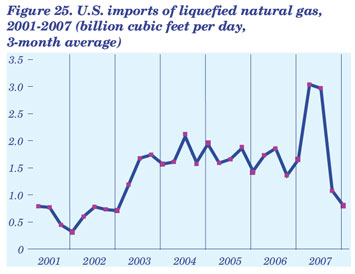
The natural gas market in North America, where indigenous production meets much of the demand for natural gas, is a large, liquid market with ample storage capacity. Thus, even during periods of relatively low demand, it can still absorb imports. There is, however, a seasonal element specific to the U.S. market (Figure 25). More LNG is imported by the United States during the summer months, for reasons related as much to conditions in other LNG-importing countries as to conditions in the United States. The conditions that make North America an attractive year-round market are not likely to change, but changing conditions in the rest of the world could reduce the availability of summer LNG imports to the United States.
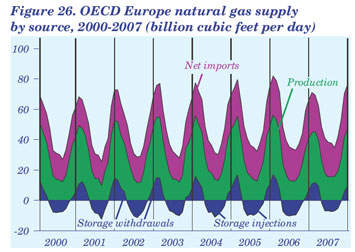
The natural gas market in OECD Europe is comparable with the North American market in size— about 71 percent as large in 2005. Whereas North America relies almost entirely on storage withdrawals to meet incremental winter demand, OECD Europe employs a variety of sources, with indigenous production, natural gas imports, and storage withdrawals all rising in the winter months to meet increased demand (Figure 26).
The United Kingdom, Belgium, and the Netherlands currently have active market-based systems for natural gas. In addition, European Union regulators are trying to introduce regulatory reform into additional markets and bring more liquidity into continental European markets. Although OECD Europe also has less storage capacity than North America, even when the relative size of annual demand in the two markets is taken into account, it has many geologic structures that could be suitable for seasonal natural gas storage. By 2015, OECD Europe could add almost 1 trillion cubic feet of additional working natural gas capacity in seasonal storage facilities [76].
The seasonal LNG supplies available to the North American market could also be affected if new importers of LNG develop in the southern hemisphere, where peak demand for heating occurs during the northern hemisphere’s summer. Argentina became the first South American country to import LNG, offloading its first partial cargo in May 2008. Argentina and its neighbors are anticipating a shortage of natural gas this winter (June-August), and Argentina is planning to import LNG on special ships with onboard regasification capability while the construction of onshore regasification terminals is being discussed.
Brazil and Chile also will soon become LNG importers. Brazil has two floating regasification and storage units on order, the first of which could begin operation on the country’s northeast coast during 2008. Chile has at least one regasification terminal in the advanced planning stage, and others are under consideration. The terminal planned for Quinteros, Chile, is expected to enter service in the second quarter of 2009 with a capacity of 2.5 million tons of LNG (116 billion cubic feet of natural gas) per year and a contract with BG Group for supply of 1.7 million tons (79 billion cubic feet) per year [77].
Implications of Uncertainty in LNG Markets
Changing expectations about global LNG demand, supply, and prices are reflected in the AEO2008 reference case. Demand for natural gas overall is lower in AEO2008 than in AEO2007 as a result of expectations for slower economic growth and higher energy prices, including natural gas prices. With the additional assumptions of higher LNG costs, stronger competition for global LNG supplies, and growing constraints on LNG production, U.S. LNG imports in 2030 are 1.7 trillion cubic feet lower in AEO2008 than the AEO2007 projection for LNG imports in 2030. There remains, however, considerable uncertainty about the future of the global LNG market, which could lead to higher or lower LNG imports. To quantify the possible effects of that uncertainty, AEO2008 includes high and low LNG supply cases in which U.S. imports of LNG are assumed to be higher and lower, respectively, than in the reference case.
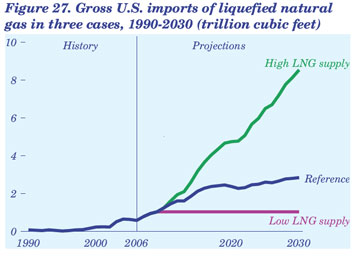
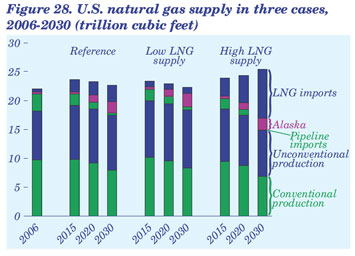
The high and low LNG supply cases are not based on explicit assumptions about the causes of increased or decreased availability of LNG imports but only examine their potential impacts on natural gas supply, demand, and prices in the United States. Gross U.S. LNG import levels were specified for the high LNG supply case by increasing LNG imports by 10 percent in 2011 relative to the reference case level, followed by a gradual increase to three times the reference case level in 2030. For the low LNG supply case, U.S. LNG imports are held constant at the reference case level in 2009 through the end of the projection. All other assumptions in the LNG supply cases, such as oil prices and domestic resource levels, are the same as in the reference case. In 2030, LNG imports are specified to be 8.5 trillion cubic feet in the high LNG supply case and 1.0 trillion cubic feet in the low LNG supply case (Figure 27).
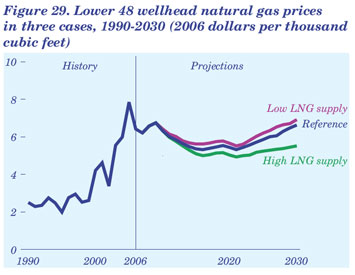
Varying the amount of LNG imports affects domestic production, consumption, and price levels for natural gas. In general, lower LNG imports result in the use of higher priced domestic production, leading to higher prices and, subsequently, reduced consumption and total supply requirements. In the low LNG supply case, 23 percent of the reduction in LNG imports is made up by a decline in natural gas consumption (primarily in the electricity generation sector, where more than 90 percent of the reduction occurs). The other 77 percent is made up by an increase in supplies from other sources, primarily domestic unconventional natural gas production (26 percent) but also other domestic lower 48 production (20 percent), Alaska production (20 percent), and pipeline imports (11 percent) (Figure 28). The lower supply requirement helps moderate the price increase relative to the reference case (Figure 29). Wellhead natural gas prices in 2030 are 4.4 percent higher in the low LNG supply case than in the reference case.
In the high LNG supply case, the impact on consumption is larger. An increase in natural gas consumption amounts to about 45 percent of the increment in LNG imports relative to the reference case, and the remaining 55 percent offsets declines in domestic natural gas production and pipeline imports. Wellhead prices in 2030 are nearly 17 percent lower in the high LNG supply case than in the reference case.
World Oil Prices and Production Trends in AEO2008
AEO2008 defines the world oil price as the price of light, low-sulfur crude oil delivered in Cushing, Oklahoma. Since 2003, both “above ground” and “below ground” factors have contributed to a sustained rise in nominal world oil prices, from $31 per barrel in 2003 to $69 per barrel in 2007. The AEO2008 reference case outlook for world oil prices is higher than in the AEO2007 reference case. The main reasons for the adoption of a higher reference case price outlook include continued significant expansion of world demand for liquids, particularly in non- OECD countries, which include China and India; the rising costs of conventional non-OPEC supply and unconventional liquids production; limited growth in non-OPEC supplies despite higher oil prices; and the inability or unwillingness of OPEC member countries to increase conventional crude oil production to levels that would be required for maintaining price stability. EIA will continue to monitor world oil price trends and may need to make further adjustments in future AEOs.
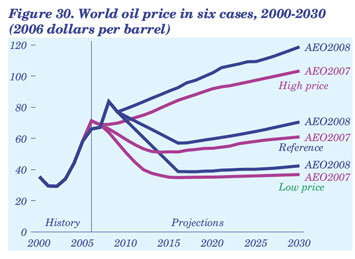
In the AEO2008 reference case, the world oil price in 2030 is approximately 18 percent higher than the AEO2007 reference case projection. In inflationadjusted terms (2006 dollars) the world crude oil price reaches $70 per barrel in 2030 in the AEO2008 reference case, as compared with $61 per barrel in the AEO2007 reference case (Figure 30).
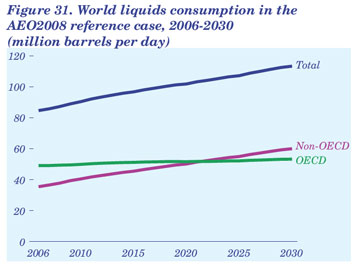
In AEO2008, for both production and consumption, “liquid fuels” include conventional and unconventional liquids. Unconventional liquids include oil sands, biofuels, extra-heavy oils, gas-to-liquids (GTL), and CTL. World consumption of liquid fuels increases from 85 million barrels per day in 2006 to 113 million barrels per day in 2030 in the AEO2008 reference case. The non-OECD countries, which accounted for 42 percent of world liquids consumption in 2006, are expected to reach 50 percent of the world total in 2022 and 53 percent in 2030, as non-OECD demand for liquid fuels increases from 36 million barrels per day in 2006 to 60 million barrels per day in 2030. Over the same period, OECD consumption increases from 49 million barrels per day to 53 million barrels per day in the reference case (Figure 31).
The OPEC share of world liquids production remains at about 41 percent through 2030, while non-OPEC conventional liquids production increases from 48 million barrels per day in 2006 to 56 million barrels per day in 2030. Unconventional liquids production in both OPEC and non-OPEC countries grows rapidly, but with more substantial increases in the non-OPEC countries (to 11 million barrels per day in 2030, compared with 3 million barrels per day for the OPEC countries in 2030).
Any long-term projection of world oil prices is highly uncertain. Above-ground factors that contribute to price uncertainty include access to oil resources, investment constraints, economic and other objectives of countries where the major reserves and resources are located, cost and availability of substitutes, and economic and policy developments that affect the demand for oil. Below-ground factors include the volumes initially in place in major petroleum basins around the world (including discovered and undiscovered fields) and the fluid and rock characteristics of undiscovered fields. AEO2008 includes high and low price cases to illustrate the potential impacts of the uncertainties.
The high price case assumes that non-OPEC conventional oil resources are less plentiful, and the overall costs of extraction are higher, than assumed in the reference case. The high price case also assumes that OPEC will choose to allow a decline in its market share to 38 percent of total world liquids production. As a result, the oil price increases steadily to approximately $112 per barrel in 2016 ($93 per barrel in 2006 dollars) and $186 per barrel in 2030 ($119 per barrel in 2006 dollars). World liquids consumption rises from 85 million barrels per day in 2006 to 98 million barrels per day in 2030 in the high price case.
The low price case assumes that non-OPEC conventional oil resources are more plentiful, and the overall costs of extraction are lower, than in the reference case, and that OPEC will choose to increase its market share to 45 percent. In the low price case, the world oil price falls steadily, to approximately $47 per barrel in 2017 ($39 per barrel in 2006 dollars), and then rises gradually to $69 per barrel in 2030 ($42 per barrel in 2006 dollars). World liquids consumption rises to 132 million barrels per day in 2030 in the low price case.
Issues in Focus Notes
|