Energy Demand
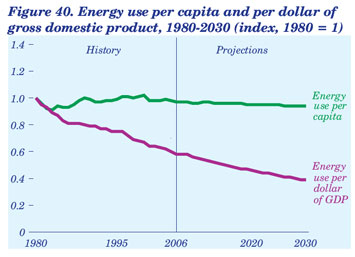
Average Energy Use per Person Levels Off Through 2030
Because energy use for housing, services, and travel
in the United States is closely linked to population
levels, energy use per capita is relatively stable
(Figure 40). In addition, the economy is becoming
less dependent on energy in general.
Energy intensity (energy use per 2000 dollar of GDP)
declines by an average of 1.4 percent per year in the
low growth case, 1.7 percent in the reference case, and
1.9 percent in the high growth case. Efficiency gains
and faster growth in less energy-intensive industries
account for most of the projected decline, more than
offsetting growth in demand for energy services in
buildings, transportation, and electricity generation.
The decline is more rapid in the high economic
growth case, because with higher economic growth
the number of new, more efficient systems grows
faster, and the additional growth is concentrated in
less energy-intensive industries. As energy prices
moderate over the longer term, energy intensity declines
at a slower rate in the reference, high growth,
and low growth cases.
The AEO2008 cases developed to illustrate the uncertainties
associated with those factors include low and
high growth cases, low and high price cases, and alternative
technology cases (see Appendixes B, C, D, and E).
Coal and Liquid Fuels Lead Increases
in Primary Energy Use
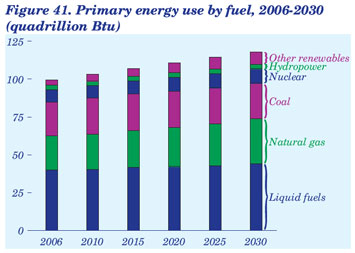
Total primary energy consumption, including energy
for electricity generation, grows by 0.7 percent per
year from 2006 to 2030 in the reference case (Figure
41). Fossil fuels account for 55 percent of the increase.
Coal use increases in the electric power sector, where
electricity demand growth and current environmental
policies favor coal-fired capacity additions. About
54 percent of the projected increase in coal consumption
occurs after 2020, when higher natural gas prices
make coal the fuel of choice for most new power
plants under current laws and regulations, which do
not limit greenhouse gas emissions. Increasing demand
for natural gas in the buildings and industrial
sectors offsets the decline in natural gas use in the
electricity sector after 2016, resulting in a net increase
of 5 percent from 2006 to 2030.
The transportation sector accounted for more than
two-thirds of all liquid fuel consumption in 2006, and
60 percent of that share went to LDVs. Demand for
liquid transportation fuels increases by 17 percent
from 2006 to 2030, dominated by growing fuel use for
LDVs, trucking, and air travel. The industrial sector
accounted for 25 percent of total liquid fuel use in
2006, but its share declines to 21 percent in 2030.
AEO2008 also projects rapid percentage growth in
renewable energy production, as a result of the
EISA2007 RFS and the various State mandates for
renewable electricity generation. Additions of new
nuclear power plants are also projected, spurred by
improving economics relative to plants fired with
fossil fuels and by the EPACT2005 PTCs.
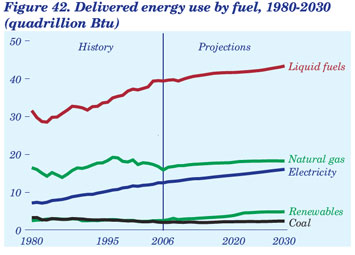
Electricity and Liquid Fuels Lead Rise
in Delivered Energy Consumption
Delivered energy use (excluding losses in electricity
generation) grows by 0.7 percent per year from 2006
to 2030 in the reference case. The growth in electricity
use is driven by growing demand in the residential
and commercial sectors. With the growing market
penetration of electric appliances, residential electricity
use increases slightly faster than the total number
of households, and commercial electricity use outpaces
the growth in commercial floorspace. With different
assumptions about population and economic
growth, average annual growth in delivered energy
use from 2006 to 2030 ranges from 0.3 percent in the
low growth case to 1.0 percent in the high growth
case.
Growth in demand for liquid fuels is led by the transportation
sector, as rising population, incomes, and
economic output boost demand for travel, partially
offsetting improvements in vehicle efficiency (Figure
42). Natural gas use grows more slowly than overall
delivered energy demand, reflecting its relatively
higher cost, particularly in the industrial sector.
Industrial biomass accounts for the largest share of
end-use consumption of renewable energy. Currently
it is used mostly as a byproduct fuel in the pulp and
paper industry, but that use will be surpassed by
consumption of biomass heat and co-products from
ethanol manufacture when the biofuel mandate
under EISA2007 reaches 36 billion gallons in 2022.
Consumption of nonmarketed solar, geothermal, and
wind energy also increases dramatically in the projections;
however, it continues to account for less than
1 percent of all delivered energy use in the residential
and commercial sectors.
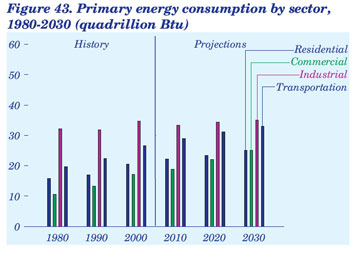
U.S. Primary Energy Use Climbs
to 118 Quadrillion Btu in 2030
The most significant impact of EISA2007 is in the
transportation sector, where the CAFE standard for
LDVs is raised to 35 mpg in 2020. Still, from 2006
to 2030 the transportation sector sees the secondlargest
increase in energy consumption, at 5 quadrillion
Btu (Figure 43), as a result of increases in vehicle
miles traveled, jet fuel consumption, and demand for
fuels such as E10, E85, and diesel to displace motor
gasoline.
EISA2007 has little effect on the commercial sector,
where energy demand continues to expand more
rapidly than the economy as a whole. Dependence on
natural gas and electricity, already heavy in the residential
and commercial sectors, increases over time.
Demand for electricity grows faster than demand for
natural gas in both sectors, however, because electricity
is used for a wider diversity of applications (including
the fastest growing end uses, office equipment,
personal computers, and televisions), whereas natural
gas is used mainly for space heating, cooking, and
water heating, which grow more slowly than households
and floorspace.
The variation in residential and commercial energy
demand between the high and low price cases is relatively
small, and natural gas consumption accounts
for most of the difference. In the industrial sector,
fuel use in 2030 is higher in the high price case than in
the reference case, reflecting differences in CTL,
ethanol, and biodiesel production. Different growth
rates for manufacturing output in the low and high
macroeconomic growth cases account for most of the
difference in industrial energy consumption between
the two cases.
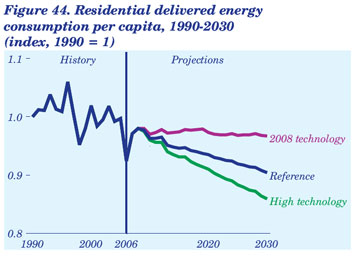
Residential Energy Use per Capita
Varies With Technology Assumptions
Residential energy use per person has remained fairly
constant since 1990 (taking into account year-to-year
fluctuations in weather), with increases in energy
efficiency offset by consumer preference for larger
homes and by new residential uses for energy. Over
the past 10 years, the weather has generally been
warmer than the 30-year average, causing energy use
per person to remain mostly below its 1990 level.
Given the preponderance of warmer winters and
summers, the AEO2008 projections define normal
weather as the average of the most recent 10 years of
historical data, which decreases the need for heating
fuels, such as natural gas and fuel oil, and increases
the need for electricity used for air conditioning, all
else being equal [79].
In the AEO2008 projections, residential energy use
per capita changes with assumptions about the rate at
which more efficient technologies are adopted. The
2008 technology case assumes no increase in the efficiency
of equipment or building shells beyond those
available in 2008. The high technology case assumes
lower costs, higher efficiencies, and earlier availability
of some advanced equipment. In the reference
case, residential energy use per capita is projected to
fall below the 2006 level after 2024. The 2008 technology
case approximates an upper bound on residential
energy use per capita in the future: delivered energy
use per capita in the residential sector remains above
the 2006 level through 2030, when it is 7 percent
higher than projected in the reference case (Figure
44). The high technology case provides a lower bound,
falling below the 2006 level after 2016 and reaching a
2030 level that is 5 percent below the reference case
projection.
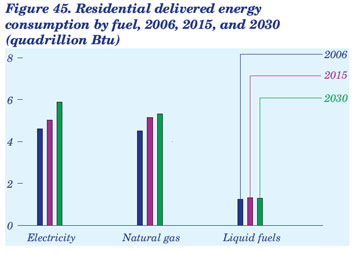
Household Uses for Electricity
Continue To Expand
In 2006, households consumed more electricity than
natural gas for the first time, as warmer winter temperatures
reduced the need for natural gas heating.
Over the past decade, residential electricity use has
grown steadily, as a result of the increase in air conditioning
use and the introduction of new applications.
That trend is expected to continue in AEO2008
(Figure 45). In 2030, electricity use for home cooling
is 38 percent higher than the 2006 level in the reference
case, as the U.S. population continues to migrate
to the South and West, and older homes convert from
room air conditioning to central air conditioning. A
projected 25-percent increase in the number of households
also increases the demand for appliances, and
total electricity use in the residential sector increases
by 27 percent from 2006 to 2030 in the reference case.
Natural gas and liquid fuels are used in the residential
sector primarily for space and water heating. Few
new uses have emerged over the past decade, and few
are expected in the future. Thus, natural gas and
liquids consumption per household decreases as the
energy efficiency of furnaces and building components
continues to improve.
The 2008 technology and high technology cases provide
high and low ranges for the projections. In the
high technology case, for example, high-efficiency air
conditioners and condensing gas furnaces become
more prevalent. Recent developments in solid-state
lighting technologies, such as light-emitting diodes
(LEDs), are reflected in the reference case as a reduction
of up to 85 percent in the amount of electricity
needed to provide a given amount of useful light.
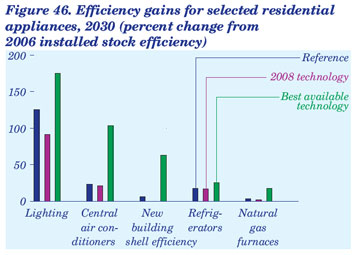
Increases in Energy Efficiency
Are Projected To Continue
The energy efficiency of new household appliances
plays a key role in determining the types and amounts
of energy used in residential buildings. As a result of
stock turnover and purchases of more efficient equipment,
energy use by residential consumers, both per
household and per capita, has fallen over time. In the
2008 technology case, which assumes no efficiency
improvement of available appliances beyond 2008 levels,
normal stock turnover results in higher average
energy efficiency for most end uses in 2030, as older
appliances are replaced with more efficient models
from the existing stock of appliances (Figure 46).
The largest gains in residential energy efficiency are
projected in the best available technology case, which
assumes that consumers purchase the most efficient
products available at normal replacement intervals
regardless of cost, and that new buildings are built to
the most energy-efficient specifications available,
starting in 2009. In this case, residential delivered
energy consumption in 2030 is 27 percent less than in
the 2008 technology case and 22 percent less than in
the reference case. Purchases of new energy-efficient
products, especially compact fluorescent and solidstate
lighting and condensing gas furnaces, reduce
energy use without lowering service levels.
Several current Federal programs, including Zero
Energy Homes and ENERGY STAR Homes, promote
the use of efficient appliances and building envelope
components, such as windows and insulation. In
the best available technology case, use of the most
efficient building envelope components available can
reduce heating requirements in an average new home
by more than 60 percent.
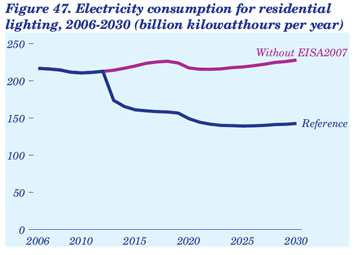
Residential Electricity Use for
Lighting Is Expected To Decline
Residential electricity use for lighting accounted for
about 16 percent of the sector’s total electricity consumption
in 2006, making it the second largest use for
electricity in households. In the AEO2008 reference
case, electricity use for lighting declines as a result of
the lighting efficiency standards in EISA2007, which
require general-service incandescent light bulbs to
reduce wattage by about 28 percent by 2014, increasing
to 65 percent in 2020. DOE is required to examine
the potential for tighter standards after 2020, but the
details are uncertain and are not included in the
AEO2008 reference case.
Figure 47 summarizes residential lighting use in the
AEO2008 reference case and a case without EISA-2007. Given the relatively rapid turnover in incandescent
lighting, EISA2007 achieves electricity savings
immediately, reducing lighting demand by 27 percent
(59 billion kilowatthours) in 2015. With continued
tightening of the standard through 2020, demand
for lighting is reduced by 85 billion kilowatthours
in 2030, as efficient lighting options, mainly LEDs,
gain market share.
In 2007, roughly 200 million compact fluorescent
light (CFL) bulbs were sold in the United States,
accounting for about 10 percent of total sales. Even
without the new standards, CFL sales in the residential
market were expected to continue growing in the
coming years. LED lamps, which are just now being
introduced in the general-service residential lighting
market, reach nearly 20 percent of sales in 2020 without
the EISA2007 standards. With the EISA2007
standards, the market share for LED bulbs in 2020
doubles.
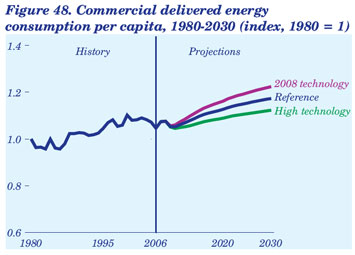
Rise in Commercial Energy Use
per Capita Is Projected To Continue
Assumptions about the availability and adoption of
energy-efficient technologies define the range for
delivered commercial energy use per person in the
AEO2008 projections. Commercial energy consumption
per capita increases by a total of 12 percent from
2006 to 2030 in the reference case, primarily as a
result of rising electricity use as the Nation continues
to move to a service economy. The size of the projected
increase varies from a low of 7 percent in the
high technology case to a high of 17 percent in the
2008 technology case (Figure 48).
In terms of floorspace, growth in the commercial sector
averages 1.2 percent per year from 2006 to 2030,
driven by trends in economic and population growth.
The reference case assumes future improvements in
efficiency for commercial equipment and building
shells, as well as increased demand for services. Consequently,
commercial energy use increases at about
the same rate as floorspace in the reference case, and
commercial energy intensity (delivered energy consumption
per square foot of floorspace) shows little
change, increasing by less than 2 percent. The 2008
technology case assumes no increase in the energy
efficiency of commercial equipment and building
shells beyond those available in 2008. The result is a
4-percent increase in commercial delivered energy
use in 2030 relative to the reference case. In the high
technology case, assuming earlier availability, lower
costs, and higher efficiencies for more advanced
equipment and building shells, delivered energy consumption
in 2030 is 4 percent below the reference
case projection.
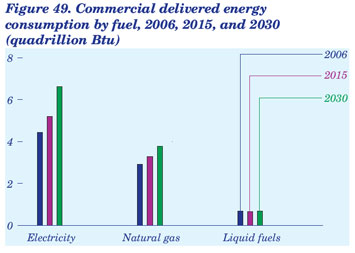
Electricity Leads Expected Growth
in Commercial Energy Use
In the AEO2008 projections, growth in disposable
income leads to increased demand for services from
hotels, restaurants, stores, theaters, galleries, arenas,
and other commercial establishments, which in turn
are increasingly dependent on computers and other
electronic office equipment both for basic services and
for business services and customer transactions. In
addition, the growing share of the population over age
65 increases demand for health care and assistedliving
facilities and for electricity to power medical
and monitoring equipment at those facilities. The reference
case projects increases in commercial electricity
use averaging 1.7 percent per year from 2006 to
2030 (Figure 49). The high technology and 2008 technology
cases provide low and high ranges for the
average annual growth rate of commercial electricity
consumption from 2006 to 2030, at 1.4 percent and
2.0 percent, respectively.
Use of natural gas and liquids for heating shows
limited growth, as commercial activity reflects the
U.S. population shift to the South and West and the
efficiency of building and equipment stocks improves.
Commercial natural gas use grows by 1.1 percent per
year on average from 2006 to 2030 in the reference
case, including more use of CHP in the later years.
While there is little change in liquid fuel consumption,
the projections for natural gas use in 2030 range
from 3.8 quadrillion Btu in the reference case to 4.0
quadrillion Btu in the high growth case and 3.5 in the
low growth case. The high and low oil price cases
show the widest range for liquid fuels use, varying
from 7 percent below to 12 percent above the reference
case projection of 0.7 quadrillion Btu in 2030.
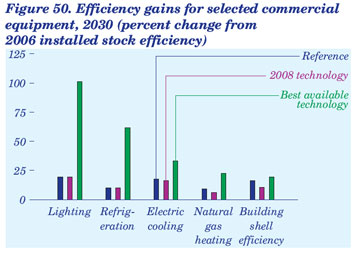
Technology Provides Potential Energy
Savings in the Commercial Sector
The stock efficiency of energy-using equipment in the
commercial sector increases in the AEO2008 reference
case. Adoption of more energy-efficient equipment
moderates the growth in demand, in part
because of existing building codes for new construction
and minimum efficiency standards, including
those in EPACT2005 and EISA2007; however, the
long service lives of many kinds of energy-using
equipment limit the pace of efficiency improvements.
The most rapid increase in overall energy efficiency
for the commercial sector occurs in the best available
technology case, which assumes that only the most
efficient technologies are chosen, regardless of cost,
and that new building shells in 2030 are 19 percent
more efficient than the commercial buildings stock in
2006. With the adoption of improved heat exchangers
for space heating and cooling equipment, solid-state
lighting, and more efficient compressors for commercial
refrigeration, commercial delivered energy consumption
in 2030 in the best technology case is 12
percent less than in the reference case and 16 percent
less than in the 2008 technology case.
In the 2008 technology case, which assumes equipment
and building shell efficiencies limited to those
available in 2008, energy efficiency in the commercial
sector still improves from 2006 to 2030 (Figure 50),
because the technologies available in 2008 can provide
savings relative to equipment currently in place.
When businesses consider equipment purchases,
however, the additional capital investment needed to
buy the most efficient technologies often carries more
weight than do future energy savings.
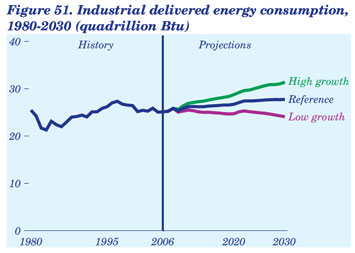
Economic Growth Cases Show Range
for Projected Industrial Energy Use
In the AEO2008 reference case, industrial value of
shipments grows at an annual rate of 1.3 percent
from 2006 to 2030. Industrial delivered energy consumption
increases by just 0.4 percent per year, from
25.1 quadrillion Btu in 2006 to 27.7 quadrillion Btu in
2030, as increased efficiency and changes in the composition
of output partially offset growth. In the low
economic growth case, industrial value of shipments
grows by 0.5 percent per year, and delivered energy
consumption falls to 24.2 quadrillion Btu in 2030. In
the high growth case, industrial value of shipments
grows by 2.0 percent per year, and energy consumption
rises to 31.7 quadrillion Btu in 2030, 14 percent
higher than in the reference case (Figure 51). The
variation in industrial output growth among the
three cases is well within the typical range over the
past 16 years, when output grew by 1.7 percent per
year on average from 1990 to 2007, and annual
growth rates ranged from 5.7 percent to a decline of
4.7 percent.
The construction and chemical industries were particularly
affected by the recent economic slowdown,
and their future growth is expected to be modest
(averaging 0.5 percent per year for the construction
industry from 2006 to 2030 in the reference case). As
a result, energy consumption in the construction
sector declines from 2.4 quadrillion Btu in 2006 to 2.2
quadrillion Btu in 2030, with about 70 percent of the
decrease attributed to reduced use of asphalt. The
bulk chemical industry shows little growth from 2006
to 2030, and its fuel consumption for energy and feedstock
totals only 5.6 quadrillion Btu in 2030, as compared
with an estimated 6.8 quadrillion Btu in 2006.
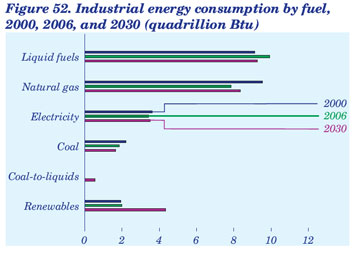
Industrial Fuel Choices Vary
Over Time
Industries adjust their fuel and product mixes over
time to respond to changing markets, as indicated by
the falling share of industrial coal use for process
steam and the rapid increase in coal use for production
of liquid fuels in the AEO2008 reference case
(Figure 52). Traditional coal use falls slightly as the
use of metallurgical coal in steelmaking declines,
reflecting the difficulty of building additional coke
ovens in the United States. Industrial demand for
steam coal as a boiler fuel also declines, as industrial
processes become more efficient and use less steam,
and as the growth of energy- and steam-intensive
industries slows. As a result, consumption of steam
coal in the industrial sector declines by 0.3 percent
per year in the reference case projection.
Natural gas consumption, excluding lease and plant
use, increases from 6.7 quadrillion Btu in 2006 to 7.1
quadrillion Btu in 2030—only slightly less than in
1990 (7.2 quadrillion Btu). Consumption of liquid
fuels falls slightly, from 9.9 quadrillion Btu in 2006 to
9.3 quadrillion Btu in 2030, but remains the largest
category of industrial energy consumption. About
three-quarters of industrial liquids consumption is
for nonfuel uses or as a byproduct in the refining
industry. Industrial consumption of purchased electricity
grows by just 0.1 percent per year. The only
industrial fuels for which significant increases are
projected are coal used in CTL plants and biofuel for
ethanol production. From no commercial production
in 2006, coal use for CTL grows to 0.6 quadrillion Btu
in 2030 in the reference case, and biofuel use for
ethanol production increases eightfold, to 2.3 quadrillion
Btu in 2030.
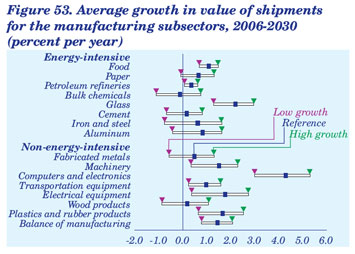
Energy-Intensive Industries Grow
Less Rapidly Than Industrial Average
In the AEO2008 reference case, average annual
growth in value of shipments for the manufacturing
sectors ranges from a decline of 0.1 percent per year
(bulk chemicals) to an increase of 4.3 percent per year
(computers). The pattern is similar in the economic
growth cases (Figure 53).
For the bulk chemical industry, value of shipments
grows slowly for several years and then falls slightly
over the last decade of the projection, as export demand
falls and other countries increase production.
The annual rate of growth in the energy-intensive
manufacturing group (0.7 percent) is lower than in
the non-energy-intensive group (1.9 percent). Glass is
the only energy-intensive subsector with a growth
rate above 2 percent per year in the reference case.
The growth rate for the industrial sector as a whole in
the final 10 years of the projection is slightly lower
than in the earlier years (1.2 percent compared with
1.4 percent). Growth rates for the individual
subsectors vary considerably, with about one-quarter
of them growing more rapidly in the final decade.
The projected growth rates for value of shipments
in the industrial subsectors in the high and low
economic growth cases generally are symmetrical
around the reference case. Industries with the most
rapid projected growth in the reference case also have
relatively more rapid growth in the high and low
economic growth cases. The range across economic
growth cases and subsectors is substantial, from a
decline of 1.1 percent per year for bulk chemicals in
the low economic growth case to an increase of 5.3
percent per year for computer manufacturing in the
high economic growth case.
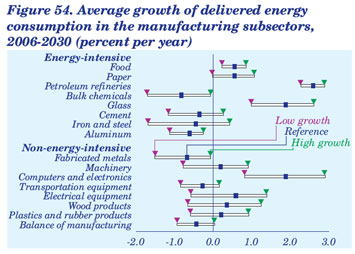
Energy Consumption Growth Varies
Widely Across Industry Sectors
The range of projections for industrial energy consumption
in AEO2008 largely reflects uncertainty
about the rate of economic growth. Average annual
growth in total delivered energy consumption in the
industrial sector from 2006 to 2030 ranges from a
decline of 0.1 percent in the low economic growth case
to an increase of 1.0 percent in the high economic
growth case. In 2030, consumption is 3.5 quadrillion
Btu lower in the low economic growth case and 4.0
quadrillion Btu higher in the high economic growth
case when compared with the reference case. Thus,
across the cases, the range for industrial energy
consumption in 2030 is 7.5 quadrillion Btu.
In the reference case, energy consumption growth
varies substantially among industry subsectors
(Figure 54). Delivered energy consumption falls over
the projection period for one-half of the energyintensive
industries (bulk chemicals, cement, iron
and steel, and aluminum) as a result of relatively slow
output growth rates, combined with expected
changes in production technology over the projection
period. The declines are reinforced by modest increases
in energy prices after 2020. In general, the
subsectors with the highest growth rates in energy
consumption are those with the highest growth rates
in value of shipments (computers and glass). The petroleum
refining sector is an exception. As refineries
shift to alternative feedstocks for liquids production
(biofuels, coal, heavier crude oil), more energy is required
per unit of output than is used for traditional
petroleum-based refining. Energy consumption at
refineries increases from 3.9 quadrillion Btu in 2006
to 7.3 quadrillion Btu in 2030—more than the total
growth in industrial sector energy consumption.
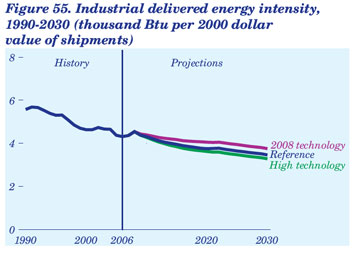
Energy Intensity in the Industrial
Sector Continues To Decline
From 1990 to 2006, energy consumption in the industrial
sector increased by only 0.5 quadrillion Btu
(3 percent), while the value of shipments increased
by 33 percent. Thus, industrial delivered energy use
per dollar of industrial value of shipments declined
by an average of 1.6 percent per year from 1990 to
2006 (Figure 55). Factors contributing to the drop in
energy intensity include continued restructuring
that reduced the industrial sector share of the most
energy-intensive industries; higher petroleum and
natural gas prices since 1998, which stimulated
greater improvements in energy efficiency; and hurricane-related shutdowns in 2005.
The energy-intensive industries’ share of industrial
output fell from 23 percent in 1990 to 21 percent in
2006; and in 2030 their share is projected to be 18
percent. Consequently, even if no specific industry
showed a reduction in energy intensity, the aggregate
energy intensity of the industrial sector would
decline. The shift in output share to less energyintensive
industries accounts for 84 percent of the
projected change in industrial energy intensity in the
reference case [80].
The technology cases represent alternative views of
the evolution and adoption of energy-saving technologies
in the industrial sector. In the high technology
case, industrial energy intensity falls by 1.1 percent
per year, compared with 0.9 percent per year in the
reference case. In the 2008 technology case, energy
intensity improves by only 0.5 percent per year.
Across the technology cases, industrial energy consumption
in 2030 varies over a range from 26.5 to
30.3 quadrillion Btu.
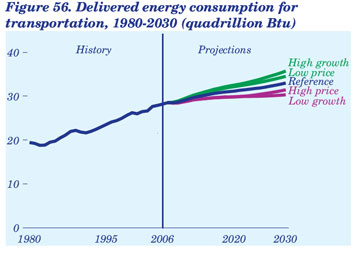
Growth in Transportation Energy Use
Is Expected To Slow
Delivered energy consumption in the transportation
sector grows at an average annual rate of 0.7 percent
in the AEO2008 reference case, from 28.2 quadrillion
Btu in 2006 to 33.0 quadrillion Btu in 2030 (Figure
56). That rate is less than the historical rate of 1.4
percent per year from 1980 to 2006, because the new
EISA2007 fuel economy standards, slower economic
growth, and higher fuel prices lead to efficiency improvements
and slower growth in travel demand.
Transportation energy consumption is influenced by
a variety of factors, including economic growth, population
growth, fuel prices, and vehicle fuel efficiency.
AEO2008 includes cases that examine the impacts of
those factors on delivered energy consumption. In
2030, transportation sector energy consumption is
about 8 percent higher in the high economic growth
case and 8 percent lower in the low economic growth
case than in the reference case, and it is about 5 percent
lower in the high price case and 5 percent higher
in the low price case than in the reference case.
By mode, the largest share of total transportation
energy consumption is for travel by LDVs (cars,
pickup trucks, sport utility vehicles, and vans). The
modes with the largest increases in energy demand
are heavy trucks (medium and large—classes 3
through 8—freight trucks and buses) and aircraft.
Heavy vehicles, which accounted for 18 percent of the
sector’s total energy use in 2006, account for 20 percent
in 2030 in the reference case. With expected
strong growth in demand for air travel and more
investment in infrastructure, air travel also accounts
for a growing portion of total energy consumption (13
percent in 2030, up from 9 percent in 2006).
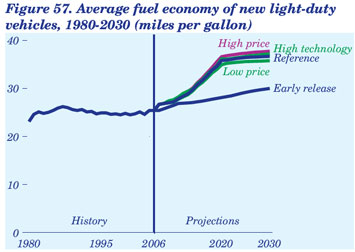
EISA2007 Improves Fuel Economy
of Light-Duty Vehicles
Light trucks have made up a steadily growing share of
U.S. LDV sales in recent years, accounting for more
than 50 percent of all new LDVs in 2006, compared
with 21 percent in 1980 [81]. Consequently, despite
fuel economy improvements, the average fuel economy
of new LDVs declined from a 1987 peak of 26.2
mpg to a low of 25.4 mpg in 2005 and remained at
roughly that level in 2006 (Figure 57).
EISA2007, enacted in December 2007, sets a new
CAFE standard of 35 mpg for LDVs in 2020. Without
EISA2007 (in the early release case), some advanced
vehicle technologies are adopted, and the average fuel
economy for new LDVs increases to 30.0 mpg in 2030.
In the AEO2008 reference case, with the EISA2007
provisions included, the fuel economy of new LDVs
increases to 36.6 mpg in 2030.
The economics of fuel-saving technologies improve
further in the high technology and high price cases,
and consumers buy more fuel-efficient cars and
trucks. In both cases, however, average fuel economy
improves only modestly from the reference case level,
because meeting the CAFE standards in EISA2007
already requires significant penetration of advanced
technologies, pushing fuel economy improvements to
the limit of current economic feasibility. In the low
price case there is little or no economic incentive for
consumers to purchase more fuel-efficient vehicles,
and LDV fuel economy in 2030 is slightly lower than
in the reference case.
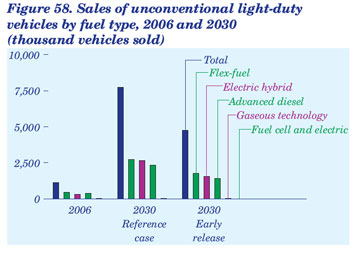
Unconventional Vehicle Technologies
Exceed 25 Percent of Sales in 2030
Concerns about oil supply, fuel prices, and emissions
have driven the development and market penetration
of unconventional vehicles (which can use alternative
fuels, electric motors and advanced electricity storage,
advanced engine controls, or other new technologies).
Unconventional technologies are expected to
play an even greater role in meeting the LDV CAFE
standards in EISA2007. In the reference case (with
EISA2007), unconventional vehicle sales total 7.7
million units (42 percent of new LDV sales) in 2030.
Without EISA2007, only 4.7 million units are sold in
2030, making up 25 percent of total new LDV sales
(Figure 58).
Sales of hybrid vehicles grow to 2.7 million units in
2030 in the reference case, compared with 1.6 million
units without EISA2007. Light-duty diesel engines
with advanced direct injection, which can significantly
reduce exhaust emissions and improve efficiency,
capture 13 percent of the market for new
LDVs in 2030. The availability of ultra-low-sulfur
diesel (ULSD) and biodiesel fuels, along with advances
in emission control technologies that reduce
criteria pollutants, increase the sales of unconventional
diesel vehicles.
Currently, manufacturers have an incentive to sell
flex-fuel vehicles (FFVs), because they receive fuel
economy credits that count toward CAFE compliance.
Although the credits are phased out by 2020 under
EISA2007, FFV sales increase from 454,600 units in
2006 to 2.7 million units in 2030 in the reference case
as a result of the growing use of E85 that is needed to
satisfy the EISA2007 RFS.
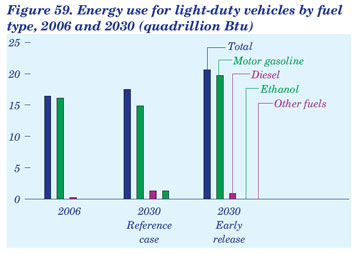
EISA2007 Reduces Light-Duty Vehicle
Fuel Use by 3 Quadrillion Btu in 2030
In the reference case, EISA2007 reduces energy consumption
for LDVs by more than 3 quadrillion Btu
in 2030, from 20.6 quadrillion Btu without EISA2007
to 17.5 quadrillion Btu with the bill (Figure 59).
Although total vehicle sales are approximately the
same in 2030 with and without EISA2007, higher
CAFE standards lead to the savings in energy
consumption.
With EISA2007, LDV motor gasoline consumption
drops by 4.9 quadrillion Btu in 2030, from 19.7
quadrillion Btu to 14.8 quadrillion Btu. Much of the
decline results from switching to unconventional
technologies. Diesel fuel consumption in 2030, including
biodiesel and BTL diesel, is 1.3 quadrillion Btu,
0.4 quadrillion Btu higher than without EISA2007;
and E85 consumption is 1.3 quadrillion Btu in 2030,
up from almost zero without EISA2007. The amount
of ethanol used in blending is about the same in both
cases because of EPA restrictions on ethanol fuel
blending.
As a result of EISA2007, the motor gasoline share of
fuel use for new LDVs in 2030 declines, and the
shares of diesel and ethanol increase. In the reference
case, motor gasoline accounts for 84.7 percent of the
total, down from 95.4 percent without EISA2007.
The diesel fuel share increases to 7.5 percent of total
consumption, and the ethanol share increases to 7.7
percent [82].
Market Trends Notes |