 |
|
|||
State Energy Profile - West VirginiaEnergy Information Administration - State Energy Profileshttp://tonto.eia.doe.gov/state |
||||||
|---|---|---|---|---|---|---|
|
||||||
|
Last Update: January 02, 2009
Next Update: January 08 , 2009 |
||||||
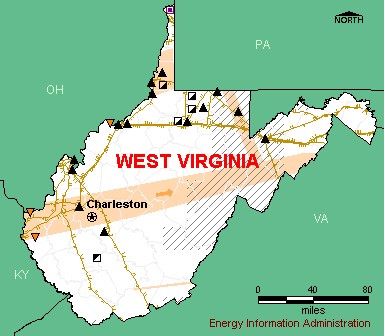
OverviewResources and ConsumptionWest Virginia has more estimated recoverable coal reserves at producing mines than any other State except Wyoming. Coal deposits are located in Central and Northern Appalachian basins, which underlie all but the eastern edge of the State. Those basins also hold smaller natural gas and crude oil reserves. Several rivers flowing from the Appalachian Mountains offer hydroelectric power resources. The industrial sector dominates West Virginia energy consumption, and per capita energy use is among the highest in the country. PetroleumWest Virginia’s annual crude oil production is minimal, typically accounting for less than 1 percent of total U.S. output. Much of the State's crude oil output is derived from stripper wells (wells producing less than 10 barrels of oil per day). West Virginia’s only refinery, located in Newell in the far north of the State’s panhandle, processes the majority of the crude oil produced in West Virginia and the Appalachian Basin. The Newell refinery specializes primarily in lubricants and process oils but also produces motor gasoline and diesel fuel. No petroleum product pipelines serve West Virginia markets, and the State relies on barge deliveries to meet demand. The Ohio River, on the State’s western border, serves as a major petroleum product transportation route. West Virginia is one of the few States that allow the statewide use of conventional motor gasoline. (Most States require the use of specific gasoline blends in non-attainment areas due to air-quality considerations.) Natural GasAlthough the State's natural gas production is minimal, West Virginia’s underground natural gas storage capacity accounts for about 6 percent of the U.S. total and the State is an important supplier to the Northeast region during the winter months when natural gas demand peaks. West Virginia has more than 30 underground storage facilities developed in depleted oil and gas fields. The industrial sector is West Virginia’s leading consumer of natural gas, accounting for almost one-third of the State's natural gas consumption. About one-half of West Virginia households use natural gas as their main source of energy for home heating. Coal, Electricity, and RenewablesWest Virginia is the top coal-producing State east of the Mississippi River, and output is second in the Nation (after Wyoming). State production accounts for nearly one-third of U.S. production east of the Mississippi River and over one-tenth of U.S. total coal production. Although all West Virginia coal is bituminous, coal sulfur content varies across the State. Coal produced in southern West Virginia is low in sulfur, while coal produced in northern West Virginia is high in sulfur. West Virginia leads the Nation in coal production from underground mines, which account for nearly two-thirds of State production. Large shipments of coal move in and out of the State primarily by rail and barge. West Virginia delivers coal to more than 25 States, most of which are on the East Coast and in the Midwest. About one-half of the coal consumed in West Virginia is used for electricity generation, while the other half is used in industrial and coke plants. Coal-fired plants account for nearly all of West Virginia’s electricity generation. Several small hydroelectric facilities account for most of the remaining power production. West Virginia electricity production is high, and although nearly one-third of West Virginia households use electricity as their primary source for home heating, State electricity consumption is low. This combination allows West Virginia to lead the Nation in net interstate electricity exports. |
|
| Economy | ||||
| Population and Employment | West Virginia | U.S. Rank | Period | |||||||
| Population | 1.8 million | 37 |
2007 | |||||||
| Civilian Labor Force | 0.8 million | 38 |
2007 | |||||||
| Per Capita Personal Income | $29,537 | 50 |
2007 | |||||||
| Industry | West Virginia | U.S. Rank | Period | |||||||
| Gross Domestic Product by State | $57.7 billion | 41 | 2007 | |||||||
| Land in Farms | 3.6 million acres | 39 |
2002 | |||||||
| Market Value of Agricultural Products Sold | $0.5 billion | 42 |
2002 | |||||||
| Prices | ||||
| Petroleum | West Virginia | U.S. Avg. | Period | |||||||
| Domestic Crude Oil First Purchase |
W
|
$98.5/barrel | Sep-08 | |||||||
| No. 2 Heating Oil, Residential | $3.636/gal | $3.666/gal | Sep-08 | |||||||
| Regular Motor Gasoline Sold Through Retail Outlets (Excluding Taxes) | $3.303/gal | $3.207/gal | Sep-08 | |||||||
| State Tax Rate on Motor Gasoline (other taxes may apply) |
$0.322/gal | $0.2159/gal | Aug-08 | |||||||
| No. 2 Diesel Fuel Sold Through Retail Outlets (Excluding Taxes) | $3.52/gal | $3.484/gal | Sep-08 | |||||||
| State Tax Rate on On-Highway Diesel (other taxes may apply) |
$0.322/gal | $0.2214/gal | Aug-08 | |||||||
| Natural Gas | West Virginia | U.S. Avg. | Period | |||||||
| Wellhead | — | $6.40/thousand cu ft | 2006 | |||||||
| City Gate | $10.78/thousand cu ft | $8.96/thousand cu ft | Sep-08 | |||||||
| Residential | $21.03/thousand cu ft | $17.94/thousand cu ft | Sep-08 | |||||||
| Coal | West Virginia | U.S. Avg. | Period | |||||||
| Average Open Market Sales Price | $47.63/short ton | $26.20/short ton | 2007 | |||||||
| Delivered to Electric Power Sector | W | $ 2.16 /million Btu | Sep-08 | |||||||
| Electricity | West Virginia | U.S. Avg. | Period | |||||||
| Residential | 7.41 cents/kWh | 11.94 cents/kWh | Sep-08 | |||||||
| Commercial | 6.13 cents/kWh | 10.77 cents/kWh | Sep-08 | |||||||
| Industrial | 4.34 cents/kWh | 7.36 cents/kWh | Sep-08 | |||||||
|
|||||||||||||||||||||||||
| Reserves | West Virginia | Share of U.S. | Period | ||||||||||||||||||||||
| Crude Oil | 28 million barrels | 0.1% | 2007 | ||||||||||||||||||||||
| Dry Natural Gas | 4,729 billion cu ft | 2.0% | 2007 | ||||||||||||||||||||||
| Natural Gas Liquids | 115 million barrels | 1.3% | 2007 | ||||||||||||||||||||||
| Recoverable Coal at Producing Mines | 1,828 million short tons | 9.6% | 2007 | ||||||||||||||||||||||
| Rotary Rigs & Wells | West Virginia | Share of U.S. | Period | ||||||||||||||||||||||
| Rotary Rigs in Operation | 32 | 1.8% | 2007 | ||||||||||||||||||||||
| Crude Oil Producing Wells | 3,408 | 0.7% | 2007 | ||||||||||||||||||||||
| Natural Gas Producing Wells | 53,003 | 11.8% | 2006 | ||||||||||||||||||||||
| Production | West Virginia | Share of U.S. | Period | ||||||||||||||||||||||
| Total Energy | 4,062 trillion Btu | 5.9% | 2005 | ||||||||||||||||||||||
| Crude Oil | 136 thousand barrels | 0.1% | Jul-08 | ||||||||||||||||||||||
| Natural Gas - Marketed | 225,530 million cu ft | 1.2% | 2006 | ||||||||||||||||||||||
| Coal | 153,480 thousand short tons | NA | 2007 | ||||||||||||||||||||||
| Capacity | West Virginia | Share of U.S. | Period | ||||||||||||||||||||||
| Crude Oil Refinery Capacity (as of Jan. 1) | 20,000 barrels/calendar day | 0.1% | 2008 | ||||||||||||||||||||||
| Electric Power Industry Net Summer Capability | 16,443 MW | 1.7% | 2006 | ||||||||||||||||||||||
| Net Electricity Generation | West Virginia | Share of U.S. | Period | ||||||||||||||||||||||
| Total Net Electricity Generation | 6,508 thousand MWh | 1.9% | Sep-08 | ||||||||||||||||||||||
| Petroleum-Fired | 8 thousand MWh | 0.3% | Sep-08 | ||||||||||||||||||||||
| Natural Gas-Fired | 13 thousand MWh | 0.0% | Sep-08 | ||||||||||||||||||||||
| Coal-Fired | 6,389 thousand MWh | 3.9% | Sep-08 | ||||||||||||||||||||||
| Nuclear | — | — | Sep-08 | ||||||||||||||||||||||
| Hydroelectric | 68 thousand MWh | 0.4% | Sep-08 | ||||||||||||||||||||||
| Other Renewables | 24 thousand MWh | 0.3% | Sep-08 | ||||||||||||||||||||||
| Stocks | West Virginia | Share of U.S. | Period | ||||||||||||||||||||||
| Motor Gasoline (Excludes Pipelines) | 215 thousand barrels | 0.4% | Sep-08 | ||||||||||||||||||||||
| Distillate Fuel Oil (Excludes Pipelines) | 98 thousand barrels | 0.1% | Sep-08 | ||||||||||||||||||||||
| Natural Gas in Underground Storage | 471,080 million cu ft | 6.4% | Sep-08 | ||||||||||||||||||||||
| Petroleum Stocks at Electric Power Producers | 156 thousand barrels | 0.4 % | Sep-08 | ||||||||||||||||||||||
| Coal Stocks at Electric Power Producers | 2,985 thousand tons | 2.1% | Sep-08 | ||||||||||||||||||||||
| Production Facilities | West Virginia | ||||||||||||||||||||||||
| Major Coal Mines | McElroy Mine/McElroy Coal Co. • Loveridge No. 22/Consolidation Coal Co. • Robinson Run No. 95/Consolidation Coal Co. • Twilight MTR Surface Mine/Progress Coal • Samples Mine/Catenary Coal Co. • Federal No. 2/Eastern Associated Coal Corp. | ||||||||||||||||||||||||
| Petroleum Refineries | Ergon West Virginia Inc (Newell) | ||||||||||||||||||||||||
| Major Non-Nuclear Electricity Generating Plants | John E Amos (Appalachian Power Co) • Harrison Power Station (Allegheny Energy Supply Co LLC) • Mitchell (Ohio Power Co) • Mt Storm (Virginia Electric & Power Co) • Mountaineer (Appalachian Power Co) | ||||||||||||||||||||||||
| Nuclear Power Plants | None | ||||||||||||||||||||||||
| Distribution & Marketing | ||||
| Distribution Centers | West Virginia | |||||||||
| Oil Seaports/Oil Import Sites | None | |||||||||
| Natural Gas Market Centers | None | |||||||||
| Major Pipelines | West Virginia | |||||||||
| Crude Oil | Eureka | |||||||||
| Petroleum Product | Consolidated Natural Gas • Koch. | |||||||||
| Liquefied Petroleum Gases | Consolidated Natural Gas • Koch. | |||||||||
| Interstate Natural Gas Pipelines | Columbia Gas Transmission Corp. • Dominion Transmission Co. • Tennessee Gas Pipeline Co. • Texas Eastern Transmission Corp. | |||||||||
| Fueling Stations | West Virginia | Share of U.S. | Period | |||||||
| Motor Gasoline | 1,300 | 0.8% | 2007 | |||||||
| Liquefied Petroleum Gases | 7 | 0.3% | 2007 | |||||||
| Compressed Natural Gas | 2 | 0.3% | 2007 | |||||||
| Ethanol | 3 | 0.2% | 2007 | |||||||
| Other Alternative Fuels | 0 | 0.0% | 2007 | |||||||
| Consumption | ||||
| per Capita | West Virginia | U.S. Rank | Period | |||||||
| Total Energy | 458 million Btu | 8 | 2006 | |||||||
| by Source | West Virginia | Share of U.S. | Period | |||||||
| Total Energy | 829 trillion Btu | 0.8% | 2006 | |||||||
| Total Petroleum | 53,025 thousand barrels | 0.7% | 2006 | |||||||
| Motor Gasoline | 20,326 thousand barrels | 0.6% | 2006 | |||||||
| Distillate Fuel | 14,953 thousand barrels | 1.0% | 2006 | |||||||
| Liquefied Petroleum Gases | 1,491 thousand barrels | 0.2% | 2006 | |||||||
| Jet Fuel | 231 thousand barrels | 0.0% | 2006 | |||||||
| Natural Gas | 113,085 million cu ft | 0.5% | 2006 | |||||||
| Coal | W | W | 2006 | |||||||
| by End-Use Sector | West Virginia | Share of U.S. | Period | |||||||
| Residential | 157,622 billion Btu | 0.8% | 2006 | |||||||
| Commercial | 109,118 billion Btu | 0.6% | 2006 | |||||||
| Industrial | 382,166 billion Btu | 1.2% | 2006 | |||||||
| Transportation | 180,342 billion Btu | 0.6% | 2006 | |||||||
| for Electricity Generation | West Virginia | Share of U.S. | Period | |||||||
| Petroleum | 14 thousand barrels | 0.3% | Sep-08 | |||||||
| Natural Gas | 163 million cu ft | 0.0% | Sep-08 | |||||||
| Coal | 2,719 thousand short tons | 3.2% | Sep-08 | |||||||
| for Home Heating (share of households) | West Virginia | U.S. Avg. | Period | |||||||
| Natural Gas | 48% | 51.2% | 2000 | |||||||
| Fuel Oil | 8% | 9.0% | 2000 | |||||||
| Electricity | 32% | 30.3% | 2000 | |||||||
| Liquefied Petroleum Gases | 6% | 6.5% | 2000 | |||||||
| Other/None | 6% | 1.8% | 2000 | |||||||
| Environment | ||||
| Special Programs | West Virginia | |||||||||
| Clean Cities Coalitions | State of West Virginia | |||||||||
| Alternative Fuels | West Virginia | Share of U.S. | Period | |||||||
| Alternative-Fueled Vehicles in Use | 1,544 | 0.3% | 2006 | |||||||
| Ethanol Plants | 0 | 0.0% | 2008 | |||||||
| Ethanol Plant Capacity | 0 million gal/year | 0.0% | 2008 | |||||||
| Ethanol Use in Gasohol | 19,065 thousand gal | 0.5% | 2004 | |||||||
| Electric Power Industry Emissions | West Virginia | Share of U.S. | Period | |||||||
| Carbon Dioxide |
85,075,495 metric tons | 3.5% | 2006 | |||||||
| Sulfur Dioxide |
427,857 metric tons | 4.5% | 2006 | |||||||
| Nitrogen Oxide |
139,571 metric tons | 3.7% | 2006 | |||||||
| — = No data reported; NA = Not available; W = Withheld to avoid disclosure of individual company data. |
|
||||||||||||||||||||||||||||||||||||||||||||||||||||||||||||||||||||||||||||||||||||||||||||||||||||||||||||||||||||||||||||||||||||||||||||||||||||||||||||||