 |
|
|||
State Energy Profile - VirginiaEnergy Information Administration - State Energy Profileshttp://tonto.eia.doe.gov/state |
||||||
|---|---|---|---|---|---|---|
|
||||||
|
Last Update: January 02, 2009
Next Update: January 08 , 2009 |
||||||
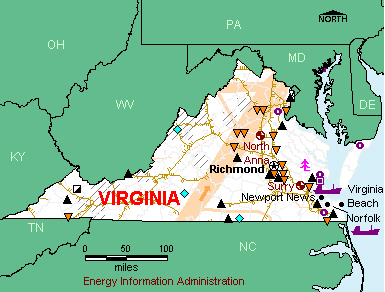
OverviewResources and ConsumptionVirginia has minor natural gas and coal reserves, nearly all of which are found in the Central Appalachian Basin in the southwestern part of the State. In addition, resource assessments show that substantial oil and gas reserves could underlie the land beneath Virginia’s offshore waters, which are part of the federally administered Mid-Atlantic Outer Continental Shelf (OCS). However, congressional and Presidential moratoria have prohibited energy development in that offshore area since 1990. Virginia’s offshore Atlantic waters also have high wind power potential, as do the waters of the Chesapeake Bay. Virginia’s energy demand is distributed among the sectors of the economy, with transportation leading the others by a small margin. PetroleumVirginia’s only petroleum refinery, in Yorktown, processes foreign crude oil delivered by barge via the Chesapeake Bay. The Yorktown refinery primarily supplies regional markets. Petroleum products are also delivered to Virginia at the Port of Norfolk and via the Colonial and Plantation pipelines from the Gulf Coast. Virginia’s total petroleum consumption is high. Reformulated motor gasoline blended with ethanol is required in the northern Virginia suburbs of Washington, D.C., and in the metropolitan areas of Richmond and Norfolk-Hampton Roads. Natural GasVirginia’s natural gas production is minor but enough to supply a substantial share of State demand. Virginia produces both conventional natural gas and coalbed methane in the Central Appalachian Basin, which covers the State’s western panhandle. Most of Virginia’s natural gas production comes from coalbed methane fields, two of which are among the 100 largest natural gas fields in the United States. As with most States on the East Coast, most of Virginia’s natural gas supply is delivered from the Gulf Coast region via several major interstate natural gas pipelines. Virginia’s natural gas consumption is distributed relatively evenly among the residential, commercial, industrial, and electricity generation sectors. About one-third of households in Virginia use natural gas as their primary energy source for home heating. Coal, Electricity, and RenewablesVirginia accounts for more than 5 percent of U.S. coal production east of the Mississippi River. Production takes place at surface and underground mines in the Central Appalachian Basin. Large volumes of coal move through Virginia by rail. Virginia coal is shipped to about one-half of the continental United States. The primary recipients are Georgia and Tennessee. Virginia receives large coal shipments from Kentucky and West Virginia. Most coal consumed in Virginia is used for electricity generation. Coal-fired power plants typically account for about one-half of the State’s electricity generation. Two nuclear power plants account for about one-third of the State’s electricity generation, and natural gas- and petroleum-fired power plants account for much of the rest. Over two-fifths of households in Virginia use electricity as their primary energy source for home heating. |
|
| Economy | ||||
| Population and Employment | Virginia | U.S. Rank | Period | |||||||
| Population | 7.7 million | 12 |
2007 | |||||||
| Civilian Labor Force | 4.1 million | 12 |
2007 | |||||||
| Per Capita Personal Income | $41,347 | 10 |
2007 | |||||||
| Industry | Virginia | U.S. Rank | Period | |||||||
| Gross Domestic Product by State | $383.0 billion | 11 | 2007 | |||||||
| Land in Farms | 8.6 million acres | 33 |
2002 | |||||||
| Market Value of Agricultural Products Sold | $2.4 billion | 30 |
2002 | |||||||
| Prices | ||||
| Petroleum | Virginia | U.S. Avg. | Period | |||||||
| Domestic Crude Oil First Purchase | — | $98.5/barrel | Sep-08 | |||||||
| No. 2 Heating Oil, Residential | $3.567/gal | $3.666/gal | Sep-08 | |||||||
| Regular Motor Gasoline Sold Through Retail Outlets (Excluding Taxes) | $3.232/gal | $3.207/gal | Sep-08 | |||||||
| State Tax Rate on Motor Gasoline (other taxes may apply) |
$0.175/gal | $0.2159/gal | Aug-08 | |||||||
| No. 2 Diesel Fuel Sold Through Retail Outlets (Excluding Taxes) | $3.456/gal | $3.484/gal | Sep-08 | |||||||
| State Tax Rate on On-Highway Diesel (other taxes may apply) |
$0.16/gal | $0.2214/gal | Aug-08 | |||||||
| Natural Gas | Virginia | U.S. Avg. | Period | |||||||
| Wellhead | — | $6.40/thousand cu ft | 2006 | |||||||
| City Gate | $12.19/thousand cu ft | $8.96/thousand cu ft | Sep-08 | |||||||
| Residential | $23.52/thousand cu ft | $17.94/thousand cu ft | Sep-08 | |||||||
| Coal | Virginia | U.S. Avg. | Period | |||||||
| Average Open Market Sales Price | $52.89/short ton | $26.20/short ton | 2007 | |||||||
| Delivered to Electric Power Sector | $ 2.80/million Btu | $ 2.16 /million Btu | Sep-08 | |||||||
| Electricity | Virginia | U.S. Avg. | Period | |||||||
| Residential | 10.52 cents/kWh | 11.94 cents/kWh | Sep-08 | |||||||
| Commercial | 8.07 cents/kWh | 10.77 cents/kWh | Sep-08 | |||||||
| Industrial | 6.11 cents/kWh | 7.36 cents/kWh | Sep-08 | |||||||
|
|||||||||||||||||||||||||
| Reserves | Virginia | Share of U.S. | Period | ||||||||||||||||||||||
| Crude Oil | — | — | 2007 | ||||||||||||||||||||||
| Dry Natural Gas | 2,529 billion cu ft | 1.1% | 2007 | ||||||||||||||||||||||
| Natural Gas Liquids | — | — | 2007 | ||||||||||||||||||||||
| Recoverable Coal at Producing Mines | 256 million short tons | 1.4 % | 2007 | ||||||||||||||||||||||
| Rotary Rigs & Wells | Virginia | Share of U.S. | Period | ||||||||||||||||||||||
| Rotary Rigs in Operation | 3 | 0.2% | 2007 | ||||||||||||||||||||||
| Crude Oil Producing Wells | 2 | 0.0% | 2007 | ||||||||||||||||||||||
| Natural Gas Producing Wells | 5,179 | 1.2% | 2006 | ||||||||||||||||||||||
| Production | Virginia | Share of U.S. | Period | ||||||||||||||||||||||
| Total Energy | 1,225 trillion Btu | 1.8% | 2005 | ||||||||||||||||||||||
| Crude Oil | 1 thousand barrels | 0.0% | Jul-08 | ||||||||||||||||||||||
| Natural Gas - Marketed | 103,027 million cu ft | 0.5% | 2006 | ||||||||||||||||||||||
| Coal | 25,346 thousand short tons | NA | 2007 | ||||||||||||||||||||||
| Capacity | Virginia | Share of U.S. | Period | ||||||||||||||||||||||
| Crude Oil Refinery Capacity (as of Jan. 1) | 63,650 barrels/calendar day | 0.4% | 2008 | ||||||||||||||||||||||
| Electric Power Industry Net Summer Capability | 22,648 MW | 2.3% | 2006 | ||||||||||||||||||||||
| Net Electricity Generation | Virginia | Share of U.S. | Period | ||||||||||||||||||||||
| Total Net Electricity Generation | 5,864 thousand MWh | 1.7% | Sep-08 | ||||||||||||||||||||||
| Petroleum-Fired | 52 thousand MWh | 1.7% | Sep-08 | ||||||||||||||||||||||
| Natural Gas-Fired | 1,071 thousand MWh | 1.4% | Sep-08 | ||||||||||||||||||||||
| Coal-Fired | 2,430 thousand MWh | 1.5% | Sep-08 | ||||||||||||||||||||||
| Nuclear | 2,089 thousand MWh | 3.1% | Sep-08 | ||||||||||||||||||||||
| Hydroelectric | 103 thousand MWh | 0.6% | Sep-08 | ||||||||||||||||||||||
| Other Renewables | 216 thousand MWh | 2.6% | Sep-08 | ||||||||||||||||||||||
| Stocks | Virginia | Share of U.S. | Period | ||||||||||||||||||||||
| Motor Gasoline (Excludes Pipelines) | 819 thousand barrels | 1.4% | Sep-08 | ||||||||||||||||||||||
| Distillate Fuel Oil (Excludes Pipelines) | 1,793 thousand barrels | 1.9% | Sep-08 | ||||||||||||||||||||||
| Natural Gas in Underground Storage | 8,665 million cu ft | 0.1% | Sep-08 | ||||||||||||||||||||||
| Petroleum Stocks at Electric Power Producers | 3,214 thousand barrels | 8.1 % | Sep-08 | ||||||||||||||||||||||
| Coal Stocks at Electric Power Producers | 1,747 thousand tons | 1.2% | Sep-08 | ||||||||||||||||||||||
| Production Facilities | Virginia | ||||||||||||||||||||||||
| Major Coal Mines | None | ||||||||||||||||||||||||
| Petroleum Refineries | Western Refining Yorktown Inc (Yorktown) | ||||||||||||||||||||||||
| Major Non-Nuclear Electricity Generating Plants | Bath County (Virginia Electric & Power Co) • Possum Point (Virginia Electric & Power Co) • Chesterfield (Virginia Electric & Power Co) • Yorktown (Virginia Electric & Power Co) • Tenaska Virginia Generating Station (Tenaska Virginia Partners LP) | ||||||||||||||||||||||||
| Nuclear Power Plants | North Anna (Virginia Electric & Power Co) • Surry (Virginia Electric & Power Co) | ||||||||||||||||||||||||
| Distribution & Marketing | ||||
| Distribution Centers | Virginia | |||||||||
| Oil Seaports/Oil Import Sites | Newport News • Norfolk | |||||||||
| Natural Gas Market Centers | None | |||||||||
| Major Pipelines | Virginia | |||||||||
| Crude Oil | None | |||||||||
| Petroleum Product | Colonial • Plantation. | |||||||||
| Liquefied Petroleum Gases | None | |||||||||
| Interstate Natural Gas Pipelines | Columbia Gas Transmission Corp. • Dominion Transmission Co. • East Tennessee Natural Gas Co. • Transcontinental Gas Pipeline Co. | |||||||||
| Fueling Stations | Virginia | Share of U.S. | Period | |||||||
| Motor Gasoline | 4,650 | 2.8% | 2007 | |||||||
| Liquefied Petroleum Gases | 21 | 0.9% | 2007 | |||||||
| Compressed Natural Gas | 9 | 1.1% | 2007 | |||||||
| Ethanol | 4 | 0.3% | 2007 | |||||||
| Other Alternative Fuels | 15 | 1.3% | 2007 | |||||||
| Consumption | ||||
| per Capita | Virginia | U.S. Rank | Period | |||||||
| Total Energy | 333 million Btu | 27 | 2006 | |||||||
| by Source | Virginia | Share of U.S. | Period | |||||||
| Total Energy | 2,545 trillion Btu | 2.6% | 2006 | |||||||
| Total Petroleum | 185,214 thousand barrels | 2.5% | 2006 | |||||||
| Motor Gasoline | 97,076 thousand barrels | 2.9% | 2006 | |||||||
| Distillate Fuel | 45,937 thousand barrels | 3.0% | 2006 | |||||||
| Liquefied Petroleum Gases | 5,171 thousand barrels | 0.7% | 2006 | |||||||
| Jet Fuel | 18,809 thousand barrels | 3.2% | 2006 | |||||||
| Natural Gas | 274,055 million cu ft | 1.2% | 2006 | |||||||
| Coal | W | W | 2006 | |||||||
| by End-Use Sector | Virginia | Share of U.S. | Period | |||||||
| Residential | 591,158 billion Btu | 2.8% | 2006 | |||||||
| Commercial | 574,248 billion Btu | 3.2% | 2006 | |||||||
| Industrial | 571,455 billion Btu | 1.8% | 2006 | |||||||
| Transportation | 808,013 billion Btu | 2.8% | 2006 | |||||||
| for Electricity Generation | Virginia | Share of U.S. | Period | |||||||
| Petroleum | 93 thousand barrels | 1.8% | Sep-08 | |||||||
| Natural Gas | 9,015 million cu ft | 1.4% | Sep-08 | |||||||
| Coal | 991 thousand short tons | 1.2% | Sep-08 | |||||||
| for Home Heating (share of households) | Virginia | U.S. Avg. | Period | |||||||
| Natural Gas | 34% | 51.2% | 2000 | |||||||
| Fuel Oil | 13% | 9.0% | 2000 | |||||||
| Electricity | 44% | 30.3% | 2000 | |||||||
| Liquefied Petroleum Gases | 5% | 6.5% | 2000 | |||||||
| Other/None | 4% | 1.8% | 2000 | |||||||
| Environment | ||||
| Special Programs | Virginia | |||||||||
| Clean Cities Coalitions | Hampton Roads | |||||||||
| Alternative Fuels | Virginia | Share of U.S. | Period | |||||||
| Alternative-Fueled Vehicles in Use | 14,606 | 2.5% | 2006 | |||||||
| Ethanol Plants | 0 | 0.0% | 2008 | |||||||
| Ethanol Plant Capacity | 0 million gal/year | 0.0% | 2008 | |||||||
| Ethanol Use in Gasohol | 88,858 thousand gal | 2.4% | 2004 | |||||||
| Electric Power Industry Emissions | Virginia | Share of U.S. | Period | |||||||
| Carbon Dioxide |
42,067,787 metric tons | 1.7% | 2006 | |||||||
| Sulfur Dioxide |
197,154 metric tons | 2.1% | 2006 | |||||||
| Nitrogen Oxide |
58,728 metric tons | 1.5% | 2006 | |||||||
| — = No data reported; NA = Not available; W = Withheld to avoid disclosure of individual company data. |
|
||||||||||||||||||||||||||||||||||||||||||||||||||||||||||||||||||||||||||||||||||||||||||||||||||||||||||||||||||||||||||||||||||||||||||||||||||||||||||||||