 |
|
|||
State Energy Profile - TennesseeEnergy Information Administration - State Energy Profileshttp://tonto.eia.doe.gov/state |
||||||
|---|---|---|---|---|---|---|
|
||||||
|
Last Update: January 02, 2009
Next Update: January 08 , 2009 |
||||||
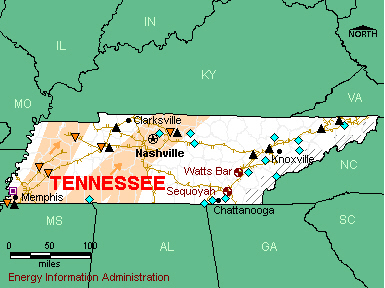
OverviewResources and ConsumptionThe Tennessee and Cumberland river systems, originating in the Appalachian Mountains, provide Tennessee with some of the highest hydroelectric power potential in the United States. Tennessee also has minor coal reserves in the Appalachian Basin in the eastern part of the State. Tennessee ranks among the top 20 energy-consuming States in the country both in absolute terms and on a per capita basis. The industrial sector leads State energy demand. PetroleumTennessee’s crude oil production is minor. The State’s only refinery, located in Memphis, receives crude oil supply via the Capline pipeline, which originates in the Gulf Coast region and passes through western Tennessee on its way to Midwest refining markets. Tennessee receives petroleum products by pipeline from several pipeline systems, including branches of the Colonial and Plantation pipelines. Several waterways, including the Mississippi River, also provide an important transportation route for interstate petroleum product shipments. A 100-million-gallon-per-year ethanol plant is currently under construction near Obion, Tennessee, and is expected to be operational by the late summer or early fall of 2008. Natural GasSeveral major natural gas pipelines from the Gulf Coast supply Tennessee as they pass through the State on the way to Northeast and Midwest markets. Industry is Tennessee’s largest natural gas-consuming sector and accounts for more than two-fifths of State demand. About one-third of Tennessee households use natural gas as their primary home-heating fuel. Coal, Electricity, and RenewablesCoal-fired power plants typically generate about three-fifths of the electricity produced in Tennessee; nuclear power and hydroelectric power supply the remainder. Tennessee’s coal production is minor, and the State’s coal-fired power plants rely on coal deliveries from other States by railroad and river barge. The top coal-supplying States to Tennessee are Kentucky, Wyoming, Virginia, Illinois, and Colorado. Tennessee is among the leading nuclear power States in the country, with two nuclear power plants located in the southern part of the State near Chattanooga. The single-unit Watts Bar nuclear power plant, which began commercial operation in 1996, was the last new nuclear reactor to come online in the United States. With numerous hydroelectric power plants located on the Tennessee and Cumberland river systems, Tennessee is one of top hydroelectric power producers east of the Rocky Mountains. The federally administered Tennessee Valley Authority (TVA) owns virtually all of the State’s electricity generation assets. Tennessee electricity consumption is high and the State leads the United States in per capita residential electricity consumption. More than one-half of Tennessee households use electricity as their primary source of energy for home heating. |
|
| Economy | ||||
| Population and Employment | Tennessee | U.S. Rank | Period | |||||||
| Population | 6.2 million | 16 |
2007 | |||||||
| Civilian Labor Force | 3.1 million | 20 |
2007 | |||||||
| Per Capita Personal Income | $33,280 | 40 |
2007 | |||||||
| Industry | Tennessee | U.S. Rank | Period | |||||||
| Gross Domestic Product by State | $243.9 billion | 19 | 2007 | |||||||
| Land in Farms | 11.7 million acres | 26 |
2002 | |||||||
| Market Value of Agricultural Products Sold | $2.2 billion | 31 |
2002 | |||||||
| Prices | ||||
| Petroleum | Tennessee | U.S. Avg. | Period | |||||||
| Domestic Crude Oil First Purchase | — | $98.5/barrel | Sep-08 | |||||||
| No. 2 Heating Oil, Residential | — | $3.666/gal | Sep-08 | |||||||
| Regular Motor Gasoline Sold Through Retail Outlets (Excluding Taxes) | $3.285/gal | $3.207/gal | Sep-08 | |||||||
| State Tax Rate on Motor Gasoline (other taxes may apply) |
$0.21/gal | $0.2159/gal | Aug-08 | |||||||
| No. 2 Diesel Fuel Sold Through Retail Outlets (Excluding Taxes) | — | $3.484/gal | Sep-08 | |||||||
| State Tax Rate on On-Highway Diesel (other taxes may apply) |
$0.18/gal | $0.2214/gal | Aug-08 | |||||||
| Natural Gas | Tennessee | U.S. Avg. | Period | |||||||
| Wellhead | $6.78/thousand cu ft | $6.40/thousand cu ft | 2006 | |||||||
| City Gate | $11.0/thousand cu ft | $8.96/thousand cu ft | Sep-08 | |||||||
| Residential | $22.63/thousand cu ft | $17.94/thousand cu ft | Sep-08 | |||||||
| Coal | Tennessee | U.S. Avg. | Period | |||||||
| Average Open Market Sales Price | $42.53/short ton | $26.20/short ton | 2007 | |||||||
| Delivered to Electric Power Sector | $ 2.17/million Btu | $ 2.16 /million Btu | Sep-08 | |||||||
| Electricity | Tennessee | U.S. Avg. | Period | |||||||
| Residential | 8.79 cents/kWh | 11.94 cents/kWh | Sep-08 | |||||||
| Commercial | 8.86 cents/kWh | 10.77 cents/kWh | Sep-08 | |||||||
| Industrial | 6.32 cents/kWh | 7.36 cents/kWh | Sep-08 | |||||||
|
|||||||||||||||||||||||||
| Reserves | Tennessee | Share of U.S. | Period | ||||||||||||||||||||||
| Crude Oil | — | — | 2007 | ||||||||||||||||||||||
| Dry Natural Gas | — | — | 2007 | ||||||||||||||||||||||
| Natural Gas Liquids | — | — | 2007 | ||||||||||||||||||||||
| Recoverable Coal at Producing Mines | 12 million short tons | 0.1 % | 2007 | ||||||||||||||||||||||
| Rotary Rigs & Wells | Tennessee | Share of U.S. | Period | ||||||||||||||||||||||
| Rotary Rigs in Operation | 5 | 0.3% | 2007 | ||||||||||||||||||||||
| Crude Oil Producing Wells | 290 | 0.1% | 2007 | ||||||||||||||||||||||
| Natural Gas Producing Wells | 330 | 0.1% | 2006 | ||||||||||||||||||||||
| Production | Tennessee | Share of U.S. | Period | ||||||||||||||||||||||
| Total Energy | 529 trillion Btu | 0.8% | 2005 | ||||||||||||||||||||||
| Crude Oil | 31 thousand barrels | 0.0% | Jul-08 | ||||||||||||||||||||||
| Natural Gas - Marketed | 1,793 million cu ft | 0.0% | 2006 | ||||||||||||||||||||||
| Coal | 2,654 thousand short tons | NA | 2007 | ||||||||||||||||||||||
| Capacity | Tennessee | Share of U.S. | Period | ||||||||||||||||||||||
| Crude Oil Refinery Capacity (as of Jan. 1) | 180,000 barrels/calendar day | 1.0% | 2008 | ||||||||||||||||||||||
| Electric Power Industry Net Summer Capability | 20,905 MW | 2.1% | 2006 | ||||||||||||||||||||||
| Net Electricity Generation | Tennessee | Share of U.S. | Period | ||||||||||||||||||||||
| Total Net Electricity Generation | 7,697 thousand MWh | 2.3% | Sep-08 | ||||||||||||||||||||||
| Petroleum-Fired | 10 thousand MWh | 0.3% | Sep-08 | ||||||||||||||||||||||
| Natural Gas-Fired | 56 thousand MWh | 0.1% | Sep-08 | ||||||||||||||||||||||
| Coal-Fired | 4,939 thousand MWh | 3.0% | Sep-08 | ||||||||||||||||||||||
| Nuclear | 2,306 thousand MWh | 3.4% | Sep-08 | ||||||||||||||||||||||
| Hydroelectric | 406 thousand MWh | 2.5% | Sep-08 | ||||||||||||||||||||||
| Other Renewables | 45 thousand MWh | 0.6% | Sep-08 | ||||||||||||||||||||||
| Stocks | Tennessee | Share of U.S. | Period | ||||||||||||||||||||||
| Motor Gasoline (Excludes Pipelines) | 1,079 thousand barrels | 1.8% | Sep-08 | ||||||||||||||||||||||
| Distillate Fuel Oil (Excludes Pipelines) | 949 thousand barrels | 1.0% | Sep-08 | ||||||||||||||||||||||
| Natural Gas in Underground Storage | 384 million cu ft | 0.0% | Sep-08 | ||||||||||||||||||||||
| Petroleum Stocks at Electric Power Producers | 684 thousand barrels | 1.7 % | Sep-08 | ||||||||||||||||||||||
| Coal Stocks at Electric Power Producers | 2,840 thousand tons | 2.0% | Sep-08 | ||||||||||||||||||||||
| Production Facilities | Tennessee | ||||||||||||||||||||||||
| Major Coal Mines | None | ||||||||||||||||||||||||
| Petroleum Refineries | Premcor Refining Group Inc (Memphis) | ||||||||||||||||||||||||
| Major Non-Nuclear Electricity Generating Plants | Cumberland (Tennessee Valley Authority) • Johnsonville (Tennessee Valley Authority) • Raccoon Mountain (Tennessee Valley Authority) • Gallatin (Tennessee Valley Authority) • Kingston (Tennessee Valley Authority) | ||||||||||||||||||||||||
| Nuclear Power Plants | Sequoyah (Tennessee Valley Authority) • Watts Bar Nuclear Plant (Tennessee Valley Authority) | ||||||||||||||||||||||||
| Distribution & Marketing | ||||
| Distribution Centers | Tennessee | |||||||||
| Oil Seaports/Oil Import Sites | None | |||||||||
| Natural Gas Market Centers | None | |||||||||
| Major Pipelines | Tennessee | |||||||||
| Crude Oil | Mid-Valley • Shell | |||||||||
| Petroleum Product | Amoco • Colonial • Plantation. | |||||||||
| Liquefied Petroleum Gases | None | |||||||||
| Interstate Natural Gas Pipelines | ANR Pipeline Co. • Columbia Gas Transmission Corp. • Columbia Gulf Transmission Co. • East Tennessee Natural Gas Co. • Embridge Pipelines (Ala Tenn) • Midwestern Gas Transmission Co. • Southern Natural Gas Co. • Texas Eastern Transmission Co. • Tennessee Gas Pipeline Co. • Texas Gas Transmission Co. • Trunkline Gas Co. | |||||||||
| Fueling Stations | Tennessee | Share of U.S. | Period | |||||||
| Motor Gasoline | 4,650 | 2.8% | 2007 | |||||||
| Liquefied Petroleum Gases | 52 | 2.3% | 2007 | |||||||
| Compressed Natural Gas | 4 | 0.5% | 2007 | |||||||
| Ethanol | 12 | 0.8% | 2007 | |||||||
| Other Alternative Fuels | 50 | 4.3% | 2007 | |||||||
| Consumption | ||||
| per Capita | Tennessee | U.S. Rank | Period | |||||||
| Total Energy | 381 million Btu | 17 | 2006 | |||||||
| by Source | Tennessee | Share of U.S. | Period | |||||||
| Total Energy | 2,313 trillion Btu | 2.3% | 2006 | |||||||
| Total Petroleum | 152,634 thousand barrels | 2.0% | 2006 | |||||||
| Motor Gasoline | 74,910 thousand barrels | 2.2% | 2006 | |||||||
| Distillate Fuel | 34,144 thousand barrels | 2.2% | 2006 | |||||||
| Liquefied Petroleum Gases | 4,687 thousand barrels | 0.6% | 2006 | |||||||
| Jet Fuel | 14,207 thousand barrels | 2.4% | 2006 | |||||||
| Natural Gas | 220,426 million cu ft | 1.0% | 2006 | |||||||
| Coal | 30,275 thousand short tons | 2.7% | 2006 | |||||||
| by End-Use Sector | Tennessee | Share of U.S. | Period | |||||||
| Residential | 522,623 billion Btu | 2.5% | 2006 | |||||||
| Commercial | 374,686 billion Btu | 2.1% | 2006 | |||||||
| Industrial | 764,942 billion Btu | 2.4% | 2006 | |||||||
| Transportation | 650,910 billion Btu | 2.3% | 2006 | |||||||
| for Electricity Generation | Tennessee | Share of U.S. | Period | |||||||
| Petroleum | 18 thousand barrels | 0.4% | Sep-08 | |||||||
| Natural Gas | 639 million cu ft | 0.1% | Sep-08 | |||||||
| Coal | 2,296 thousand short tons | 2.7% | Sep-08 | |||||||
| for Home Heating (share of households) | Tennessee | U.S. Avg. | Period | |||||||
| Natural Gas | 36% | 51.2% | 2000 | |||||||
| Fuel Oil | 2% | 9.0% | 2000 | |||||||
| Electricity | 52% | 30.3% | 2000 | |||||||
| Liquefied Petroleum Gases | 7% | 6.5% | 2000 | |||||||
| Other/None | 3% | 1.8% | 2000 | |||||||
| Environment | ||||
| Special Programs | Tennessee | |||||||||
| Clean Cities Coalitions | East Tennessee Clean Fuels Coalition • Middle Tennessee | |||||||||
| Alternative Fuels | Tennessee | Share of U.S. | Period | |||||||
| Alternative-Fueled Vehicles in Use | 9,503 | 1.6% | 2006 | |||||||
| Ethanol Plants | 1 | 0.7% | 2008 | |||||||
| Ethanol Plant Capacity | 67 million gal/year | 0.8% | 2008 | |||||||
| Ethanol Use in Gasohol | 0 thousand gal | 0.0% | 2004 | |||||||
| Electric Power Industry Emissions | Tennessee | Share of U.S. | Period | |||||||
| Carbon Dioxide |
61,379,959 metric tons | 2.5% | 2006 | |||||||
| Sulfur Dioxide |
270,258 metric tons | 2.8% | 2006 | |||||||
| Nitrogen Oxide |
99,906 metric tons | 2.6% | 2006 | |||||||
| — = No data reported; NA = Not available; W = Withheld to avoid disclosure of individual company data. |
|
||||||||||||||||||||||||||||||||||||||||||||||||||||||||||||||||||||||||||||||||||||||||||||||||||||||||||||||||||||||||||||||||||||||||||||||||||||||||||||||