 |
|
|||
State Energy Profile - MississippiEnergy Information Administration - State Energy Profileshttp://tonto.eia.doe.gov/state |
||||||
|---|---|---|---|---|---|---|
|
||||||
|
Last Update: January 02, 2009
Next Update: January 08 , 2009 |
||||||
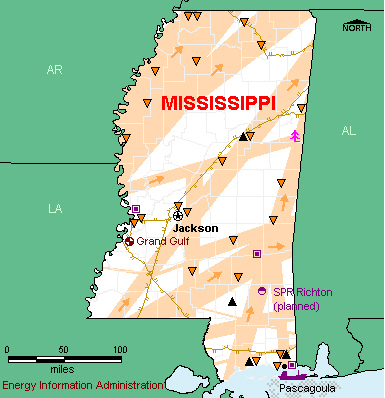
OverviewResources and ConsumptionAlthough Mississippi is not as rich in energy as neighboring Louisiana, the State has substantial energy resources. Oil and gas fields are found primarily in the southern half of the State. However, in recent years, new deposits have been discovered in the Black Warrior Basin in the north, and onshore and offshore along the Gulf Coast. Geologists believe that further exploration of those areas could reveal important new oil and gas reserves. Although Mississippi’s economy traditionally relied on agriculture, manufacturing has now become the State’s largest industry. The industrial and transportation sectors dominate State energy use and per capita energy consumption is high. PetroleumMississippi produces a small amount of crude oil, mostly from wells in the southern half of the State. Mississippi has three oil refineries, which together account for more than 2 percent of total U.S. refining capacity. Mississippi’s largest refinery, located along the Gulf Coast in Pascagoula, processes crude oil imported by marine tanker from Central and South America. The Pascagoula refinery supplies fuel to markets in the South and Southeast, using marine shipments and connections to the Colonial and Plantation pipelines. Mississippi is one of the few States in the Nation that allow the statewide use of conventional motor gasoline. (Most States require the use of specific gasoline blends in non-attainment areas due to air-quality considerations.) A major propane supply hub is located in Hattiesburg, Mississippi, where the Dixie Pipeline has a network of terminals and storage facilities. About one in five Mississippi households use liquefied petroleum gases (LPG) as their primary home heating fuel, compared with fewer than one in 10 households nationwide. In January 2007, the U.S. Department of Energy (DOE) chose a group of salt domes in Richton, Mississippi, as a new storage site for the Strategic Petroleum Reserve. Designed to cushion the effects of potential crude oil supply disruptions, the new facility will hold about 160 million barrels of crude oil. The DOE chose this site in part because its inland location makes it less vulnerable to hurricanes. Hurricane vulnerability is an issue for Mississippi’s oil and gas infrastructure, much of which is located along the Gulf Coast. In 2005, Hurricane Katrina caused major damage to the Pascagoula refinery. In addition, power outages in Mississippi affected a Plantation Pipeline pump station, ultimately forcing the line to shut down and causing fuel supply problems throughout the southeastern United States. Natural GasMississippi’s natural gas production is minimal, accounting for less than 1 percent of total U.S output. In recent years, new wells have been completed at the Mariner Field along the Gulf Coast and at the Maben Field in the Black Warrior Basin. Despite new completions, Mississippi’s marketed natural gas production has fallen drastically since 2003, when the State’s natural gas wells began producing increasing volumes of non-hydrocarbon gases, such as carbon dioxide, helium, hydrogen sulfide, and nitrogen. Mississippi’s natural gas processing industry has expanded in recent years to serve growing offshore supplies brought in from federally administered Outer Continental Shelf (OCS). Mississippi has one of the largest natural gas processing plants in the United States, Pascagoula, which expanded capacity in 2000 in order to accept natural gas production transported by pipeline from the OCS. Due primarily to demand from electricity generators and the industrial sector, Mississippi’s per capita natural gas consumption is high. To meet demand, Mississippi purchases more than one-half of its natural gas from neighboring States. In the future, Mississippi could begin importing international supplies, as two liquefied natural gas (LNG) import terminals have been proposed near Pascagoula. Coal, Electricity, and RenewablesMississippi’s electric power production is low, and the State imports electricity from neighboring States in order to satisfy consumer demand. Coal is Mississippi’s leading generation fuel, typically accounting for more than one-third of electricity produced within the State. Mississippi’s only coal mine, located in Choctaw County, supplies lignite coal to a 440-megawatt mine-mouth power plant that uses clean-coal technology. Mississippi’s other coal-fired power plants are fueled by coal shipped primarily from Colorado. Natural gas is the second most important fuel for electricity generation, followed by nuclear power, which typically accounts for about one-fourth of the electricity produced in the State. A single large reactor at the Grand Gulf Nuclear Power Station provides all of Mississippi’s nuclear power. Mississippi also produces a small amount of electricity from a wood-fired power plant in the eastern part of the State. Mississippi’s residential per capita electricity use is high, due in part to high air-conditioning demand during hot summer months and the widespread use of electricity for home heating during generally mild winter months. |
|
| Economy | ||||
| Population and Employment | Mississippi | U.S. Rank | Period | |||||||
| Population | 2.9 million | 31 |
2007 | |||||||
| Civilian Labor Force | 1.3 million | 33 |
2007 | |||||||
| Per Capita Personal Income | $28,845 | 51 |
2007 | |||||||
| Industry | Mississippi | U.S. Rank | Period | |||||||
| Gross Domestic Product by State | $88.5 billion | 36 | 2007 | |||||||
| Land in Farms | 11.1 million acres | 27 |
2002 | |||||||
| Market Value of Agricultural Products Sold | $3.1 billion | 27 |
2002 | |||||||
| Prices | ||||
| Petroleum | Mississippi | U.S. Avg. | Period | |||||||
| Domestic Crude Oil First Purchase |
$100.19/barrel
|
$98.5/barrel | Sep-08 | |||||||
| No. 2 Heating Oil, Residential | — | $3.666/gal | Sep-08 | |||||||
| Regular Motor Gasoline Sold Through Retail Outlets (Excluding Taxes) | $3.218/gal | $3.207/gal | Sep-08 | |||||||
| State Tax Rate on Motor Gasoline (other taxes may apply) |
$0.184/gal | $0.2159/gal | Aug-08 | |||||||
| No. 2 Diesel Fuel Sold Through Retail Outlets (Excluding Taxes) | — | $3.484/gal | Sep-08 | |||||||
| State Tax Rate on On-Highway Diesel (other taxes may apply) |
$0.184/gal | $0.2214/gal | Aug-08 | |||||||
| Natural Gas | Mississippi | U.S. Avg. | Period | |||||||
| Wellhead | $6.84/thousand cu ft | $6.40/thousand cu ft | 2006 | |||||||
| City Gate | $8.77/thousand cu ft | $8.96/thousand cu ft | Sep-08 | |||||||
| Residential | $16.56/thousand cu ft | $17.94/thousand cu ft | Sep-08 | |||||||
| Coal | Mississippi | U.S. Avg. | Period | |||||||
| Average Open Market Sales Price | W | $26.20/short ton | 2007 | |||||||
| Delivered to Electric Power Sector | W | $ 2.16 /million Btu | Sep-08 | |||||||
| Electricity | Mississippi | U.S. Avg. | Period | |||||||
| Residential | 10.86 cents/kWh | 11.94 cents/kWh | Sep-08 | |||||||
| Commercial | 10.50 cents/kWh | 10.77 cents/kWh | Sep-08 | |||||||
| Industrial | 7.07 cents/kWh | 7.36 cents/kWh | Sep-08 | |||||||
|
|||||||||||||||||||||||||
| Reserves | Mississippi | Share of U.S. | Period | ||||||||||||||||||||||
| Crude Oil | 200 million barrels | 0.9% | 2007 | ||||||||||||||||||||||
| Dry Natural Gas | 954 billion cu ft | 0.4% | 2007 | ||||||||||||||||||||||
| Natural Gas Liquids | 9 million barrels | 0.1% | 2007 | ||||||||||||||||||||||
| Recoverable Coal at Producing Mines | W | NA | 2007 | ||||||||||||||||||||||
| Rotary Rigs & Wells | Mississippi | Share of U.S. | Period | ||||||||||||||||||||||
| Rotary Rigs in Operation | 14 | 0.8% | 2007 | ||||||||||||||||||||||
| Crude Oil Producing Wells | 1,555 | 0.3% | 2007 | ||||||||||||||||||||||
| Natural Gas Producing Wells | 1,836 | 0.4% | 2006 | ||||||||||||||||||||||
| Production | Mississippi | Share of U.S. | Period | ||||||||||||||||||||||
| Total Energy | 383 trillion Btu | 0.6% | 2005 | ||||||||||||||||||||||
| Crude Oil | 1,852 thousand barrels | 1.6% | Jul-08 | ||||||||||||||||||||||
| Natural Gas - Marketed | 60,531 million cu ft | 0.3% | 2006 | ||||||||||||||||||||||
| Coal | 3,545 thousand short tons | NA | 2007 | ||||||||||||||||||||||
| Capacity | Mississippi | Share of U.S. | Period | ||||||||||||||||||||||
| Crude Oil Refinery Capacity (as of Jan. 1) | 364,000 barrels/calendar day | 2.1% | 2008 | ||||||||||||||||||||||
| Electric Power Industry Net Summer Capability | 16,620 MW | 1.7% | 2006 | ||||||||||||||||||||||
| Net Electricity Generation | Mississippi | Share of U.S. | Period | ||||||||||||||||||||||
| Total Net Electricity Generation | 3,497 thousand MWh | 1.0% | Sep-08 | ||||||||||||||||||||||
| Petroleum-Fired | 21 thousand MWh | 0.7% | Sep-08 | ||||||||||||||||||||||
| Natural Gas-Fired | 1,519 thousand MWh | 2.0% | Sep-08 | ||||||||||||||||||||||
| Coal-Fired | 1,214 thousand MWh | 0.7% | Sep-08 | ||||||||||||||||||||||
| Nuclear | 617 thousand MWh | 0.9% | Sep-08 | ||||||||||||||||||||||
| Hydroelectric | — | — | Sep-08 | ||||||||||||||||||||||
| Other Renewables | 124 thousand MWh | 1.5% | Sep-08 | ||||||||||||||||||||||
| Stocks | Mississippi | Share of U.S. | Period | ||||||||||||||||||||||
| Motor Gasoline (Excludes Pipelines) | 1,563 thousand barrels | 2.7% | Sep-08 | ||||||||||||||||||||||
| Distillate Fuel Oil (Excludes Pipelines) | 1,142 thousand barrels | 1.2% | Sep-08 | ||||||||||||||||||||||
| Natural Gas in Underground Storage | 148,817 million cu ft | 2.0% | Sep-08 | ||||||||||||||||||||||
| Petroleum Stocks at Electric Power Producers | 929 thousand barrels | 2.3 % | Sep-08 | ||||||||||||||||||||||
| Coal Stocks at Electric Power Producers | 1,067 thousand tons | 0.7% | Sep-08 | ||||||||||||||||||||||
| Production Facilities | Mississippi | ||||||||||||||||||||||||
| Major Coal Mines | None | ||||||||||||||||||||||||
| Petroleum Refineries | Chevron USA Inc (Pascagoula) • Ergon Refining Inc (Vicksburg) • Hunt Southland Refining Co (Sandersville) | ||||||||||||||||||||||||
| Major Non-Nuclear Electricity Generating Plants | Victor J Daniel Jr (Mississippi Power Co) • Baxter Wilson (Entergy Mississippi Inc) • Jack Watson (Mississippi Power Co) • Magnolia Power Plant (InterGen North America) • Batesville Generation Facility (LSP Energy Ltd Partnership) | ||||||||||||||||||||||||
| Nuclear Power Plants | Grand Gulf (System Energy Resources • Inc) | ||||||||||||||||||||||||
| Distribution & Marketing | ||||
| Distribution Centers | Mississippi | |||||||||
| Oil Seaports/Oil Import Sites | Pascagoula | |||||||||
| Natural Gas Market Centers | None | |||||||||
| Major Pipelines | Mississippi | |||||||||
| Crude Oil | BP • EOTT Energy • Genesis • Hunt • Mid-Valley • Scurlock-Permian • Shell. | |||||||||
| Petroleum Product | Colonial • Plantation. | |||||||||
| Liquefied Petroleum Gases | BP • Enterprise • Dixie • Plantation. | |||||||||
| Interstate Natural Gas Pipelines | ANR Pipeline Co. • Centerpoint Energy Gas Transmission Co. • Chandeleur Pipeline Co. • Columbia Gulf Transmission Co. • Crosstex Mississppi Pipeline • Destin Pipeline Co. • Enbridge Pipelines (AlaTenn) • Enbridge Pipelines (Midla) • Florida Gas Transmission Co. • Gulf South Pipeline Co. • Gulfstream Natural Gas System • Mississippi Fuel Co. • Mississippi Valley Gas Co. • Mustang Fuel Co. • Petal Gas Storage Co. • Southern Natural Gas Co. • Tennessee Gas Pipeline Co. • Texas Eastern Transmission Co. • Texas Gas Transmission Co. • Transcontinental Gas Pipeline Co. • Trunkline Gas Co. • | |||||||||
| Fueling Stations | Mississippi | Share of U.S. | Period | |||||||
| Motor Gasoline | 3,550 | 2.2% | 2007 | |||||||
| Liquefied Petroleum Gases | 36 | 1.6% | 2007 | |||||||
| Compressed Natural Gas | 0 | 0.0% | 2007 | |||||||
| Ethanol | 1 | 0.1% | 2007 | |||||||
| Other Alternative Fuels | 5 | 0.4% | 2007 | |||||||
| Consumption | ||||
| per Capita | Mississippi | U.S. Rank | Period | |||||||
| Total Energy | 419 million Btu | 12 | 2006 | |||||||
| by Source | Mississippi | Share of U.S. | Period | |||||||
| Total Energy | 1,216 trillion Btu | 1.2% | 2006 | |||||||
| Total Petroleum | 86,777 thousand barrels | 1.1% | 2006 | |||||||
| Motor Gasoline | 40,097 thousand barrels | 1.2% | 2006 | |||||||
| Distillate Fuel | 21,407 thousand barrels | 1.4% | 2006 | |||||||
| Liquefied Petroleum Gases | 3,489 thousand barrels | 0.5% | 2006 | |||||||
| Jet Fuel | 7,097 thousand barrels | 1.2% | 2006 | |||||||
| Natural Gas | 307,293 million cu ft | 1.3% | 2006 | |||||||
| Coal | W | W | 2006 | |||||||
| by End-Use Sector | Mississippi | Share of U.S. | Period | |||||||
| Residential | 229,435 billion Btu | 1.1% | 2006 | |||||||
| Commercial | 163,070 billion Btu | 0.9% | 2006 | |||||||
| Industrial | 445,566 billion Btu | 1.4% | 2006 | |||||||
| Transportation | 377,590 billion Btu | 1.3% | 2006 | |||||||
| for Electricity Generation | Mississippi | Share of U.S. | Period | |||||||
| Petroleum | 37 thousand barrels | 0.7% | Sep-08 | |||||||
| Natural Gas | 15,218 million cu ft | 2.4% | Sep-08 | |||||||
| Coal | 727 thousand short tons | 0.8% | Sep-08 | |||||||
| for Home Heating (share of households) | Mississippi | U.S. Avg. | Period | |||||||
| Natural Gas | 37% | 51.2% | 2000 | |||||||
| Fuel Oil | 0% | 9.0% | 2000 | |||||||
| Electricity | 40% | 30.3% | 2000 | |||||||
| Liquefied Petroleum Gases | 21% | 6.5% | 2000 | |||||||
| Other/None | 2% | 1.8% | 2000 | |||||||
| Environment | ||||
| Special Programs | Mississippi | |||||||||
| Clean Cities Coalitions | None | |||||||||
| Alternative Fuels | Mississippi | Share of U.S. | Period | |||||||
| Alternative-Fueled Vehicles in Use | 5,162 | 0.9% | 2006 | |||||||
| Ethanol Plants | 0 | 0.0% | 2008 | |||||||
| Ethanol Plant Capacity | 0 million gal/year | 0.0% | 2008 | |||||||
| Ethanol Use in Gasohol | 0 thousand gal | 0.0% | 2004 | |||||||
| Electric Power Industry Emissions | Mississippi | Share of U.S. | Period | |||||||
| Carbon Dioxide |
25,802,259 metric tons | 1.0% | 2006 | |||||||
| Sulfur Dioxide |
82,053 metric tons | 0.9% | 2006 | |||||||
| Nitrogen Oxide |
45,349 metric tons | 1.2% | 2006 | |||||||
| — = No data reported; NA = Not available; W = Withheld to avoid disclosure of individual company data. |
|
||||||||||||||||||||||||||||||||||||||||||||||||||||||||||||||||||||||||||||||||||||||||||||||||||||||||||||||||||||||||||||||||||||||||||||||||||||||||||||||