 |
|
|||
State Energy Profile - MinnesotaEnergy Information Administration - State Energy Profileshttp://tonto.eia.doe.gov/state |
||||||
|---|---|---|---|---|---|---|
|
||||||
|
Last Update: January 02, 2009
Next Update: January 08 , 2009 |
||||||
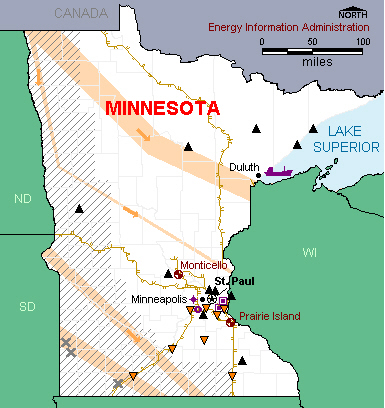
OverviewResources and ConsumptionMinnesota has no fossil fuel resources, but the western part of the State has wind energy potential, and cornfields in the south and west provide feedstock for ethanol production. Minnesota’s population and total energy consumption place the State in the middle of national rankings. The industrial and transportation sectors lead State energy demand. PetroleumMinnesota has two oil refineries in the Minneapolis-St. Paul area for processing crude oil that comes primarily from Canada. Several pipeline systems bring crude oil to Minnesota, including the Lakehead Pipeline System from Canada that passes through northern Minnesota on its way to other markets in the U.S. Midwest. In an effort to keep pace with growing State demand for petroleum products, Minnesota recently approved construction of a new, 300-mile pipeline to carry additional Canadian crude oil to the State's refineries. The line is expected to be operational by March 2008. Since 1992, Minnesota has had a robust program in place to support ethanol production and consumption. Minnesota is the only State that requires the statewide use of oxygenated motor gasoline blended with 10 percent ethanol. Minnesota also offers incentives to encourage the adoption of E85—a mixture of 85 percent ethanol with 15 percent motor gasoline—throughout the State and now has more E85 refueling stations than any other State. Minnesota is among the Nation’s top producers of ethanol, with over a dozen corn-based production plants located primarily in the southern part of the State and additional facilities under construction. Natural GasThe natural gas consumed in Minnesota is supplied from Canadian and domestic sources via several major natural gas pipelines that traverse the State on the way to other markets in the U.S. Midwest. The residential sector is Minnesota’s largest natural gas consumer, accounting for nearly two-fifths of State consumption. Over two-thirds of Minnesota households use natural gas as their primary heating fuel during the State’s long, cold winters. Coal, Electricity, and RenewablesCoal-fired power plants typically account for nearly two-thirds of Minnesota’s electricity generation. Minnesota receives most of its coal supply by rail from Montana and Wyoming. Two nuclear plants near the Twin Cities typically account for nearly one-fourth of the State’s electricity production. Recent legislation permits the Prairie Island Plant to store additional nuclear waste onsite, extending the plant’s operation through 2014. The smaller Monticello nuclear plant is currently licensed through September 2010. Minnesota has numerous wind farms, particularly in the southwest, and ranks among the leading States in wind power generation. The State generates electricity from other renewable sources as well, including conventional hydroelectric dams, municipal solid-waste and landfill gas, and wood waste. |
|
| Economy | ||||
| Population and Employment | Minnesota | U.S. Rank | Period | |||||||
| Population | 5.2 million | 21 |
2007 | |||||||
| Civilian Labor Force | 3.0 million | 19 |
2007 | |||||||
| Per Capita Personal Income | $41,034 | 12 |
2007 | |||||||
| Industry | Minnesota | U.S. Rank | Period | |||||||
| Gross Domestic Product by State | $255.0 billion | 16 | 2007 | |||||||
| Land in Farms | 27.5 million acres | 14 |
2002 | |||||||
| Market Value of Agricultural Products Sold | $8.6 billion | 6 |
2002 | |||||||
| Prices | ||||
| Petroleum | Minnesota | U.S. Avg. | Period | |||||||
| Domestic Crude Oil First Purchase | — | $98.5/barrel | Sep-08 | |||||||
| No. 2 Heating Oil, Residential | $3.663/gal | $3.666/gal | Sep-08 | |||||||
| Regular Motor Gasoline Sold Through Retail Outlets (Excluding Taxes) | $3.159/gal | $3.207/gal | Sep-08 | |||||||
| State Tax Rate on Motor Gasoline (other taxes may apply) |
$0.22/gal | $0.2159/gal | Aug-08 | |||||||
| No. 2 Diesel Fuel Sold Through Retail Outlets (Excluding Taxes) | $3.517/gal | $3.484/gal | Sep-08 | |||||||
| State Tax Rate on On-Highway Diesel (other taxes may apply) |
$0.22/gal | $0.2214/gal | Aug-08 | |||||||
| Natural Gas | Minnesota | U.S. Avg. | Period | |||||||
| Wellhead | — | $6.40/thousand cu ft | 2006 | |||||||
| City Gate | $7.60/thousand cu ft | $8.96/thousand cu ft | Sep-08 | |||||||
| Residential | $13.61/thousand cu ft | $17.94/thousand cu ft | Sep-08 | |||||||
| Coal | Minnesota | U.S. Avg. | Period | |||||||
| Average Open Market Sales Price | — | $26.20/short ton | 2007 | |||||||
| Delivered to Electric Power Sector | $ 1.62/million Btu | $ 2.16 /million Btu | Sep-08 | |||||||
| Electricity | Minnesota | U.S. Avg. | Period | |||||||
| Residential | 9.79 cents/kWh | 11.94 cents/kWh | Sep-08 | |||||||
| Commercial | 7.80 cents/kWh | 10.77 cents/kWh | Sep-08 | |||||||
| Industrial | 6.15 cents/kWh | 7.36 cents/kWh | Sep-08 | |||||||
|
|||||||||||||||||||||||||
| Reserves | Minnesota | Share of U.S. | Period | ||||||||||||||||||||||
| Crude Oil | — | — | 2007 | ||||||||||||||||||||||
| Dry Natural Gas | — | — | 2007 | ||||||||||||||||||||||
| Natural Gas Liquids | — | — | 2007 | ||||||||||||||||||||||
| Recoverable Coal at Producing Mines | — | — | 2007 | ||||||||||||||||||||||
| Rotary Rigs & Wells | Minnesota | Share of U.S. | Period | ||||||||||||||||||||||
| Rotary Rigs in Operation | 0 | 0.0% | 2007 | ||||||||||||||||||||||
| Crude Oil Producing Wells | 0 | 0.0% | 2007 | ||||||||||||||||||||||
| Natural Gas Producing Wells | — | — | 2006 | ||||||||||||||||||||||
| Production | Minnesota | Share of U.S. | Period | ||||||||||||||||||||||
| Total Energy | 240 trillion Btu | 0.3% | 2005 | ||||||||||||||||||||||
| Crude Oil | — | — | Jul-08 | ||||||||||||||||||||||
| Natural Gas - Marketed | — | — | 2006 | ||||||||||||||||||||||
| Coal | — | — | 2007 | ||||||||||||||||||||||
| Capacity | Minnesota | Share of U.S. | Period | ||||||||||||||||||||||
| Crude Oil Refinery Capacity (as of Jan. 1) | 362,150 barrels/calendar day | 2.1% | 2008 | ||||||||||||||||||||||
| Electric Power Industry Net Summer Capability | 12,651 MW | 1.3% | 2006 | ||||||||||||||||||||||
| Net Electricity Generation | Minnesota | Share of U.S. | Period | ||||||||||||||||||||||
| Total Net Electricity Generation | 3,909 thousand MWh | 1.2% | Sep-08 | ||||||||||||||||||||||
| Petroleum-Fired | 3 thousand MWh | 0.1% | Sep-08 | ||||||||||||||||||||||
| Natural Gas-Fired | 153 thousand MWh | 0.2% | Sep-08 | ||||||||||||||||||||||
| Coal-Fired | 2,544 thousand MWh | 1.6% | Sep-08 | ||||||||||||||||||||||
| Nuclear | 780 thousand MWh | 1.2% | Sep-08 | ||||||||||||||||||||||
| Hydroelectric | 33 thousand MWh | 0.2% | Sep-08 | ||||||||||||||||||||||
| Other Renewables | 355 thousand MWh | 4.3% | Sep-08 | ||||||||||||||||||||||
| Stocks | Minnesota | Share of U.S. | Period | ||||||||||||||||||||||
| Motor Gasoline (Excludes Pipelines) | 1,185 thousand barrels | 2.0% | Sep-08 | ||||||||||||||||||||||
| Distillate Fuel Oil (Excludes Pipelines) | 1,002 thousand barrels | 1.1% | Sep-08 | ||||||||||||||||||||||
| Natural Gas in Underground Storage | 6,571 million cu ft | 0.1% | Sep-08 | ||||||||||||||||||||||
| Petroleum Stocks at Electric Power Producers | 268 thousand barrels | 0.7 % | Sep-08 | ||||||||||||||||||||||
| Coal Stocks at Electric Power Producers | 3,026 thousand tons | 2.1% | Sep-08 | ||||||||||||||||||||||
| Production Facilities | Minnesota | ||||||||||||||||||||||||
| Major Coal Mines | None | ||||||||||||||||||||||||
| Petroleum Refineries | Flint Hills Resources LP (Saint Paul) • Marathon Petroleum Co LLC (Saint Paul) | ||||||||||||||||||||||||
| Major Non-Nuclear Electricity Generating Plants | Sherburne County (Northern States Power Co) • Clay Boswell (Minnesota Power Inc) • Black Dog (Northern States Power Co) • Allen S King (Northern States Power Co) • Lakefield Junction (Great River Energy) | ||||||||||||||||||||||||
| Nuclear Power Plants | Prairie Island (Northern States Power Co) • Monticello (Northern States Power Co) | ||||||||||||||||||||||||
| Distribution & Marketing | ||||
| Distribution Centers | Minnesota | |||||||||
| Oil Seaports/Oil Import Sites | Duluth • Minneapolis. | |||||||||
| Natural Gas Market Centers | None | |||||||||
| Major Pipelines | Minnesota | |||||||||
| Crude Oil | Koch • Lakehead • Minnesota • Portal. | |||||||||
| Petroleum Product | BP Amoco • Williams. | |||||||||
| Liquefied Petroleum Gases | Alliance • Cochin • Lakehead • MAPCO. | |||||||||
| Interstate Natural Gas Pipelines | Alliance Pipeline Co. • Great Lakes Gas Transmission Ltd • Northern Boarder Pipeline Co. • Northern Natural Gas Co. • Viking Gas Transmission Co. | |||||||||
| Fueling Stations | Minnesota | Share of U.S. | Period | |||||||
| Motor Gasoline | 3,649 | 2.2% | 2007 | |||||||
| Liquefied Petroleum Gases | 31 | 1.4% | 2007 | |||||||
| Compressed Natural Gas | 1 | 0.1% | 2007 | |||||||
| Ethanol | 334 | 23.6% | 2007 | |||||||
| Other Alternative Fuels | 1 | 0.1% | 2007 | |||||||
| Consumption | ||||
| per Capita | Minnesota | U.S. Rank | Period | |||||||
| Total Energy | 353 million Btu | 19 | 2006 | |||||||
| by Source | Minnesota | Share of U.S. | Period | |||||||
| Total Energy | 1,822 trillion Btu | 1.8% | 2006 | |||||||
| Total Petroleum | 130,067 thousand barrels | 1.7% | 2006 | |||||||
| Motor Gasoline | 64,432 thousand barrels | 1.9% | 2006 | |||||||
| Distillate Fuel | 26,035 thousand barrels | 1.7% | 2006 | |||||||
| Liquefied Petroleum Gases | 10,363 thousand barrels | 1.4% | 2006 | |||||||
| Jet Fuel | 11,773 thousand barrels | 2.0% | 2006 | |||||||
| Natural Gas | 352,576 million cu ft | 1.5% | 2006 | |||||||
| Coal | 20,935 thousand short tons | 1.9% | 2006 | |||||||
| by End-Use Sector | Minnesota | Share of U.S. | Period | |||||||
| Residential | 391,679 billion Btu | 1.9% | 2006 | |||||||
| Commercial | 347,098 billion Btu | 2.0% | 2006 | |||||||
| Industrial | 559,703 billion Btu | 1.7% | 2006 | |||||||
| Transportation | 523,494 billion Btu | 1.8% | 2006 | |||||||
| for Electricity Generation | Minnesota | Share of U.S. | Period | |||||||
| Petroleum | 7 thousand barrels | 0.1% | Sep-08 | |||||||
| Natural Gas | 1,430 million cu ft | 0.2% | Sep-08 | |||||||
| Coal | 1,553 thousand short tons | 1.8% | Sep-08 | |||||||
| for Home Heating (share of households) | Minnesota | U.S. Avg. | Period | |||||||
| Natural Gas | 68% | 51.2% | 2000 | |||||||
| Fuel Oil | 6% | 9.0% | 2000 | |||||||
| Electricity | 12% | 30.3% | 2000 | |||||||
| Liquefied Petroleum Gases | 10% | 6.5% | 2000 | |||||||
| Other/None | 4% | 1.8% | 2000 | |||||||
| Environment | ||||
| Special Programs | Minnesota | |||||||||
| Clean Cities Coalitions | Twin Cities | |||||||||
| Alternative Fuels | Minnesota | Share of U.S. | Period | |||||||
| Alternative-Fueled Vehicles in Use | 9,593 | 1.6% | 2006 | |||||||
| Ethanol Plants | 16 | 11.3% | 2008 | |||||||
| Ethanol Plant Capacity | 400.60 million gal/year | 5.0% | 2008 | |||||||
| Ethanol Use in Gasohol | 276,693 thousand gal | 7.6% | 2004 | |||||||
| Electric Power Industry Emissions | Minnesota | Share of U.S. | Period | |||||||
| Carbon Dioxide |
37,564,927 metric tons | 1.5% | 2006 | |||||||
| Sulfur Dioxide |
94,420 metric tons | 1.0% | 2006 | |||||||
| Nitrogen Oxide |
85,198 metric tons | 2.2% | 2006 | |||||||
| — = No data reported; NA = Not available; W = Withheld to avoid disclosure of individual company data. |
|
||||||||||||||||||||||||||||||||||||||||||||||||||||||||||||||||||||||||||||||||||||||||||||||||||||||||||||||||||||||||||||||||||||||||||||||||||||||||||||||