|
Energy Information Administration Brochures |
|---|
| Brochure #: DOE/EIA-X040 Release Date: May 2008 Next Release Date: May 2009 |
|
A Primer on Gasoline Prices
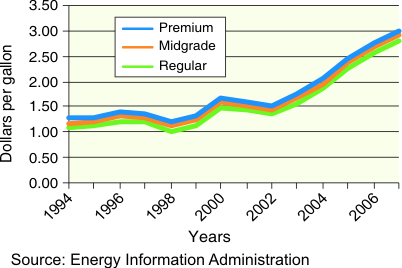
Gasoline is one of the major fuels consumed in the United States and the main product refined from crude oil. Consumption in 2007 was about 142 billion gallons, an average about 390 million gallons per day and the equivalent of about 61% of all the energy used for transportation, 44% of all petroleum consumption, and 17% of total U.S. energy consumption. About 47 barrels of gasoline are produced in U.S. refineries from every 100 barrels of oil refined to make numerous petroleum products. Most gasoline is used in cars and light trucks. It also fuels boats, recreational vehicles, and farm, construction, and landscaping equipment. While gasoline is produced year-round, extra volumes are made and imported to meet higher demand in the summer. Gasoline is delivered from oil refineries mainly through pipelines to an extensive distribution chain serving about 167,500 retail gasoline stations in the United States.1 There are three main grades of gasoline that are based on octane levels: regular, mid-grade, and premium. Premium grade is the most expensive; the price difference between grades is generally constant at about ten cents per gallon.
1National Petroleum News, 2007 Industry Scorecard.
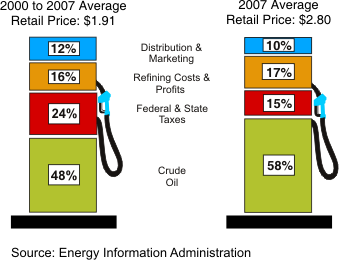
Figure 1. What Do We Pay for in a Gallon of Regular Grade?
What are the components of the retail price of gasoline?
The cost of crude oil as a share of the retail price varies over time and among regions of the country. In 2007, the price of crude oil averaged about $68 per barrel and accounted for about 58% of the national average retail price of a gallon of regular grade gasoline (Figure 1). In comparison, in 2005 the average crude oil price was $50 per barrel and the crude oil cost was 53% of the retail price. From 2000 to 2007 the average crude oil price was about $39 per barrel and the crude oil cost share of the retail gasoline prices averaged 48%.Federal, State, and local government taxes are the next largest part of the retail price of gasoline. In 2007, taxes (not including county and local taxes) accounted for about 15% of the cost of a gallon of regular gasoline. Federal excise taxes were 18.4 cents per gallon and State excise taxes averaged 21.5 cents per gallon.2 Eleven States levy additional State sales and other taxes, some of which are applied to the Federal and State excise taxes. Additional county and city taxes can have a significant impact on the price of gasoline in some locations. From 2000 to 2007, taxes averaged about 24% of the retail gasoline price.
2Energy Information Administration, Petroleum Marketing Monthly, December 2007. Table EN1 at:
http://www.eia.doe.gov/pub/oil_gas/petroleum/data_publications/petroleum_marketing_monthly/historical/2007/2007_12/pdf/enote.pdfRefining costs and profits were about 17% of the national average retail price of regular gasoline in 2007, close to the 2000 to 2007 average of 16%. This component’s share varies from region to region mainly due to the different gasoline formulations required in different parts of the country.
Distribution, marketing, and retail dealer costs and profits in 2007 were 10% of the gasoline price, down from the 2000 to 2007 average of 12%. Most gasoline is shipped from the refinery first by pipeline to terminals near consuming areas where it may be blended with other products (such as ethanol) to meet local government and market specifications, and is then delivered by tanker truck to individual stations. Some retail outlets are owned and operated by refiners, while others are independent businesses that purchase gasoline from refiners and marketers for resale to the public. The price on the pump includes the retailer’s cost to purchase the finished gasoline and the costs of operating the service station. It also reflects local market conditions and factors, such as the desirability of the location and the marketing strategy of the owner.Why do gasoline prices fluctuate?
Retail gasoline prices are mainly affected by crude oil prices and the level of gasoline supply relative to demand. Strong and increasing demand for gasoline and other petroleum products in the United States and the rest of the world is exerting intense pressure on available supplies. Even when crude oil prices are stable, gasoline prices fluctuate due to seasonal demand and local retail station competition. Gasoline prices can change rapidly if something disrupts the supply of crude oil or if there are problems at refineries or with delivery pipelines.
Seasonal demand for gasoline Retail gasoline prices tend to gradually rise in the spring and peak in late summer when people drive more, and then drop in the winter. Good weather and vacations cause U.S. summer gasoline demand to average about 5% higher than during the rest of the year. If crude oil prices do not change, gasoline prices typically increase by 10-20 cents from January to the summer.
Crude oil supply and prices – Crude oil prices are determined by worldwide supply and demand. Events in crude oil markets that caused spikes in crude oil prices were a major factor in all but one of the five major run-ups in gasoline prices between 1992 and 1997, according to the National Petroleum Council’s study “U.S. Petroleum Supply - Inventory Dynamics.” Rapid gasoline price increases occurred in response to crude oil shortages caused by the Arab oil embargo in 1973, the Iranian revolution in 1978, the Iran/Iraq war in 1980, and the Persian Gulf conflict in 1990. The cost of crude oil has been the main contributor to recent increases in gasoline prices. World crude oil prices reached record levels in 2007 due mainly to high worldwide oil demand relative to supply. Other factors contributing to higher crude oil prices include political events and conflicts in some major oil producing regions, as well as other factors such as the declining value of the U.S. dollar (the currency at which crude oil is traded globally).The Organization of Petroleum Exporting Countries (OPEC) has significant influence on world oil prices, because its members produce over 40% of the world’s crude oil and have more than two-thirds of the world’s estimated crude oil reserves. OPEC members are also the only countries that have “spare production capacity” and the ability to bring more oil into production relatively quickly. Since it was organized in 1960, OPEC has tried to keep world oil prices at a target level by setting production levels for its members.
Figure 2. Average Annual U.S. Motor Gasoline Prices, 1994 to 2007,
by Grade.
Gasoline supply and demand imbalances – Gasoline prices tend to increase as the available supply of gasoline grows smaller relative to real or expected demand or consumption. The supply of gasoline is a function of crude oil supply and refining, imports of refined gasoline, and gasoline inventories (stocks). Stocks are the cushion between major short-term supply and demand imbalances, and their levels can have a significant impact on gasoline prices. If refinery or pipeline problems and/or reductions in imports cause supplies to decline unexpectedly, gasoline inventories (stocks) may drop rapidly. This may cause wholesalers to bid higher for available supply over concern that future supplies may not be adequate. Imbalances have also occurred when a region has changed from one fuel type to another (e.g., to cleaner-burning gasoline) as refiners, distributors, and marketers adjust to the new product. Gasoline may be less expensive in one summer when supplies are plentiful vs. another summer when they are not. Prices for all commodities fluctuate, but gasoline prices are generally more volatile than prices of other goods. For example, consumers generally have options to substitute between food products when prices change but most do not have that option for fueling their vehicles.
Why are gasoline prices higher in some regions than in others?
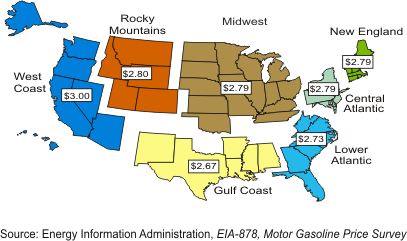
Although price levels vary over time, Energy Information Administration (EIA) data indicate that average retail gasoline prices are often highest in certain States or regions (Figure 3). Besides taxes, there are other factors that contribute to regional and even local differences in gasoline prices:
Distance from supply – Retail gasoline prices tend to be higher with greater distance from the source of supply: ports, refineries, and pipeline and blending terminals. About 66% of the crude oil processed by U.S. refineries in 2007 was imported, with most transported by ocean tankers. The U.S. Gulf Coast is the source of about 40% of the gasoline produced in the United States and the starting point for most major gasoline pipelines.Supply disruptions - Any event that slows or stops production of gasoline for even a short time, such as planned or unplanned refinery maintenance or the refinery shutdowns that occurred when the Hurricanes Katrina and Rita hit the Gulf Coast in 2005, can prompt bidding for available supplies. If the transportation system cannot support the fl ow of surplus supplies from one region to another, prices will remain comparatively high.
Figure 3. 2007 Average Regular Grade Gasoline Prices at Retail Outlets
by Region (dollars per gallon, including taxes).
Retail competition and operating costs – Pump prices are often highest in locations with few retail gasoline stations. Even stations located close together have may have different traffic patterns, rents, and sources of supply that influence their pricing. Drivers face a trade-off between stations with high prices and the inconvenience of driving further to find a station with lower prices.
Environmental programs - Some areas of the country are required to use special “reformulated” gasoline with additives to help reduce carbon monoxide, smog, and air toxics that result when gasoline is burned or when gasoline evaporates during fueling. Other environmental programs put restrictions on fuel transportation and storage. These programs tend to add to the cost of producing, storing, and distributing gasoline. About a third of the gasoline sold in the U.S. is reformulated. Each oil company prepares its own formulation to meet Federal emission standards.How do gasoline prices in 2007 compare with historical prices?
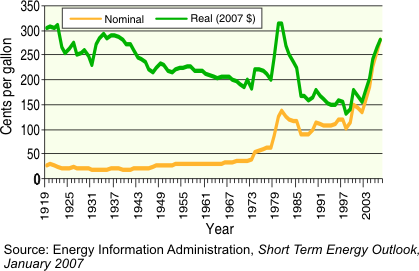
There are two ways to compare recent prices with historical prices. One is to compare the price actually paid at the pump or the “nominal” price. The other is to compare the “real” price, which is the price adjusted for inflation, so that prices in the past are in “today’s” dollar value. The figure below shows the average annual nominal and real prices of regular gasoline from 1919 to 2007, where the real price is based on the value of the dollar in 2007. During that period, consumers paid the highest prices for gasoline in real terms in the early 1920’s and 1980’s.
Figure 4. Historical Average Annual Gasoline Prices - Nominal and Real
(Regular Grade).
Why are California Gasoline Prices more Variable Than others?
California prices are higher and more variable than prices in other States because there are relatively few supply sources of its unique blend of gasoline outside the State. The State of California’s reformulated gasoline program is more stringent than the Federal government’s. In addition to the higher cost of this cleaner fuel, there is a State sales tax of 7.25 percent on top of an 18.4 cent-per-gallon Federal excise tax and an 18.0 cent-per-gallon State excise tax.
California refineries need to be running near full capacity to meet the State’s gasoline demand. If more than one of its refineries experiences operating problems at the same time, California’s gasoline supply may become very tight and prices can soar. Even when supplies can be obtained from some Gulf Coast and foreign refineries, they can take a relatively long time to arrive due to California’s substantial distance from those sources. The farther away the necessary relief supplies are, the higher and longer the price spike will be.California was one of the first States to ban the gasoline oxygenate additive methyl tertiary butyl ether (MTBE) after it was detected in ground water. Ethanol, a non-petroleum product usually made from corn, is being used in place of MTBE. Gasoline with ethanol requires changes in the way gasoline is produced and distributed. Some supply dislocations and price surges occurred in the summer of 2003 as the State moved to ethanol and away from MTBE. Similar problems have also occurred as a result of other fuel transitions.
The Energy Information Administration(EIA) is an independent statistical agency, within the U.S. Department of Energy. whose purpose is to provide reliable and unbiased energy information.
For further information, contact:
National Energy Information Center, NEIC
Energy Information Administration
1000 Independence Ave., SW
Washington, DC 20585
Telephone: 202.586.8800, 9:00am-5:00pm Eastern time.
E-mail: infoctr@eia.doe.gov---normal response is 3 business days.
This and other consumer-oriented brochures can be accessed on the Web at: http://tonto.eia.doe.gov/reports/reportsA.asp?type=other
For links to current gasoline prices and analyses, see:
http://tonto.eia.doe.gov/oog/info/gdu/gasdiesel.aspEIA’s Web Site: www.eia.doe.gov