|
|
HOME > Expert Assessments > Degree Day Assessment
|

|
|
| |
Final cooling degree day statistics
for the 2006 season (May - September 2006)
National total cooling degree day statistics
for the 2006 season (May - September 2006)
Final cooling degree day statistics
for the 2004 season (May - September 2004)
Final heating degree day statistics
for the 2003-2004 season (November 2003 - March 2004) [PDF version]
Final cooling degree day statistics
for the 2003 season (May - September 2003) [PDF version]
Chart comparing area- and population-weighted 48-state
average observed and normal CDD's for the 2003 season [PDF version]
Final heating degree day statistics
for the 2002/03 season (November 2002 - March 2003) [PDF version]
Chart comparing area- and population-weighted 48-state
average observed and normal HDD's for the 2002/03 season [PDF version]
Final cooling degree day statistics
for the 2002 season (May - September 2002)
|
| |
|
The CPC weekly Degree Day
Assessment discusses the Heating Degree Day (HDD) or Cooling Degree Day
(CDD) outlook for the coming week, and reviews temperature and degree day
statistics for the past week and the heating season (November - March) or
cooling season (May - September) to date. This Assessment can assist energy
managers in anticipating and analyzing fuel demand, because degree days
quantitatively reflect the public need for energy to heat and cool businesses
and dwellings.
For any individual day, degree
days indicate how far that day's average temperature departed from 65
degrees F. HDD's, which measure heating energy
demand, indicate how far the average temperature fell below 65 degrees F
(since cooler weather means more heating fuel demand). Similarly,
which measure cooling energy demand, indicate
how far the temperature averaged above 65 degrees F. In both cases, smaller
values represent less fuel demand, but values below 0 are set equal to 0,
because energy demand cannot be negative. Furthermore, since energy demand
is cumulative, degree day totals for periods exceeding 1 day are simply the
sum of each individual day's degree day total. For example, if some
location had a mean temperature of 60 degrees F on day 1 and 80 degrees F
on day 2, there would be 5 HDD's for day 1 (65
minus 60) and 0 for day 2 (65 minus 80, set to 0 since degree days cannot
be negative). For the day 1 + day 2 period, the
HDD total would be 5 + 0 = 5. In contrast, there would be 0
CDD's for day 1 (60 minus 65, reset to 0), 15
CDD's for day 2 (80 minus 65), resulting in a 2-day CDD
total of 0 + 15 = 15.
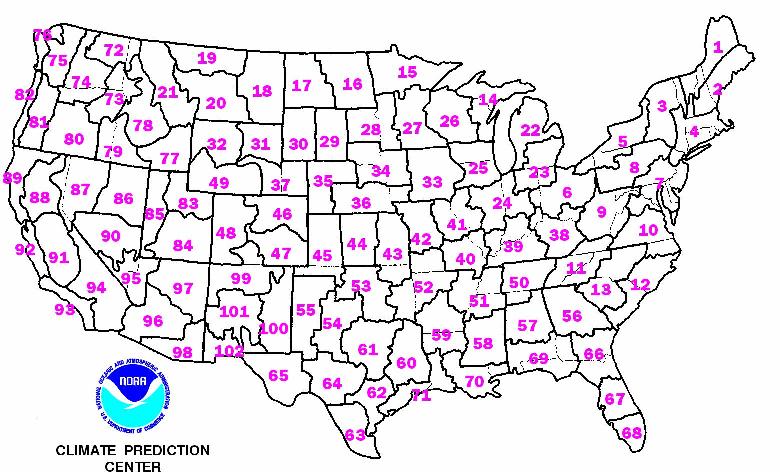
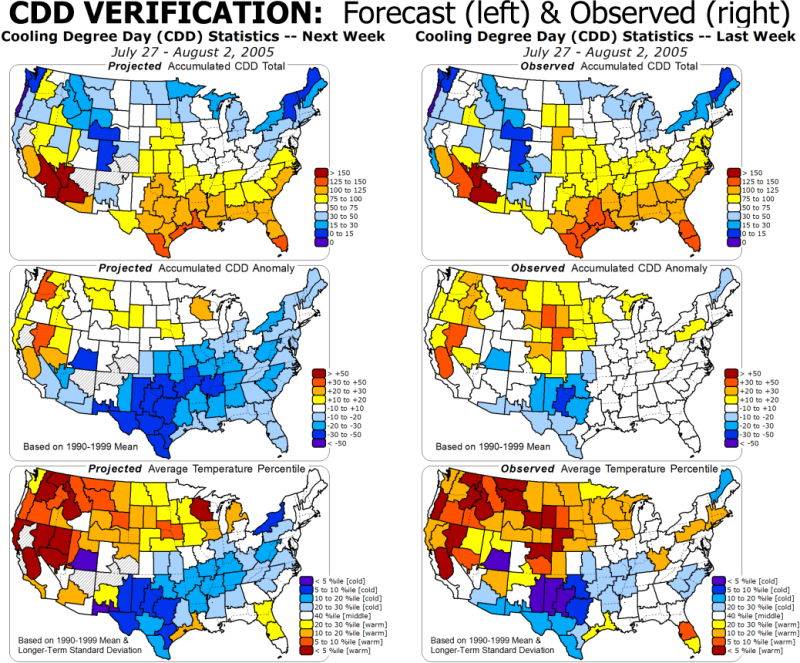
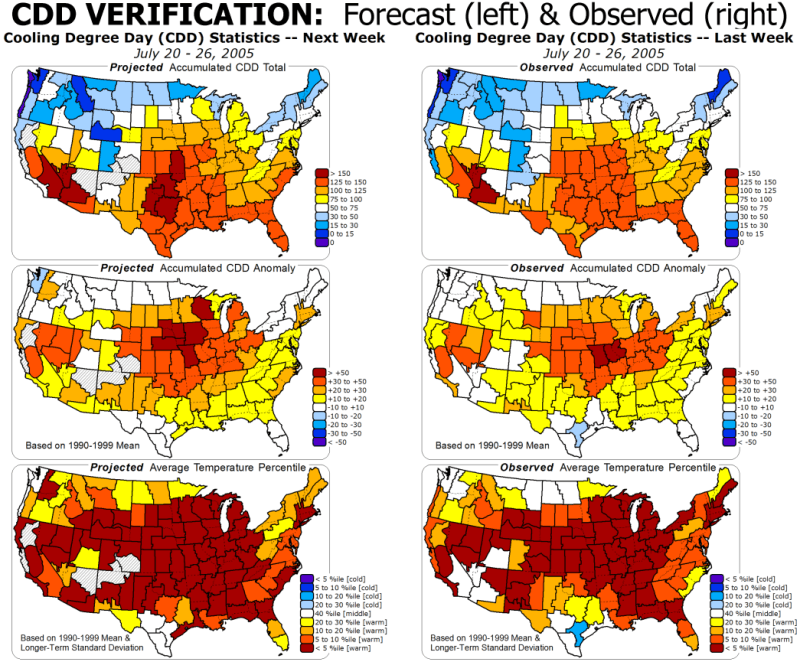
In this Assessment, degree day
and temperature statistics are based on areally-averaged
numbers for each of 102 climate regions of approximately equal area that
cover the contiguous 48 states.
[NOTE: HDD forecast statistics are
not available for some areas because of data problems. These are indicated
by gray shading on the maps showing U. S. Climate Region statistics. We are
investigating this problem and hope to have it resolved soon. The Climate
Prediction Center apologizes for any inconvenience this might cause.]
|
| |
-
Supplementary Information
|
|
Outlook Maps, Graphs, and Tables
The CPC produces U.S. outlook maps for degree days, departures from normal,
and average temperature percentile; tables of population-weighted state,
regional, and national averages by state; and probability of exceedence graphs.
|
| |
-
U.S. Degree Day Outlook Maps by U.S.
Climate Regions Based on output statistics from the Medium Range Forecast Model (MRFMOS).
-
State Degree Day Outlook Tables
Monitoring & Data
The CPC produces maps showing observed degree days, departures from normal, averaged temperature
percentile, and winter energy savings based on temperature; and provides station and regional data.
- Current Statistics (Observed) by State
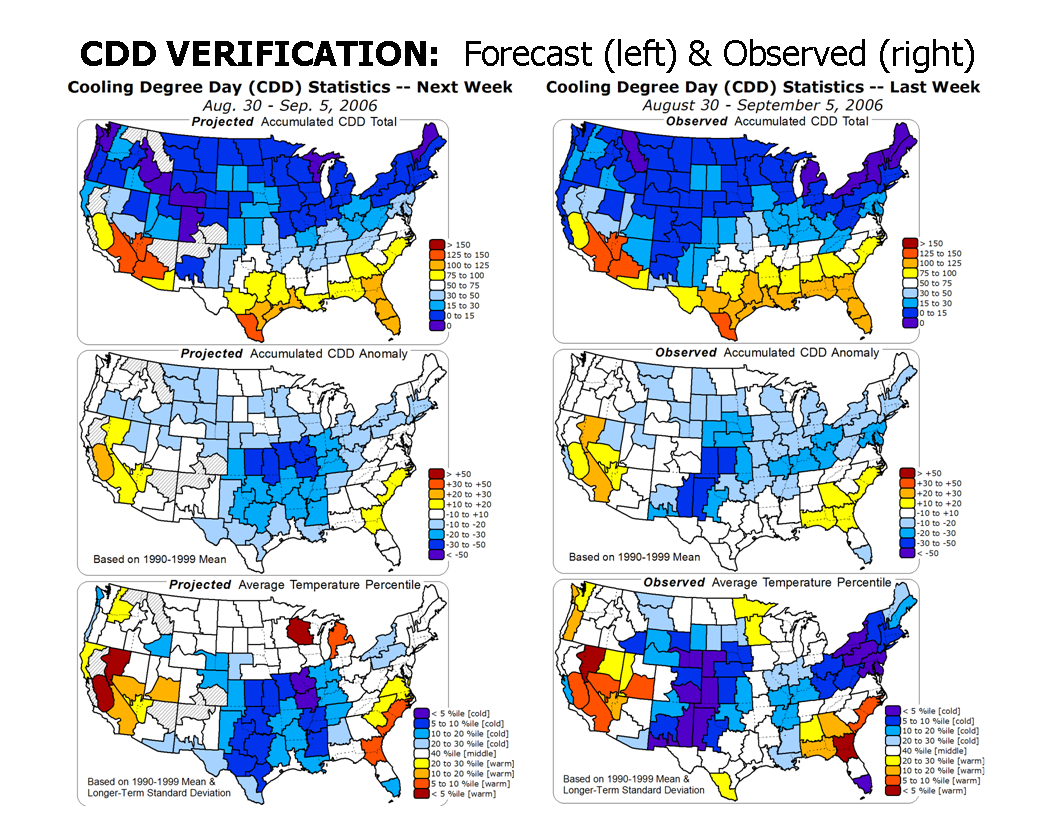
Maps comparing forecast and observed degree day statistics
- September 6 - 12, 2006 CDD
- August 30 - September 5, 2006 CDD
- August 16 - 22, 2006 CDD
- August 9 - 15, 2006 CDD
- May 31 - June 6, 2006 CDD
- May 24 - 30, 2006 CDD
- March 15 - 21, 2006 HDD
- March 1 - 7, 2006 HDD
- February 22 - 28, 2006 HDD
- February 15 - 21, 2006 HDD
- February 8 - 14, 2006 HDD
- January 25 - 31, 2006 HDD
- January 18 - 24, 2006 HDD
- January 4 - 10, 2006 HDD
- December 14 - 20, 2005 HDD
- December 7 - 13, 2005 HDD
- September 21 - 27, 2005 CDD
- September 14 - 20, 2005 CDD
- September 7 - 13, 2005 CDD
- August 31 - September 6, 2005 CDD
- August 24 - 30, 2005 CDD
- August 17 - 23, 2005 CDD
- August 10 - 16, 2005 CDD
- August 3 - 9, 2005 CDD
- July 27 - August 2, 2005 CDD
- July 20 - 26, 2005 CDD
- July 13 - 19, 2005 CDD
- May 24 - 30, 2005 CDD
- May 17 - 23, 2005 CDD
- February 22 - 28, 2005 HDD
- February 7 - 13, 2005 HDD
- Jan. 31 - Feb. 6, 2005 HDD
- January 24 - 30, 2005 HDD
- January 17 - 23, 2005 HDD
- December 14 - 20, 2004 HDD
- December 7 - 13, 2004 HDD
- November 30 - December 6, 2004 HDD
- November 23 - 29, 2004 HDD
- November 16 - 22, 2004 HDD
- November 9 - 15, 2004 HDD
- September 14 - 20, 2004 CDD
- August 24 - 30, 2004 CDD
- August 17 - 23, 2004 CDD
- July 27 - August 2, 2004 CDD
- July 20 - 26, 2004 CDD
- July 13 - 19, 2004 CDD
- June 22 - 28, 2004 CDD
- June 15 - 21, 2004 CDD
- June 8 - 14, 2004 CDD
- June 1 - 7, 2004 CDD
- May 18 - 24, 2004 CDD
- Mar. 24 - 30, 2004 HDD
- Feb. 17 - 23, 2004 HDD
- Feb. 10 - 16, 2004 HDD
- Feb. 3 - 9, 2004 HDD
- Jan. 27 - Feb. 2, 2004 HDD
- Jan. 20 - 26, 2004 HDD
- Dec. 22 - 28, 2003 HDD
- Dec. 8 - 14, 2003 HDD
- Dec. 1 - 7, 2003 HDD
- Nov. 17 - 23, 2003 HDD
- Nov. 10 - 16, 2003 HDD
- Sep. 15 - 21, 2003 CDD
- Sep. 8 - 14, 2003 CDD
- Sep. 1 - 7, 2003 CDD
- Aug. 18 - 24, 2003 CDD
- Aug. 11 - 17, 2003 CDD
- Aug. 4 - 10, 2003 CDD
- Jul. 28 - Aug. 3, 2003 CDD
- July 21 - 27, 2003 CDD
- July 14 - 20, 2003 CDD
- March 17 - 23, 2003 HDD
- March 10 - 16, 2003 HDD
- March 3 - 9, 2003 HDD
- February 24 - March 2, 2003 HDD
- February 3 - 9, 2003 HDD
- Jan. 27 - Feb. 2, 2003 HDD
- Jan. 14 - 20, 2003 HDD
- Jan. 7 - 13, 2003 HDD
- Dec. 23 - 30, 2002 HDD
- Dec. 16 - 22, 2002 HDD
- Dec. 9 - 15, 2002 HDD
- Dec. 2 - 8, 2002 HDD
- Nov. 25 - Dec. 1, 2002 HDD
- Nov. 18 - 24, 2002 HDD
- August 5 - 11, 2002 CDD
- May 21 - 27, 2002 CDD
- May 14 - 20, 2002 CDD
- March 24 - 30, 2002 HDD
- January 28 - February 3, 2002 HDD
- January 21 - 27, 2002 HDD
- January 14 - 20, 2002 HDD
- January 7 - 13, 2002 HDD
- December 31, 2001 - January 6, 2002 HDD
- December 3 - 9, 2001 HDD
- November 12 - 18, 2001 HDD
- November 5 - 11, 2001 HDD
- September 17 - 23, 2001 CDD
- September 10 - 16, 2001 CDD
- August 20 - 26, 2001 CDD
- July 30 - August 5, 2001 CDD
- July 23 - 29, 2001 CDD
- July 16 - 22, 2001 CDD
- June 11 - 17, 2001 CDD
- June 4 - 10, 2001 CDD
- May 28 - June 3, 2001 CDD
- May 21 - 27, 2001 CDD
- March 12 - 18, 2001 HDD
- March 5 - 11, 2001 HDD
- February26 - March 4, 2001 HDD
- February 19 - 25, 2001 HDD
- January 22 - 28, 2001 HDD
- December 26, 2000 - January 1, 2001 HDD
- December 11 - 17, 2000 HDD
- December 4 - 10, 2000 HDD
- November 27 - December 3, 2000 HDD
- November 20 - 26, 2000 HDD
- November 13 - 19, 2000 HDD
- November 6 - 12, 2000 HDD
- October 23 - 29, 2000 CDD
- October 16 - 22, 2000 CDD
- Prior Verification Maps
|
|
|
|


