
Scientific Advances
While the greatest scientific payoff is expected when the earthquake occurs, our understanding of the earthquake process has already been advanced through investigations at Parkfield. To date, more than 175 research articles connected with the Parkfield Experiment have been published. Some of the highlights are described below.
-
3-D Imaging of the San Andreas Fault Using High Resolution Earthquake Locations
Bill Ellsworth, Felix Waldhauser and Alex Cole, USGS, Menlo Park, California
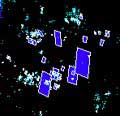
View earthquakes at Parkfield in 3-D. Rotate and zoom with your mouse. These earthquake locations were obtained with the "double difference" method, developed at the USGS by the authors, which provides extremely high resolution and reveals structure not seen in earthquake catalogs produced with conventional methodlogy. This presentation requires that your browser be Java-enabled.
-
Repeating earthquakes

Earthquakes on the San Andreas fault at Parkfield are observed to occur as repeat ruptures of discrete patches on the fault surface, on scales from tens of meters to tens of kilometers. The repeats occur more or less regularly in time. Are such repeats unique to Parkfield or do they occur on all faults and for all magnitudes?
-
Earthquake Streaks
Allan Rubin and others, Nature, 1999

Very accurate locations of microearthquakes, obtained with the "double difference" location method, reveal concentrated streaks on the creeping section of the San Andreas fault, northwest of Parkfield. The streaks, which are approximately horizontal, are separated by areas with few or no earthquakes. The underlying cause of this structural organization of the fault surface remains to be determined.
-
Response of the San Andreas Fault to the 1983 Coalinga-Nu–ez Earthquakes: An Application of Interaction-based Probabilities for Parkfield
Shinji Toda, Earthquake Research Institute, University of Tokyo, Japan
Ross S. Stein, USGS, Menlo Park, California
Stress changes caused by two large earthquakes northeast of the San Andreas fault in 1983 increased stress on the creeping section of the fault, causing the rate of small shocks to rise for about 18 months. The shocks also decreased stress on the locked Parkfield segment, causing surface creep and seismicity rates to drop there for more than 6 years. These 1983 shocks temporarilly reduced the 10-year probability of a M~6 Parkfield earthquake.
-
Three-dimensional velocity structure on the San Andreas fault
Donna Eberhart-Phillips and Andrew J. Michael, U.S. Geological Survey, Menlo Park, CA, JGR, 1993

The San Andreas fault is characterized by a sharp change in velocity (5-20%) over a 4-km width. The changes suggest variations in the material properties of the crust at depth, which may play a key role in fault segmentation and deformation style. There may be a general relation between increasing velocity and increasing ability of the rock to store strain energy and release it in brittle failure. Here, in map view, high-velocity rock southwest of the fault (red) contrasts with lower velocity rocks (yellow, green) to the northeast. The velocity structure corresponds well with a magnetic anomaly (contours) mapped by R. Jachens, USGS.
-
Slip Deficit on the San Andreas Fault at Parkfield Revealed by Inversion of Geodetic Data
Jessica Murray et al. Geophys. Res. Let., 2001, Stanford University
Paul Segall and Ruth Harris, Science, 1986 and JGR, 1987, Ruth Harris and Paul Segall, JGR, 1987
Analysis of GPS data and of repeated surveys of geodetic lines that cross the San Andreas fault suggest that the Parkfield rupture surface has not slipped significantly since 1966, while the contemporary slip rate at depth is approximately 33 mm/yr. The locked portion of the fault corresponds closely with the boundary between the Pacific and North American plates region of aftershocks in 1966. The hypocenter of the 1966 earthquake (star) is located at the northwest end of the modeled locked area.
-
Geophysical Imaging of the San Andreas Fault
Robert Jachens (USGS) and colleagues at GUMP

Potential field geophysical data and surficial geology are being used to construct an initial 3-D digital model of the upper crust surrounding the San Andreas fault near the site of the proposed SAFOD deep scientific drillhole. Summary maps of geology, isostatic gravity, aeromagnetic and ground magnetic data.
-
Stress Diffusion Along the San Andreas Fault
Peter Malin and M.G. Alverez, Duke University, Science, 1992

Beginning in 1990, the epicenters of microearthquakes associated with a 12-month increase in seismicity moved from northwest to southeast along the creeping section of the fault northwest of Parkfield. At the same time, the locally variable rate of seismic moment increased, suggesting an increase in fault slip. These data suggest that a southeastwardly diffusing stress front propagated along the fault at a speed of 30-50 km/year.
-
Slip-rate increase detected by high-precision EDM and borehole tensor strainmeters
John Langbein (USGS) and R. L. Gwyther, R. H. G. Hart, and M. T. Gladwin (C.S.I.R.O) and Pinjarra Hills, (QLD, Australia) Geophysical Research Letters, 1999

Two of the instrument networks at Parkfield, California, the two-color Electronic Distance Meter (EDM) network and Borehole Tensor Strainmeter (BTSM) network, has detected a rate change starting in 1993 that persisted at least 5 years. Both the spatial coherence of the rate change and hydrological modeling suggest a tectonic explanation for the rate change. From these observations, one can infer that the rate of slip increased over the period 1993-1998.
-
Numerical Earthquake Simulation Models - an animation
Terry Tullis, Brown University

This simple model of the San Andreas fault at Parkfield shows strain accumulation and release from 10 years before to 10 years after an earthquake.
-
Crustal fluids and earthquakes
Evelyn Roeloffs, USGS, Vancouver, Washington

Fault-zoned fluids play an important role in generating earthquakes. High pressure fluid in the fault zone may reduce the frictional strength of the fault. Variations in fluid pressure may affect the timing of earthquakes (Miller, 1996). Data collected at Parkfield allow some of these hypotheses to be tested.
