Station Data
|
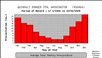
 Southern Regional Temperature/ Precipitation Plots
- Climatology plots for cities in the southeastern US from the Sothern Regional Climate Center.
|

|
-
US and Global Station Data
- Use Climvis to plot time-series of station climate data or contour/vectors map analyses for a region at one time.
Station data is available globally w/some limitations and
variables may include temperature (maximum, minimum and mean), winds, moisture, precipitation,
pressure, snowfall, degree days, sunshine and visibility.
Time-series plots for US climate division data (temperature, precipitation and Palmer Drought Index) and
contour plots of GHCN temperature and precipitation are also available.
From NOAA's National Climate Data Center (NCDC).
|

|
-
Western Regional Climate Center
- Western Regional climate center station data plots. Plot "normals" for station data in the western US. Variables
include precipitation and temperature and statistics include monthly and daily averages, rainfall probabilities and related
quantities.
|
|
Climate Datasets
|
|
-
NOMADS Climate Model Output:GFDL
- Users can plot Climate Model variables: Currently they have Dec-Cen and ocean assimilation datasets.
|
|
-
TAO Buoy Data
- Users can plot TAO buoy data.
|

|
-
Live Access to PMEL Data
- Users can plot PMEL data.
|

|
-
Get and Plot IRI/LDEO Datasets
- Users can plot various datasets. Choose dataset of interest. The plotting options are at top of page that is retunred.
|

|
-
EPIC
- The EPIC Web Browser is Web application that provides interactive on-line data access to EPIC hydrographic data sets.
It allows user to view the oceanographic in-situ data by creating plots on-the-fly, generating listings, data downloading etc.
Current EPIC Web Browser provides more than 1.5 million profile (such as CTD, Bottle, and XBT data from Pacific, FOCI, Puget Sound, VENTS, and NODC World Ocean Database, etc.) and time series (such as surface meteorology data, ocean data , and drifter buoy data from Alaska, Arctic, Puget Sound, etc. and Sea Level data from University Hawaii Sea Level Center).
|
|
-
NGDC Palmer Drought Index
- Palmer Drought Index for the US derived from tree-ring and/or instrumental data from 1700-1995.
From the Paleoclimate division of NOAA's National Geophysical Data Center.
|

|
Time-Series Analysis
|
|
-
Random Signals and Noise
- Look at distributions,autocorrelations and other statistics of various types time-series. Time-series types
include gaussian distributed, exponential, and white. Interactive javascripts allow users can to observe the effects of
changing different parameters. From the Georgia Institute of Technology School of Electrical and Computer Engineering.course in random signals and noise.
|
|
-
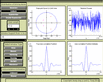
Wavelet Analysis
Many time series are "non-stationary," varying in both amplitude and
frequency over long periods of time. Wavelet analysis is a technique
that decomposes a time series into time/frequency space
simultaneously. By doing so, one can get information on both the
amplitude of any "periodic" signals within the series, and how this amplitude
varies with time. This interactive page allows the user to plot these
amplitudes of a selected time series at various periodicities through time.
Several ocean and atmospheric time series are available.
|

|
|
Climate Tools
|
-
CDAT Climate Tools
Climate Data Analysis Tools, or CDAT, is a Python-based, easily extendible system for accessing and analyzing climate data. It contains a generally useful system
for scientific graphics. Some of the key components supplied by PCMDI include:
cdms : a package that enables access to many different data
file formats;
cdutil : a package containing utility functions for climatology and
averaging;
genutil: a package containing statistics functions with special
features for climate data
vcs : a two-dimensional graphics package.
vcdat : a gui interface to cdat
 CDO: CDO:- CDO (Climate Data Operators) is a collection of command line Operators to manipulate and analyse Climate model Data. It was developed at the Max-Planck Institute. It can do such things as calculate derived meterological variables, calculate weather statistics, do regression, interpolate in time and space. Doc is available.
|
|
|