

Radar Wind Profiler and Doppler Sodar
Introduction
In recent years, remote sensing has played an increasingly important role in studying the atmospheric boundary layer
(air near the earth's surface). Ground-based remote profilers have gained a reputation as effective tools for acquiring upper air
information. FRD maintains two unique portable remote sensors (a radar wind profile and a sodar), that are used to acquire wind profiles in the atmospheric boundary layer.
|
|
Although a knowledge of surface winds is important, so also is a knowledge of winds at various altitudes
above the surface. The entire atmosphere is coupled together and what happens at higher altitudes
also affects surface weather. The equipment described here can be used to support an atmoshperic tracer
study or it can be used independently.
|
Instrument Description
The 915-MHz Radian phased-array Doppler radar wind profiler has a
range of approximately 150 to 4000 m with a vertical resolution of 60 to 100 m.
The remotely-sensed measurements include
- horizontal wind speed (U),
- horizontal wind direction (2),
- standard deviation of the horizontal wind direction (F2),
- and vertical wind speed (W).
In addition, the radar estimates the refractive
index structure parameter (CN2). This value is a direct
measurement of the turbulent intensity of humidity fluctuations in the
atmospheric boundary layer and is useful for estimating the mixed layer height (zi).
A Radian 600PA phased-array Doppler sodar transmits an adjustable 1.5 to 3 KHz acoustic signal and has a range of about 50 to
800 m with a resolution of
about 10 to 50 m. The sodar acquires the same wind field data (U, 2,
F2,
W) as the radar profiler, but also calculates the standard deviation of the vertical wind speed (Fw).
The backscatter information acquired by the sodar is directly related to the
temperature structure function (CT2). This measurement is
useful in depicting inversion layers and other regions where temperature
gradients exist.
Both systems transmit their respective signals in pulses.
Each pulse is both reflected and absorbed by the atmosphere as it moves upwards. The
vertical range of each pulse is determined by how high it can go before the
signal becomes so weak that the energy reflected back to the antenna can no
longer be detected. That is, as long as the reflected pulses can be discerned
from background noise, meaningful wind velocities can be obtained by comparing
the Doppler shift of the output signal to that of the return signal. The
attenuation of the pulses are functions of signal type, signal power, and
atmospheric conditions.
| |
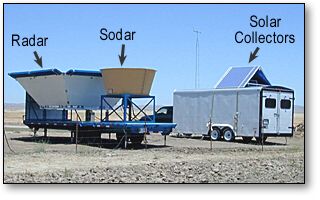
Doppler radar and Doppler sodar. Computer systems are protected within the support trailer (white) that is
heated or cooled to maintain an acceptable temperature.
The radar and
sodar are each controlled by their own PC. These two computers are networked into a "hub" computer using
NodeRunner 2000/C self-describing Internet cards with LANtastic 6.0 network
software. Remote
access into the hub computer is possible via telephone line and a high speed
modem. Data from the hub computer can also be downloaded by File Transfer
Protocol (FTP) through an Internet connection.
|
Instrument Portability
The radar and sodar are mounted on a 7-m flatbed trailer. The
radar sits on the front end of the trailer with the sodar in the rear. Leveling of the
trailer and sensors is accomplished with seven jacks mounted along the sides and
front of the trailer. All of the electronics are sheltered in a separate enclosed
environmentally controlled support trailer. The enclosed trailer is 2.4 m wide and 5.5 m long.
Both trailers can be easily transported using a pickup truck or full-size van.
The sodar can also be removed from the 7-m flatbed trailer for easier transportation
when the radar profiler is not needed. If there is insufficient space for the support trailer,
the computer and supporting hardware can be installed in a separate box under the sodar. This makes
for a very compact deployment.
|
|

Standalone Doppler sodar installation.
|
Example Results
Below is a plot of wind speed during the course of a day, as measured by the Doppler sodar (results from the Doppler radar
have similar characteristics). Although the plot may seem intimidating at first glance, it is actually relatively easy to read.
For example, at 18 on the x-axis (6:00 p.m.), the wind speed ranges from around 2.5 m/s near the ground, to around 5 m/s at a
height of 400 meters. Other variables can be plotted from the sodar and radar measurements, including wind direction, standard
deviation of the horizontal wind direction, vertical wind speed, and various derived statistics such as data availability, and persistence.


|