Chapter 3. Patient Safety
The Institute of Medicine defined patient safety in its 1999 report, To Err Is Human, as freedom from accidental injury due to medical care or medical errors.1
Importance and Measures
Mortality
| Type of statistic |
Number |
| Number of Americans who die each year from medical errors (1999 est.) |
44,000-98,0001 |
| Number of Americans who die in the hospital each year due to 18 types of medical injuries (2000 est.) |
at least 32,0002 |
Return to Contents
Cost
| Type of statistic |
Number |
| Cost attributable to medical errors (in lost income, disability, and health care costs) (1999 est.) |
$17 billion-$29 billion1 |
Return to Contents
Measures
Much progress has been made in recent years in raising awareness, developing event reporting systems, and developing national standards for data collection. Data remain incomplete for a comprehensive national assessment of patient safety.3 Nevertheless, several measures are available to provide insight into the level of patient safety in the United States.
This year's chapter highlights six core measures relating to postoperative complications, other complications of hospital care, and complications of medications:
- Postoperative care composite: pneumonia, urinary tract infection, and/or venous thromboembolic event.
- Appropriate timing of antibiotics to prevent infections in surgical patients.
- Adverse events associated with central venous catheters.
- Deaths following complications of care.
- Adverse drug events in the hospital.
- Prescription of inappropriate medications to the elderly.
Return to Contents
Findings
Postoperative Complications
Adverse health events can occur during episodes of care, especially during and right after surgery. Although some of the events may be related to a patient's underlying condition, many of them can be avoided if appropriate care is provided.
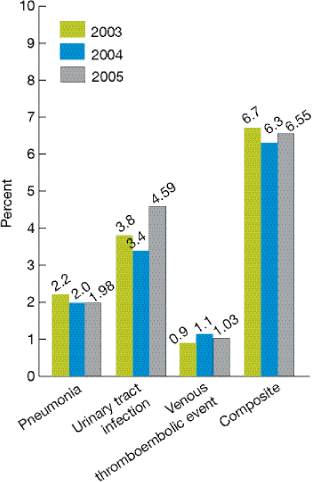
Postoperative care composite: pneumonia, urinary tract infection, or venous thromboembolic event. Complications after surgery may include, but are not limited to, pneumonia, urinary tract infection, and blood clots.
Figure 3.1. Medicare surgical patients with postoperative pneumonia, urinary tract infection, and venous thromboembolic event and composite, 2003-2005
Source: Centers for Medicare & Medicaid Services, Medicare Patient Safety Monitoring System, 2003-2005.
Denominator: Hospitalized Medicare patients having major surgery and meeting specific criteria for each measure.
Note: In 2005, the measure for postoperative urinary tract infection was refined to include only major surgery patients with catheter-associated urinary tract infection. Standard errors for estimates of the percentages of surgical patients with postoperative complications in 2003 were imputed, based on standard errors for estimates in 2005.
- From 2003 to 2005, the percentage of surgical patients with postoperative pneumonia or a venous thromboembolic event did not change significantly (Figure 3.1). The percentage of surgical patients who developed a urinary tract infection did show a slight increase; however, it should be noted that this measure changed in 2005 to include only patients with catheter-associated urinary tract infection.
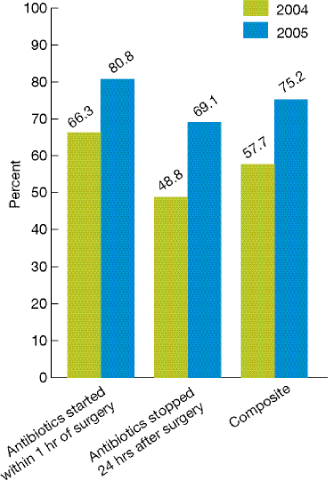
Appropriate timing of antibiotics among surgical patients. Infections acquired during hospital care (nosocomial infections) are one of the most serious safety concerns. A common hospital-acquired infection is a wound infection following surgery. Hospitals can reduce the risk of wound infection after surgery by making sure patients get the right antibiotics at the right time on the day of their surgery. Research shows that surgery patients who get antibiotics within the hour before their operation are less likely to get wound infections; getting an antibiotic earlier, or after surgery begins, is not as effective. However, taking these antibiotics for more than 24 hours after routine surgery is usually not necessary and can increase the risk of side effects such as stomach aches, serious types of diarrhea, and antibiotic resistance. Among adult Medicare patients having surgery, the NHQR tracks receipt of antibiotics within 1 hour prior to surgical incision, discontinuation of antibiotics within 24 hours after end of surgery, and a composite of these two measures.
Figure 3.2. Appropriate timing of antibiotics received by adult patients having surgery, overall composite and two components, 2004 and 2005
Source: Centers for Medicare & Medicaid Services, Quality Improvement Organization Program, 2004 and 2005.
Denominator: Hospitalized patients having surgery.
Note: Beginning in 2005, the data collection method changed from the abstraction of randomly selected medical records for Medicare beneficiaries to the receipt of hospital self-reported data for all payer types.
- In 2005, 80.8% of adult patients having surgery received antibiotics within 1 hour of surgery, and 69.1% had their antibiotics stopped within 24 hours of surgery (Figure 3.2).
- Appropriate timing of antibiotics received by adult patients having surgery improved significantly between 2004 (57.7%) and 2005 (75.2%), both overall and for the two components of the composite measure.
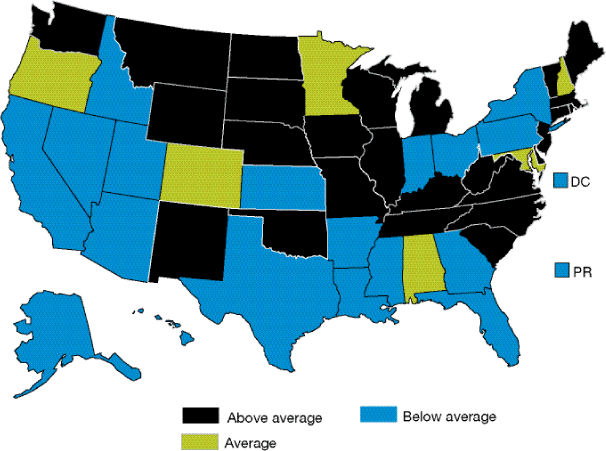
Figure 3.3. State variation: Appropriate timing of antibiotics received by adult patients having surgery, 2005
Source: Centers for Medicare & Medicaid Services, Quality Improvement Organization Program, 2005.
Key: Above average = appropriate timing of prophylactic antibiotics is significantly above the all States average in 2005. Below average = appropriate timing of prophylactic antibiotics is significantly below the all States average in 2005.
Denominator: Hospitalized patients having surgery.
Note: "All States average" is the average of all responding States (52 in this case, including the District of Columbia and Puerto Rico), which is a separate figure from the national average.
- Variation was seen among States in the overall timing of prophylactic antibiotics (Figure 3.3). In 2005, the all States average was 75.2% and ranged from 54.6% to 89.8%.
- Twenty-six Statesi were significantly above the all States average in 2005, with a combined average rate of 80.8%.
- Twenty Statesii were significantly below the all States average in 2005, with a combined average rate of 67.6%.
i The States were Connecticut, Delaware, Illinois, Iowa, Kentucky, Maine, Massachusetts, Michigan, Missouri, Montana, Nebraska, New Jersey, New Mexico, North Carolina, North Dakota, Oklahoma, Rhode Island, South Carolina, South Dakota, Tennessee, Vermont, Virginia, Washington, West Virginia, Wisconsin, and Wyoming.
ii The States were Alaska, Arizona, Arkansas, California, District of Columbia, Florida, Georgia, Hawaii, Idaho, Indiana, Kansas, Louisiana, Mississippi, Nevada, New York, Ohio, Pennsylvania, Puerto Rico, Texas, and Utah.
Other Complications of Hospital Care
Besides surgery, other types of care delivered in hospitals can place patients at risk for injury or death.
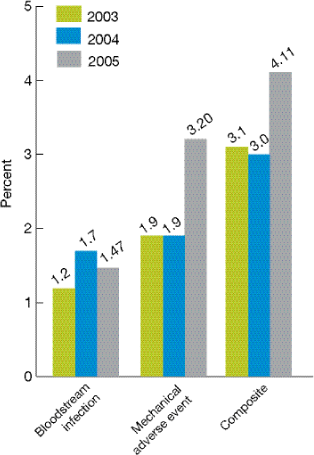
Adverse events associated with central venous catheters. Patients who require a central venous catheter to be inserted into the great vessels leading to the heart tend to be severely ill. However, the placement and use of these catheters can result in infections and other complications.
Figure 3.4. Central venous catheter placements with bloodstream infection or associated mechanical adverse events among Medicare patients, overall composite and two components, 2003-2005
Source: Centers for Medicare & Medicaid Services, Medicare Patient Safety Monitoring System, 2003-2005.
Denominator: Hospitalized Medicare patients with central venous catheter placement.
Note: Mechanical adverse events include allergic reaction, tamponade, perforation, pneumothorax, hematoma, shearing off of the catheter, air embolism, misplaced catheter, thrombosis/embolism, knotting of the pulmonary artery catheter, and certain other events.
- From 2004 to 2005, there were significant increases in the percentage of central venous catheter placements with associated complications overall (Figure 3.4).
- This increase in the composite measure is due to the significant increase in mechanical adverse events, since the rate of bloodstream infections associated with central venous catheters did not change significantly between 2004 and 2005.
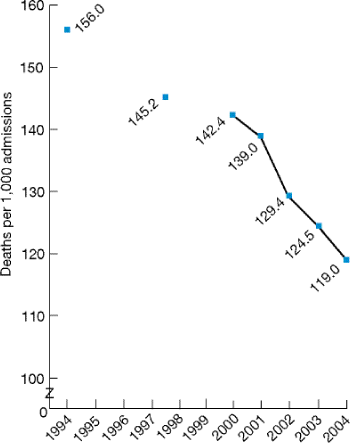
Deaths following complications of care. Many complications that arise during hospital stays cannot be prevented. However, rapid identification and aggressive treatment of complications may prevent these complications from leading to death. This indicator, also called "failure to rescue," tracks deaths among patients whose hospitalizations are complicated by pneumonia, thromboembolic event, sepsis, acute renal failure, gastrointestinal bleeding or acute ulcer, shock, or cardiac arrest.
Figure 3.5. Deaths following complications of care per 1,000 admissions of adults ages 18-74, 1994, 1997, and 2000-2004
Source: Agency for Healthcare Research and Quality, Healthcare Cost and Utilization Project, Nationwide Inpatient Sample, 1994-2004.
Denominator: Patients ages 18-74 years from U.S. community hospitals whose hospitalizations are complicated by pneumonia, thromboembolic event, sepsis, acute renal failure, gastrointestinal bleeding or acute ulcer, shock, or cardiac arrest.
Notes: Rates are adjusted for age, sex, diagnosis-related groups, and comorbidities. Data were analyzed for two selected historical years (1994, 1997) and annually with each NHQR (2000-2004).
- From 1994 to 2004, the rate of deaths following complications of care declined from 156 to 119 per 1,000 admissions of adults ages 18-74 (Figure 3.5).
Complications of Medications
Complications of medications are common safety problems. Some, but not all, adverse drug events may be related to misuse of medication. However, prescribing medications that are inappropriate for a specific population may increase the risk of adverse drug events.
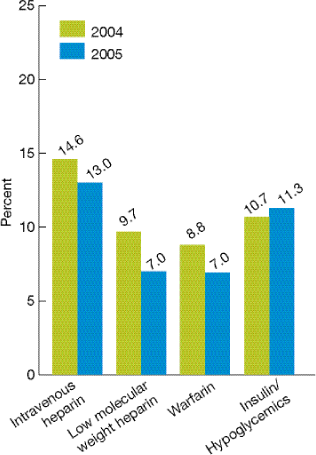
Adverse drug events in the hospital. Some medications used in hospitals can cause serious complications. The Medicare Patient Safety Monitoring System tracks a number of adverse drug events, including serious bleeding associated with intravenous heparin, low-molecular-weight heparin, or warfarin and hypoglycemia associated with insulin or oral hypoglycemics.
Figure 3.6. Medicare patients with adverse drug events, 2004 and 2005
Source: Centers for Medicare & Medicaid Services, Medicare Patient Safety Monitoring System, 2004 and 2005.
Denominators: Hospitalized Medicare patients receiving specified medication.
- In 2005, adverse drug events in the hospital related to some frequently used medications ranged from 6.89% of Medicare patients who received war far in to 13.0% of Medicare patients who received intravenous heparin (Figure 3.6).
- The rates of adverse events associated with low-molecular-weight heparin and war far in decreased significantly between 2004 and 2005.
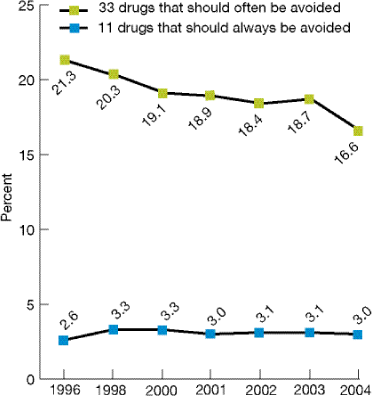
Inappropriate medication use among the elderly. Some drugs are considered potentially harmful for elderly patients but nevertheless were prescribed to them.iii, 4
Figure 3.7. Inappropriate medication use by the elderly, 1996-2004
Source: Agency for Healthcare Research and Quality, Medical Expenditure Panel Survey, 1996-2004.
Reference population: Civilian noninstitutionalized population age 65 and over.
- From 1996 to 2004, the percentage of elderly Americans who reported using at least one inappropriate drug decreased significantly, from 21.3% to 16.6% (Figure 3.7).
- The use of drugs that should always be avoided remained relatively stable over the 1996-2004 time period at about 3%.
iii Drugs that should always be avoided for elderly patients include barbiturates, flurazepam, meprobamate, chlorpropamide, meperidine, pentazocine, trimethobenzamide, belladonna alkaloids, dicyclomine, hyoscyamine, and propantheline. Drugs that should often be avoided for elderly patients include carisoprodol, chlorzoxazone, cyclobenzaprine, metaxalone, methocarbamol, amitriptyline, chlordiazepoxide, diazepam, doxepin, indomethacin, dipyridamole, ticlopidine, methyldopa, reserpine, disopyramide, oxybutynin, chlorpheniramine, cyproheptadine, diphenhydramine, hydroxyzine, promethazine, and propoxyphene.
Return to Contents
References
1. Kohn LT, Corrigan JM, Donaldson MS, editors. Institute of Medicine, Committee on Quality of Health Care in America. To err is human: building a safer health system. Washington, DC: National Academies Press; 1999.
2. Zhan C, Miller MR. Excess length of stay, charges, and mortality attributable to medical injuries during hospitalization. JAMA. 2003 Oct 8;290(14):1868-74.
3. Aspden P, Corrigan JM, Wolcott J, Erickson SM, editors. Institute of Medicine, Committee on Data Standards for Patient Safety. Patient safety: achieving a new standard of care. Washington, DC: National Academies Press; 2004.
4. Zhan C, Sangl J, Bierman AS, et al. Potentially inappropriate medication use in the community-dwelling elderly: findings from the 1996 Medical Expenditure Panel Survey. JAMA. 2001 Dec 12;286(22):2823-29.

