|
BJS home page
Contents of Homicide
trends in the U.S.
Previous
Next
|
Homicide
trends in the U.S.
Trends by gender
Most victims and perpetrators in homicides are
male
| |
Male offender/Male victim |
65.3% |
| |
Male offender/Female victim |
22.7% |
| |
Female offender/Male victim |
9.6% |
| |
Female offender/Female victim |
2.4% |
Both male and female offenders are more likely to target male victims
than female victims.
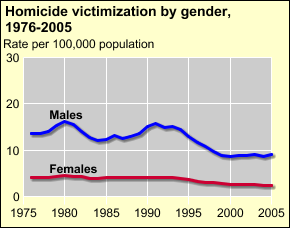
Victimization rates for both males and females have declined in recent
years
- Males were almost 4 times more likely than females to be murdered
in 2005.
- In 2005 rates for females reached their lowest point recorded; rates
for males increased slightly from the low point recorded in 2000.
To view data, click on the chart.
 [D] [D]
For more information about gender patterns in violent victimization
see Key Facts
at a Glance.
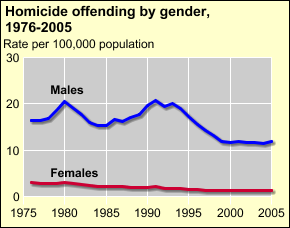
Offending rates for both males and females followed the same pattern
as victimization rates
- Males were almost 10 times more likely than females to commit murder
in 2005.
- The offending rates for females declined since the early 1980's but
stablized after 1999. Offending rates for males peaked in the
early 1990's, fell to record lows,and stablized in recent years.
To view data, click on the chart.
 [D] [D]
The gender distribution of homicide victims and offenders differs
by type of homicide
For the years 1976-2005 combined, among all homicide victims, females are particularly at risk for intimate
killings and sex-related homicides.
Homicide Type by Gender, 1976-2005
|
|
Victims |
|
Offenders |
|
Male |
Female |
|
Male |
Female |
|
All homicides |
76.5% |
23.5% |
|
88.8% |
11.2% |
| Victim/offender relationship |
|
|
|
|
|
|
Intimate |
35.2% |
64.8% |
|
65.5% |
34.5% |
|
Family |
51.5% |
48.5% |
|
70.8% |
29.2% |
|
Infanticide |
54.6% |
45.4% |
|
61.8% |
38.2% |
|
Eldercide |
58.1% |
41.9% |
|
85.2% |
14.8% |
| Circumstances |
|
|
|
|
|
|
Felony murder |
78.4% |
21.6% |
|
93.2% |
6.8% |
|
Sex related |
18.8% |
81.2% |
|
93.6% |
6.4% |
|
Drug related |
90.2% |
9.8% |
|
95.5% |
4.5% |
|
Gang related |
94.7% |
5.3% |
|
98.3% |
1.7% |
|
Argument |
77.8% |
22.2% |
|
85.6% |
14.4% |
|
Workplace |
79.1% |
20.9% |
|
91.3% |
8.7% |
| Weapon |
|
|
|
|
|
|
Gun homicide |
82.7% |
17.3% |
|
91.3% |
8.7% |
|
Arson |
56.4% |
43.6% |
|
79.1% |
20.9% |
|
Poison |
55.3% |
44.7% |
|
63.5% |
36.5% |
| Multiple victims or offenders |
|
|
|
|
|
|
Multiple victims |
63.3% |
36.7% |
|
93.5% |
6.5% |
|
Multiple offenders |
85.6% |
14.4% |
|
91.6% |
8.4% |
The relationship between the victim and the offender differs for
female and male victims
- Female victims are more likely than male
victims to be killed by an intimate or family member.
- Male victims are more likely than female victims to be killed by acquaintances
or strangers.
Victim Offender Relationship by Victim Gender, 1976-2005
| |
|
Percent of homicide victims by gender |
| Victim/Offender relationship |
Male |
Female |
| |
Total |
100.0 |
% |
100.0 |
% |
| |
|
|
|
|
| Intimate |
5.0 |
% |
30.0 |
% |
| |
Spouse |
3.0 |
|
18.3 |
|
| |
Ex-spouse |
0.2 |
|
1.4 |
|
| |
Boyfriend/Girlfriend |
1.8 |
|
10.4 |
|
| |
|
|
|
|
| Other family |
6.8 |
% |
11.8 |
% |
| |
Parent |
1.3 |
|
2.8 |
|
| |
Child |
2.1 |
|
5.4 |
|
| |
Sibling |
1.2 |
|
0.9 |
|
| |
Other family |
2.2 |
|
2.8 |
|
| |
|
|
|
|
| Acquaintance/Known |
35.3 |
% |
21.8 |
% |
| |
Neighbor |
1.1 |
|
1.3 |
|
| |
Employee/er |
0.1 |
|
0.1 |
|
| |
Friend/Acquaintance |
29.4 |
|
17.0 |
|
| |
Other Known |
4.6 |
|
3.4 |
|
| |
|
|
|
|
|
| Stranger |
15.5 |
% |
8.7 |
% |
| |
|
|
|
|
|
| Undetermined |
37.4 |
% |
27.6 |
% |
Source: FBI, Supplementary Homicide Reports, 1976-2005.
See also Additional Information about the Data.
Note: The victims of the 9/11/01 terrorist attacks are not included in this analysis.
Related charts on this site
|
