Home > Renewables and Alternate Fuels > Solar Thermal

Solar Thermal
                                         

Data For: 2006
Release Date: October 2007
Next Release Date: October 2008

Table 2.1  Annual Solar Thermal Collector Domestic Shipments, 1997-2006
Year Solar Thermal CollectorsÂȘ
(Thousand Square Feet)
19977,759
19987,396
19998,046
20007,857
200110,349
200211,004
200310,926
200413,301
200514,680
200619,532
Total110,852
a Total shipments minus export shipments.
Notes: Totals may not equal sum of components due to independent rounding. Total shipments include those made in or shipped to U.S. Territories.
Source: Energy Information Administration, Form EIA-63A, "Annual Solar Thermal Collector Manufacturers Survey."


For the Latest Data on Solar ThermalFormats
Table 1.5a Historical Renewable Energy Consumption by Energy Use Sector and Energy Sourcepdfxls
Table 1.5b Historical Renewable Energy Consumption by Energy Use Sector and Energy Sourcepdfxls
Table 2.1 Annual Solar Thermal Collector Domestic Shipmentshtmlpdfxls
Table 2.2 Annual Shipments of Solar Thermal Collectorshtmlpdfxls
Table 2.3 Annual Shipments of Solar Thermal Collectors by Typehtmlpdfxls
Table 2.4 Domestic Shipments of Solar Collectors Ranked by Top Five Origins and Destinationshtmlpdfxls
Table 2.5 Domestic Shipments of Solar Collectors Ranked by Origin and Destinationhtmlpdfxls
Table 2.6 Shipments of Solar Thermal Collectors by Destinationhtmlpdfxls
Table 2.7 Distribution of U.S. Solar Thermal Collector Exports by Countryhtmlpdfxls
Table 2.8 Distribution of Solar Thermal Collector Shipmentshtmlpdfxls
Table 2.9 Solar Thermal Collector Shipments by Type, Quantity, Revenue, and Average Pricehtmlpdfxls
Table 2.10 Shipments of Solar Collectors by Market Sector, End Use, and Typehtmlpdf xls
Table 2.11 Shipments of Complete Solar Thermal Collector Systemshtmlpdfxls
Table 2.12 Number of Companies Expecting to Introduce New Solar Thermal Collector Productshtmlpdf xls
Table 2.13 Percent of Solar Collector Shipments by the 10 Largest Companieshtmlpdfxls
Table 2.14 Employment in the Solar Thermal Industryhtmlpdfxls
Table 2.15 Companies Involved in Solar Thermal Activities by Typehtmlpdfxls
Table 2.16 Solar-Related Sales as a Percentage of Total Saleshtmlpdf xls
Stirling Energy Systems, Inc. (SES)/Boeing, 25 kW Dish Stirling system at sunset.

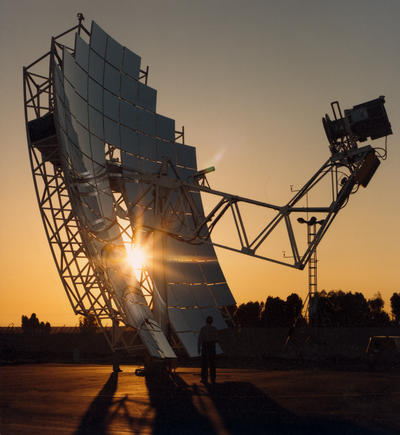
Stirling Energy Systems, Inc. (SES)/Boeing, 25 kW Dish Stirling system at sunset.

   Source: National Renewable Energy Laboratory, Photographic Information Exchange.

Solar thermal devices use direct heat from the sun, concentrating it in some manner to produce heat at useful temperatures. The modern solar industry began with the oil embargo of 1973-1974 and was strengthened with the second embargo in 1979. The growth of the solar industry during this period of fuel shortages and high prices (1974-1984) soared from 45 solar collector manufacturing firms to 225 firms.The solar market was helped during this period by government assistance, both Federal and State. Currently, solar thermal devices do everything from heating swimming pools to creating steam for electricity generation.

Renewable Information Team

Solar Power on Federal Lands
This map shows solar power resource potential on Federal lands and the lower 48 states.

Concentrated Solar Power Resource Potential Map.

Renewable Legislation and Incentives
This web page covers public laws and proposed laws impacting the renewable energy marketplace.


Contact: