

|
FOR FURTHER INFORMATION: |
FOR RELEASE: |
|
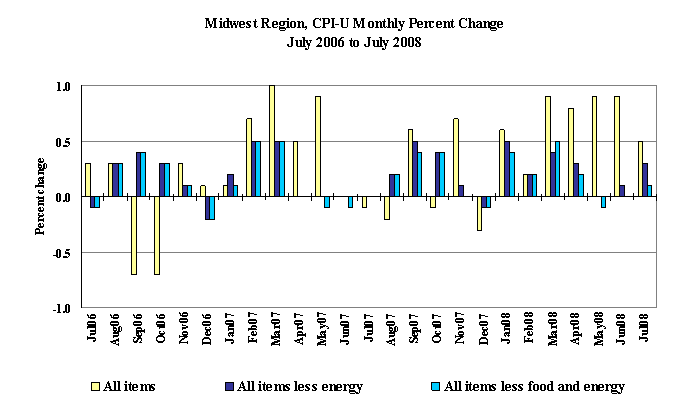
MIDWEST CONSUMER PRICE INDEX (CPI) - JULY 2008 The Consumer Price Index for the Midwest rose 0.5 percent in July, after registering a 0.9 percent increase in June. The index was up 5.6 percent from July 2007, the U.S. Department of Labor's Bureau of Labor Statistics reported today. According to Regional Commissioner Stanley W. Suchman, rising energy costs accounted for over one-half of the overall increase. Energy prices, which include prices for motor and household fuels, were up 2.4 percent in July. Energy prices have advanced 27.7 percent since July 2007, led by escalating motor fuel costs. The Midwest CPI for all items less energy was 0.3 percent higher over the month and was up 2.9 percent over the year.
Reflecting rising costs for household fuels, the housing index increased 0.7 percent. The fuels and utilities index advanced 3.9 percent as electricity prices increased 1.4 percent and utility (piped) gas service costs climbed 8.8 percent. Shelter costs were unchanged while prices for household furnishings and operations were up 0.5 percent over the month. From July 2007 to July 2008, housing costs increased 4.0 percent in the Midwest. Shelter costs rose 1.6 percent and prices for household fuels and utilities were up 18.4 percent for the year. Within fuels and utilities, electricity prices rose 6.0 percent over the year, and prices for utility (piped) gas service climbed 40.0 percent, the largest over-the-year increase since October 2005. Prices for household furnishings and operations rose 2.0 percent over the 12-month period. The food and beverages index rose 1.0 percent in July with prices for food at home up 1.2 percent and prices for food away from home 0.9 percent higher, the largest one-month increase since monthly publication began in January 1987. Prices for alcoholic beverages were up 0.3 percent over the month. From July 2007 to July 2008, prices for food and beverages rose 5.9 percent. Prices for food at home advanced 6.9 percent, and prices for food away from home rose 5.3 percent since July 2007. Alcoholic beverages' prices increased 3.0 percent over the year. The transportation component also had a major impact on the overall monthly index, increasing 0.6 percent in July, largely attributable to rising motor fuel costs. Motor fuel prices advanced 0.9 percent. Prices for new and used motor vehicles were unchanged as new vehicle prices were down 0.2 percent and prices for used cars and trucks registered little movement. Overall, transportation prices have risen 12.9 percent since July 2007, led by an over-the-year increase of 33.6 percent in motor fuel costs. Prices for new and used motor vehicles were 0.3 percent higher over the year. Apparel prices decreased 2.1 percent in July following a 3.5 percent decline in June. Apparel prices typically decline in June and July as retailers discount spring-summer merchandise. Apparel prices were 1.6 percent higher from July 2007 to July 2008. The remaining four major expenditure categories- recreation, education and communication, other goods and services, and medical care-contributed little to the increase in the overall monthly index. Prices for recreation rose 0.4 percent in July and were up 3.0 percent over the year. Prices for education and communication were up 0.3 percent for the month and were 3.3 percent higher than July 2007. Other goods and services prices increased 0.4 percent since June 2008 and advanced 4.2 percent over the year. Medical care costs registered little or no movement over the month and rose 2.3 percent over the year. The Midwest Consumer Price Index for All Urban Consumers (CPI-U) stood at 210.071 in July. A typical market basket of goods and services that cost $100.00 in the 1982-84 base period cost $210.07 in July 2008. Because regional CPI data are not adjusted for seasonal price variation, consumers and businesses should be cautious in drawing conclusions about long-term retail price trends from short-term changes in the regional indexes. Consumer Price Index data for August are scheduled for release on Tuesday September 16, 2008, at 7:30 A.M. (CT).
_________________________________________________________________________________________ |
Consumer Price Index for All Urban Consumers (CPI-U): Indexes and percent changes for selected periods
Midwest (1982-84=100 unless otherwise noted)
Indexes Percent change from-
Item and Group
May June July July May June
2008 2008 2008 2007 2008 2008
Expenditure category
All items.................................... 207.168 208.968 210.071 5.6 1.4 0.5
All items (December 1977=100) ............... 337.074 340.002 341.797 - - -
Food and beverages.......................... 205.348 206.221 208.290 5.9 1.4 1.0
Food....................................... 204.911 205.858 208.043 6.2 1.5 1.1
Food at home.............................. 201.553 202.476 204.951 6.9 1.7 1.2
Food away from home....................... 210.466 211.450 213.251 5.3 1.3 .9
Alcoholic beverages........................ 210.030 210.030 210.747 3.0 .3 .3
Housing..................................... 197.544 199.967 201.325 4.0 1.9 .7
Shelter.................................... 224.687 225.317 225.325 1.6 .3 .0
Rent of primary residence (1)............. 214.335 214.994 215.119 2.0 .4 .1
Owners' equivalent rent of primary
residence (1) (2) .................... 226.310 226.451 226.398 1.5 .0 .0
Fuels and utilities........................ 213.260 228.371 237.361 18.4 11.3 3.9
Household energy.......................... 191.483 207.300 216.521 20.5 13.1 4.4
Gas (piped) and electricity (1).......... 196.273 213.057 223.044 19.7 13.6 4.7
Electricity (1)......................... 154.921 174.037 176.399 6.0 13.9 1.4
Utility (piped) gas service (1)......... 270.396 281.714 306.581 40.0 13.4 8.8
Household furnishings and operations....... 121.573 121.370 122.035 2.0 .4 .5
Apparel..................................... 112.747 108.815 106.538 1.6 -5.5 -2.1
Transportation.............................. 208.387 213.465 214.830 12.9 3.1 .6
Private transportation..................... 203.623 208.290 209.241 12.7 2.8 .5
New and used motor vehicles (3)........... 94.379 94.380 94.381 .3 .0 .0
New vehicles............................. 130.480 130.287 130.011 -.4 -.4 -.2
New cars and trucks (3) (4)............. 92.185 91.951 91.754 -.2 -.5 -.2
New cars (4)............................ 129.948 129.933 130.562 1.7 .5 .5
Used cars and trucks..................... 137.630 137.290 137.169 .4 -.3 -.1
Motor fuel................................ 334.627 353.460 356.561 33.6 6.6 .9
Gasoline (all types)..................... 333.180 351.629 354.832 33.6 6.5 .9
Gasoline, unleaded regular (4).......... 332.759 351.473 354.478 34.2 6.5 .9
Gasoline, unleaded midgrade (4) (5)..... 363.339 382.214 387.033 33.1 6.5 1.3
Gasoline, unleaded premium (4).......... 322.074 340.032 342.794 31.4 6.4 .8
Medical care................................ 360.995 360.549 360.652 2.3 -.1 .0
Medical care commodities................... 291.027 289.459 288.927 -.7 -.7 -.2
Medical care services...................... 384.143 384.195 384.572 3.4 .1 .1
Professional services..................... 329.301 329.522 329.555 3.1 .1 .0
Recreation (3).............................. 114.429 114.233 114.669 3.0 .2 .4
Education and communication (3)............. 124.314 124.554 124.922 3.3 .5 .3
Other goods and services.................... 334.599 334.655 336.042 4.2 .4 .4
Commodity and service group
All items.................................... 207.168 208.968 210.071 5.6 1.4 .5
Commodities................................. 174.362 175.633 176.363 7.5 1.1 .4
Commodities less food and beverages........ 157.473 158.890 159.028 8.5 1.0 .1
Nondurables less food and beverages....... 205.802 208.950 209.180 13.9 1.6 .1
Nondurables less food, beverages, and
apparel.............................. 266.198 273.899 275.739 17.5 3.6 .7
Durables.................................. 109.747 109.568 109.619 .3 -.1 .0
Services.................................... 241.367 243.720 245.216 4.1 1.6 .6
Rent of shelter (2) ....................... 231.004 231.660 231.661 1.6 .3 .0
Transportation services.................... 247.855 250.895 253.715 5.6 2.4 1.1
Other services............................. 287.104 287.099 287.999 3.7 .3 .3
Special aggregate indexes
All items less medical care.................. 199.621 201.500 202.637 5.8 1.5 .6
All items less food.......................... 207.473 209.416 210.336 5.5 1.4 .4
All items less shelter....................... 203.013 205.261 206.778 7.2 1.9 .7
Commodities less food........................ 159.285 160.656 160.813 8.2 1.0 .1
Nondurables.................................. 206.539 208.623 209.727 10.0 1.5 .5
Nondurables less food........................ 205.750 208.686 208.948 13.1 1.6 .1
Nondurables less food and apparel............ 259.554 266.432 268.150 16.2 3.3 .6
Services less rent of shelter (2) ........... 266.409 270.866 274.186 6.7 2.9 1.2
Services less medical care services.......... 230.094 232.557 234.102 4.2 1.7 .7
Energy....................................... 254.281 271.353 277.788 27.7 9.2 2.4
All items less energy........................ 204.291 204.446 204.980 2.9 .3 .3
All items less food and energy.............. 204.804 204.806 205.022 2.3 .1 .1
Commodities less food and energy
commodities............................ 139.027 138.049 137.820 1.3 -.9 -.2
Energy commodities......................... 333.826 352.290 355.244 33.8 6.4 .8
Services less energy services.............. 247.708 248.437 248.977 2.8 .5 .2
1 This index series was calculated using a Laspeyres estimator. All other item stratum index series
were calculated using a geometric means estimator.
2 Index is on a December 1982=100 base.
3 Indexes on a December 1997=100 base.
4 Special index based on a substantially smaller sample.
5 Indexes on a December 1993=100 base.
- Data not available.
Regions defined as the four Census regions. Midwest includes Illinois, Indiana, Iowa, Kansas, Michigan,
Minnesota, Missouri, Nebraska, North Dakota, Ohio, South Dakota, and Wisconsin.
NOTE: Index applies to a month as a whole, not to any specific date.
Consumer Price Index for Urban Wage Earners and Clerical Workers (CPI-W): Indexes and percent changes
for selected periods
Midwest (1982-84=100 unless otherwise noted)
Indexes Percent change from-
Item and Group
May June July July May June
2008 2008 2008 2007 2008 2008
Expenditure category
All items.................................... 202.912 204.867 206.038 6.1 1.5 0.6
All items (December 1977=100) ............... 328.153 331.316 333.210 - - -
Food and beverages.......................... 205.229 206.185 208.404 6.0 1.5 1.1
Food....................................... 204.880 205.893 208.238 6.2 1.6 1.1
Food at home.............................. 201.563 202.556 205.221 6.7 1.8 1.3
Food away from home....................... 210.641 211.687 213.571 5.4 1.4 .9
Alcoholic beverages........................ 209.341 209.546 210.111 3.1 .4 .3
Housing..................................... 191.701 194.303 195.867 4.5 2.2 .8
Shelter.................................... 213.487 214.002 213.993 1.7 .2 .0
Rent of primary residence (1)............. 214.833 215.395 215.542 2.0 .3 .1
Owners' equivalent rent of primary
residence (1) (2).................... 210.694 210.807 210.780 1.5 .0 .0
Fuels and utilities........................ 213.477 228.655 237.883 18.6 11.4 4.0
Household energy.......................... 190.966 206.640 215.992 20.6 13.1 4.5
Gas (piped) and electricity (1).......... 194.926 211.484 221.495 19.7 13.6 4.7
Electricity (1)......................... 155.005 173.946 176.369 6.2 13.8 1.4
Utility (piped) gas service (1)......... 270.461 281.575 306.842 39.9 13.5 9.0
Household furnishings and operations....... 118.569 118.251 119.184 1.7 .5 .8
Apparel..................................... 110.919 107.050 104.741 1.7 -5.6 -2.2
Transportation.............................. 210.166 215.373 216.569 13.4 3.0 .6
Private transportation..................... 207.163 212.147 213.126 13.3 2.9 .5
New and used motor vehicles (3)........... 94.069 94.038 93.974 .5 -.1 -.1
New vehicles............................. 133.730 133.567 133.237 .0 -.4 -.2
Used cars and trucks..................... 138.814 138.480 138.375 .4 -.3 -.1
Motor fuel................................ 335.340 354.263 357.525 33.6 6.6 .9
Gasoline (all types)..................... 333.812 352.357 355.729 33.5 6.6 1.0
Gasoline, unleaded regular (4).......... 333.150 351.982 355.161 34.1 6.6 .9
Gasoline, unleaded midgrade (4) (5)..... 363.062 381.863 386.816 33.0 6.5 1.3
Gasoline, unleaded premium (4).......... 321.798 339.777 342.608 31.3 6.5 .8
Medical care................................ 363.037 362.422 362.541 2.4 -.1 .0
Medical care commodities................... 285.000 283.264 282.792 -.7 -.8 -.2
Medical care services...................... 387.182 387.094 387.478 3.5 .1 .1
Professional services..................... 330.186 330.403 330.501 3.1 .1 .0
Recreation (3).............................. 110.846 110.575 111.024 2.6 .2 .4
Education and communication (3)............. 120.982 121.200 121.480 3.0 .4 .2
Other goods and services.................... 348.814 349.058 350.506 5.1 .5 .4
Commodity and service group
All items.................................... 202.912 204.867 206.038 6.1 1.5 .6
Commodities................................. 176.863 178.396 179.243 8.3 1.3 .5
Commodities less food and beverages........ 161.631 163.390 163.625 9.6 1.2 .1
Nondurables less food and beverages....... 216.152 220.015 220.432 15.4 2.0 .2
Nondurables less food, beverages, and
apparel.............................. 280.899 289.682 291.845 19.2 3.9 .7
Durables.................................. 109.434 109.225 109.290 .1 -.1 .1
Services.................................... 234.894 237.358 238.916 4.3 1.7 .7
Rent of shelter (2)....................... 212.195 212.713 212.699 1.7 .2 .0
Transportation services.................... 243.546 245.747 247.809 4.6 1.8 .8
Other services............................. 270.787 270.760 271.509 3.5 .3 .3
Special aggregate indexes
All items less medical care.................. 196.458 198.481 199.677 6.3 1.6 .6
All items less food.......................... 202.300 204.423 205.381 6.1 1.5 .5
All items less shelter....................... 201.574 204.060 205.660 7.8 2.0 .8
Commodities less food........................ 163.257 164.972 165.217 9.3 1.2 .1
Nondurables.................................. 211.925 214.422 215.698 10.9 1.8 .6
Nondurables less food........................ 215.589 219.231 219.656 14.6 1.9 .2
Nondurables less food and apparel............ 273.050 280.993 282.998 17.9 3.6 .7
Services less rent of shelter (2)........... 237.889 242.324 245.518 6.9 3.2 1.3
Services less medical care services.......... 224.073 226.624 228.216 4.3 1.8 .7
Energy....................................... 256.610 273.661 280.093 28.0 9.2 2.4
All items less energy........................ 197.612 197.680 198.197 3.0 .3 .3
All items less food and energy.............. 196.385 196.255 196.390 2.3 .0 .1
Commodities less food and energy
commodities............................ 139.143 138.136 137.906 1.4 -.9 -.2
Energy commodities......................... 334.966 353.561 356.751 33.8 6.5 .9
Services less energy services.............. 240.150 240.728 241.154 2.7 .4 .2
1 This index series was calculated using a Laspeyres estimator. All other item stratum index series
were calculated using a geometric means estimator.
2 Index is on a December 1984=100 base.
3 Indexes on a December 1997=100 base.
4 Special index based on a substantially smaller sample.
5 Indexes on a December 1993=100 base.
- Data not available.
Regions defined as the four Census regions. Midwest includes Illinois, Indiana, Iowa, Kansas, Michigan,
Minnesota, Missouri, Nebraska, North Dakota, Ohio, South Dakota, and Wisconsin.
NOTE: Index applies to a month as a whole, not to any specific date.
Consumer Price Index for All Urban Consumers (CPI-U): Selected areas, all items index
(1982-84=100, unless otherwise noted)
All items
Indexes Percent change to Percent change to
Area Pricing July2008 from- June2008 from-
schedule
(1)
Apr. May June July July May June June Apr. May
2008 2008 2008 2008 2007 2008 2008 2007 2008 2008
U.S. city average....................... M 214.823 216.632 218.815 219.964 5.6 1.5 0.5 5.0 1.9 1.0
Region and area size(2)
Northeast urban......................... M 228.133 230.089 232.649 234.545 5.7 1.9 .8 5.0 2.0 1.1
Size A - More than 1,500,000.......... M 230.038 232.005 234.518 236.460 5.5 1.9 .8 4.7 1.9 1.1
Size B/C - 50,000 to 1,500,000 (3).... M 135.739 136.913 138.542 139.623 6.3 2.0 .8 5.8 2.1 1.2
Midwest urban........................... M 205.393 207.168 208.968 210.071 5.6 1.4 .5 4.9 1.7 .9
Size A - More than 1,500,000.......... M 206.590 208.291 209.813 211.003 5.3 1.3 .6 4.6 1.6 .7
Size B/C - 50,000 to 1,500,000 (3).... M 131.484 132.682 134.018 134.595 5.9 1.4 .4 5.2 1.9 1.0
Size D - Nonmetropolitan (less than
50,000)........................... M 200.841 202.720 205.122 206.435 6.0 1.8 .6 5.5 2.1 1.2
South urban............................. M 208.085 210.006 212.324 213.304 5.8 1.6 .5 5.3 2.0 1.1
Size A - More than 1,500,000.......... M 209.987 211.846 214.359 215.373 5.6 1.7 .5 5.0 2.1 1.2
Size B/C - 50,000 to 1,500,000 (3).... M 132.516 133.714 134.980 135.643 5.8 1.4 .5 5.2 1.9 .9
Size D - Nonmetropolitan (less than
50,000)........................... M 208.746 211.225 214.739 215.274 6.8 1.9 .2 6.6 2.9 1.7
West urban.............................. M 219.437 221.009 223.040 223.867 5.3 1.3 .4 4.9 1.6 .9
Size A - More than 1,500,000.......... M 222.689 224.704 226.767 227.562 5.4 1.3 .4 5.0 1.8 .9
Size B/C - 50,000 to 1,500,000 (3).... M 133.694 134.023 135.283 136.021 5.4 1.5 .5 4.7 1.2 .9
Size classes
A (4)................................. M 196.191 197.898 199.840 200.941 5.4 1.5 .6 4.8 1.9 1.0
B/C (3)............................... M 132.974 133.997 135.330 136.055 5.8 1.5 .5 5.2 1.8 1.0
D..................................... M 207.238 209.308 211.989 212.555 5.8 1.6 .3 5.6 2.3 1.3
Selected local areas(5)
Chicago-Gary-Kenosha, IL-IN-WI.......... M 212.662 214.932 215.738 217.459 5.8 1.2 .8 4.7 1.4 .4
Los Angeles-Riverside-Orange County, CA M 224.625 226.651 229.033 229.886 5.7 1.4 .4 5.4 2.0 1.1
New York-Northern N.J.-Long Island,
NY-NJ-CT-PA......................... M 233.822 236.151 238.580 240.273 5.1 1.7 .7 4.5 2.0 1.0
Boston-Brockton-Nashua, MA-NH-ME-CT..... 1 - 235.344 - 241.258 6.3 2.5 - - - -
Cleveland-Akron, OH..................... 1 - 204.882 - 206.941 5.0 1.0 - - - -
Dallas-Fort Worth, TX................... 1 - 202.357 - 206.413 6.2 2.0 - - - -
Washington-Baltimore, DC-MD-VA-WV (6)... 1 - 139.649 - 142.065 5.7 1.7 - - - -
Atlanta, GA............................. 2 206.371 - 212.032 - - - - 4.9 2.7 -
Detroit-Ann Arbor-Flint, MI............. 2 205.281 - 207.593 - - - - 3.0 1.1 -
Houston-Galveston-Brazoria, TX.......... 2 188.795 - 193.567 - - - - 4.9 2.5 -
Miami-Fort Lauderdale, FL............... 2 221.324 - 225.079 - - - - 5.8 1.7 -
Philadelphia-Wilmington-Atlantic City,
PA-NJ-DE-MD......................... 2 223.622 - 228.408 - - - - 5.1 2.1 -
San Francisco-Oakland-San Jose, CA...... 2 222.074 - 225.181 - - - - 4.2 1.4 -
Seattle-Tacoma-Bremerton, WA............ 2 223.196 - 228.068 - - - - 5.8 2.2 -
1 Foods, fuels, and several other items priced every month in all areas;
most other goods and services priced as indicated:
M - Every month.
1 - January, March, May, July, September, and November.
2 - February, April, June, August, October, and December.
2 Regions defined as the four Census regions.
3 Indexes on a December 1996=100 base.
4 Indexes on a December 1986=100 base.
5 In addition, the following metropolitan areas are published semiannually and appear in Tables 34 and 39 of the January and July
issues of the CPI Detailed Report: Anchorage, AK; Cincinnati-Hamilton, OH-KY-IN; Denver-Boulder-Greeley, CO; Honolulu, HI; Kansas
City, MO-KS; Milwaukee-Racine, WI; Minneapolis-St. Paul, MN-WI; Phoenix-Mesa, AZ; Pittsburgh, PA; Portland-Salem, OR-WA; St. Louis,
MO-IL; San Diego, CA; Tampa-St. Petersburg-Clearwater, FL.
6 Indexes on a November 1996=100 base.
- Data not available.
NOTE: Index applies to a month as a whole, not to any specific date.
NOTE: Local area indexes are byproducts of the national CPI program. Each local index has a smaller sample size than the national
index and is, therefore, subject to substantially more sampling and other measurement error. As a result, local area indexes show
greater volatility than the national index, although their long-term trends are similar. Therefore, the Bureau of Labor Statistics
strongly urges users to consider adopting the national average CPI for use in their escalator clauses.
Consumer Price Index for All Urban Consumers (CPI-U): Regions, by expenditure category and commodity and service group
(1982-84=100, unless otherwise noted)
Northeast Midwest South West
Percent Percent Percent Percent
Item and group Index change from-- Index change from-- Index change from-- Index change from--
July June July June July June July June
July 2007 2008 July 2007 2008 July 2007 2008 July 2007 2008
2008 2008 2008 2008
Expenditure category
All items.......................... 234.545 5.7 0.8 210.071 5.6 0.5 213.304 5.8 0.5 223.867 5.3 0.4
All items (December 1977=100) ..... 369.336 - - 341.797 - - 346.008 - - 361.869 - -
Food and beverages................ 219.381 5.4 1.0 208.290 5.9 1.0 212.759 6.0 .9 221.139 5.8 .7
Food............................. 219.022 5.5 1.0 208.043 6.2 1.1 213.576 6.3 1.0 220.636 5.9 .8
Food at home.................... 219.811 6.5 1.3 204.951 6.9 1.2 212.345 7.6 1.3 226.684 7.3 1.0
Food away from home............. 221.073 4.1 .6 213.251 5.3 .9 218.512 4.8 .6 211.971 4.1 .6
Alcoholic beverages.............. 222.971 4.6 .8 210.747 3.0 .3 200.296 1.7 .2 225.897 3.9 -.3
Housing........................... 248.478 4.5 1.3 201.325 4.0 .7 203.270 4.2 .7 228.864 3.2 .5
Shelter.......................... 289.487 2.1 1.0 225.325 1.6 .0 221.491 2.9 .2 255.242 3.0 .3
Rent of primary residence (1)... 275.313 4.2 .6 215.119 2.0 .1 219.124 3.8 .2 255.331 4.0 .3
Owners' equivalent rent of
primary residence (1) (2)... 293.833 2.2 .1 226.398 1.5 .0 222.752 3.0 .2 267.153 3.3 .2
Fuels and utilities.............. 255.437 22.5 3.7 237.361 18.4 3.9 235.673 14.4 3.1 242.120 8.8 2.5
Household energy................ 244.871 24.7 4.0 216.521 20.5 4.4 210.725 16.5 3.6 232.065 10.0 2.8
Gas (piped) and electricity (1) 231.272 14.2 4.8 223.044 19.7 4.7 210.193 15.2 3.6 232.998 9.0 2.8
Electricity (1)............... 203.777 7.7 2.9 176.399 6.0 1.4 193.414 11.0 3.2 226.634 3.9 1.1
Utility (piped) gas service
(1)....................... 284.371 27.1 8.3 306.581 40.0 8.8 303.148 36.5 5.4 271.903 23.0 6.8
Household furnishings and
operations................... 128.437 -.2 -.5 122.035 2.0 .5 127.439 1.1 .3 133.764 .1 .3
Apparel........................... 111.732 .2 -2.1 106.538 1.6 -2.1 127.030 .5 -2.2 108.467 1.2 -2.7
Transportation.................... 209.419 12.9 .5 214.830 12.9 .6 212.146 13.9 .5 214.211 13.5 .4
Private transportation........... 203.358 13.1 .5 209.241 12.7 .5 210.408 13.8 .4 207.719 13.4 .2
New and used motor vehicles (3) 93.137 .8 .4 94.381 .3 .0 93.806 -1.1 .0 93.306 -.6 .0
New vehicles................... 134.549 .1 .0 130.011 -.4 -.2 137.933 -1.3 -.1 133.658 -1.0 -.1
New cars and trucks (3) (4)... 93.256 .0 -.1 91.754 -.2 -.2 93.829 -1.3 -.1 92.930 -1.0 -.1
New cars (4).................. 133.794 .3 .3 130.562 1.7 .5 141.437 -.4 .5 136.059 1.3 .4
Used cars and trucks........... 140.913 .0 .0 137.169 .4 -.1 134.496 -.7 -.2 133.558 .0 -.1
Motor fuel...................... 339.083 38.3 .7 356.561 33.6 .9 347.742 38.2 .8 353.317 42.7 .3
Gasoline (all types)........... 336.470 38.0 .8 354.832 33.6 .9 344.801 37.6 .8 351.110 42.3 .3
Gasoline, unleaded regular (4) 340.279 38.5 .7 354.478 34.2 .9 345.962 38.1 .7 351.523 43.1 .4
Gasoline, unleaded midgrade
(4) (5)................... 339.074 37.4 .8 387.033 33.1 1.3 355.633 37.1 .9 326.734 40.6 .1
Gasoline, unleaded premium (4) 319.942 35.8 1.0 342.794 31.4 .8 333.891 36.2 1.0 330.394 39.9 .2
Medical care...................... 388.202 3.4 .4 360.652 2.3 .0 347.394 4.0 .0 369.054 4.0 .0
Medical care commodities......... 319.574 3.5 .3 288.927 -.7 -.2 283.031 1.6 -.1 297.892 2.0 -.6
Medical care services............ 406.302 3.3 .5 384.572 3.4 .1 368.519 4.9 .1 390.598 4.6 .1
Professional services........... 318.681 3.0 .3 329.555 3.1 .0 308.635 4.3 .3 292.694 3.6 .2
Recreation (3).................... 115.904 2.5 -.1 114.669 3.0 .4 113.553 1.3 .4 109.522 .5 .3
Education and communication (3)... 126.702 5.1 .6 124.922 3.3 .3 119.657 3.2 .7 123.309 3.5 .4
Other goods and services.......... 373.338 5.2 1.5 336.042 4.2 .4 333.144 3.5 -.5 347.269 3.4 .1
Commodity and service group
All items.......................... 234.545 5.7 .8 210.071 5.6 .5 213.304 5.8 .5 223.867 5.3 .4
Commodities....................... 185.942 8.6 .4 176.363 7.5 .4 182.624 7.9 .3 179.590 7.4 .1
Commodities less food and
beverages.................... 164.297 10.7 .0 159.028 8.5 .1 165.872 8.9 .0 155.765 8.3 -.2
Nondurables less food and
beverages................... 213.027 17.9 .1 209.180 13.9 .1 222.779 15.8 .0 205.744 16.5 -.5
Nondurables less food,
beverages, and apparel..... 290.819 23.9 .8 275.739 17.5 .7 280.967 20.5 .6 273.438 21.3 .1
Durables........................ 109.797 -.7 -.2 109.619 .3 .0 113.398 -1.1 .0 111.723 -1.3 .2
Services.......................... 282.128 3.8 1.1 245.216 4.1 .6 244.755 4.3 .6 263.600 3.9 .5
Rent of shelter (2).............. 302.827 2.1 1.0 231.661 1.6 .0 227.808 2.8 .2 271.585 3.0 .4
Transportation services.......... 234.822 5.5 .7 253.715 5.6 1.1 252.895 5.4 .6 252.805 6.0 1.0
Other services................... 316.392 4.7 .4 287.999 3.7 .3 285.129 3.2 .3 293.133 3.8 .4
Special aggregate indexes
All items less medical care........ 227.481 5.8 .8 202.637 5.8 .6 205.219 5.9 .5 216.737 5.4 .4
All items less food................ 237.559 5.7 .8 210.336 5.5 .4 213.117 5.7 .4 224.516 5.2 .3
All items less shelter............. 216.295 7.6 .7 206.778 7.2 .7 211.446 7.2 .6 212.525 6.6 .4
Commodities less food.............. 166.727 10.4 .0 160.813 8.2 .1 167.180 8.6 .0 158.771 8.1 -.2
Nondurables........................ 217.499 11.5 .5 209.727 10.0 .5 218.713 11.1 .4 215.535 11.1 .1
Nondurables less food.............. 213.482 17.0 .2 208.948 13.1 .1 221.370 15.0 .0 207.868 15.6 -.4
Nondurables less food and apparel.. 281.857 22.2 .8 268.150 16.2 .6 272.853 19.1 .6 268.173 19.7 .1
Services less rent of shelter (2).. 283.973 6.1 1.2 274.186 6.7 1.2 273.479 6.1 .9 282.877 5.1 .8
Services less medical care services 272.946 3.9 1.1 234.102 4.2 .7 232.461 4.3 .6 254.106 3.9 .6
Energy............................. 284.330 31.1 2.3 277.788 27.7 2.4 268.373 28.5 1.9 305.028 30.3 1.1
All items less energy.............. 231.345 3.0 .6 204.980 2.9 .3 207.501 3.1 .3 219.193 3.1 .3
All items less food and energy.... 235.040 2.6 .6 205.022 2.3 .1 206.800 2.5 .1 219.605 2.6 .2
Commodities less food and energy
commodities.................. 141.711 1.0 -.3 137.820 1.3 -.2 142.082 .2 -.3 136.167 .1 -.4
Energy commodities............... 356.217 44.1 .9 355.244 33.8 .8 352.101 38.7 .8 356.642 42.7 .3
Services less energy services.... 287.234 3.1 .8 248.977 2.8 .2 247.971 3.4 .3 266.230 3.7 .4
1 This index series was calculated using a Laspeyres estimator. All other item stratum index series were calculated using a
geometric means estimator.
2 Indexes on a December 1982=100 base.
3 Indexes on a December 1997=100 base.
4 Special index based on a substantially smaller sample.
5 Indexes on a December 1993=100 base.
- Data not available.
NOTE: Index applies to a month as a whole, not to any specific date.
Last Modified Date: August 14, 2008