Skip Navigation Links weather.gov 
NOAA logo - Click to go to the NOAA homepage
NOAA's National Weather Service
Aviation Weather Center
  NWS logo - Click to go to the NWS homepage


NOAA is celebrating 200 years of science, service, and stewardship.  Visit the NOAA 200th celebration Web site to learn more.
USA.gov is the U.S. Government's official Web portal to all Federal, state and local government Web resources and services.
AWC Home > Lo SIGWX > FYI/Help
Low Level SIGWX Charts Help        

The low-level graphics product is a forecast of aviation weather hazards, primarily intended to be used as a guidance product for briefing the VFR pilot. The forecast domain covers the 48 contiguous states, southern Canada and the coastal waters for altitudes below 24,000 ft. Low altitude Significant Weather charts are issued four times daily and are valid at fixed times: 0000, 0600, 1200, and 1800 UTC. Each 4 panel chart is divided on the left and right into 12 and 24 hour forecast intervals (based on the current ETA model available). The upper two panels (SIG WX PROGs) depict freezing levels, turbulence, and low cloud ceilings and/or restrictions to visibility (shown as contoured areas of MVFR and IFR conditions). The lower two panels (SFC PROGs) are provided by the Hydrometeorological Prediction Center (HPC) and consist of graphical displays of fronts and precipitation areas.
low level legend 1
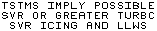
This legend appears on the 4 panel chart and applies to the upper (SIG WX PROG) charts. It has been removed from the individual color charts.
low level legend 2
This legend appears on the 4 panel chart and applies to the lower (SFC PROG) charts. It has been removed from the individual color charts.

Table of Weather Symbols

      Weather Symbols from the Aviation Digital Data Service (ADDS)

Translation of Surface Front Codes

      Surface Front Symbols and Codes from the Hydrometeorological Prediction Center (HPC)

Translation of Precipitation Symbols

      Precipitation Areas and Symbols from the Hydrometeorological Prediction Center (HPC)


Image Types: "9999" - 50K COLOR screen image     " Represents BW images " - 100K B&W print image
How to view/print high quality images

Turbulence     Icing     Convection     Winds/Temps     Progs     Java Tools
METARs     TAFs     PIREPs     SIGMET/AIRMET     Satellite     Radar
2
Page loaded:   03:09 UTC
08:09 PM Pacific  |   09:09 PM Mountain  |   10:09 PM Central  |   11:09 PM Eastern

NOAA's National Weather Service
National Centers for Environmental Prediction
Aviation Weather Center
7220 NW 101st Terr., Room 118
Kansas City, MO 64153-2371
Contact AWC Internet Services
Page last modified: March 30, 2007
Disclaimer

Credits

Glossary
Privacy Policy

About Us

Career Opportunities