|
||
|
|
||
 |
|||
A new
version of Searching for Atlantic Rhythms was posted
on July 11, 2003. It includes new information about the causes
of the North Atlantic Oscillation. |
|||
Over the past fifteen years, our society has come to view the El
Niño/La Niña phenomenona less as a climate anomaly and more as an
invisible spirit that is responsible for nearly every weather-related
adversity out there. We blame it for our dead car batteries in January, for the high
price of oranges in the summer, and for those cold snaps that hit us in early
October. In their zeal to tap into and sell this belief, the public media have
fed us a long stream of stories on El Niño-related events. However,
they’ve ignored those other climate anomalies outside of the Pacific Basin
that drive the weather. Probably the biggest and most powerful of these climate
phenomena is the aptly named North Atlantic Oscillation (NAO). While the North
Atlantic Oscillation doesn't generate the catastrophic floods, climate changes,
and carnage associated with El Niño, its effects are much
more consistent and nearly as widespread. |
| ||
The NAO is the relationship between a high-pressure system over the Azores
Islands and a low-pressure system over Iceland. Both of these systems are
present on average year round. For most of the spring, summer, and fall these
systems remain weak and ineffectual. However, throughout the course of the
winter, the NAO comes alive as both the high and the low intensify and fluctuate
in pressure relative to one another, creating dramatic variations
over the Atlantic Ocean and the surrounding continents. When the pressure
difference between the two systems is large, they bring higher temperatures
to northern Europe, cause droughts in the Middle
East, and push up the mercury in the northeastern United States. When the
pressure difference between the two systems is small, they push wet weather
toward those countries surrounding the Mediterranean, send Scandinavia into a
deep freeze, and decrease the temperature along the East Coast. |
A strong North Atlantic Oscillation (large difference in pressure between the mid-latitude and tropical North Atlantic) tends to produce more severe weather in the North Atlantic, increased snowfall in Sweden (left), and an early spring in Washington, DC (right) [Photographs copyright Mark Schoeberl (left) & Barbara Summey (right)] | ||
Despite the lack of publicity the NAO receives, teams of scientists at NASA and other institutions around the world have been studying it for many decades. They found that, much like El Niño, the NAO varies in a rhythmic pattern from decade to decade. Ever since the 1960s, the difference in pressure between the Azores high and the Icelandic low has repeatedly grown on average for three to five years and then has waned and decreased on average for another three to five years. Though the researchers have not had much luck in predicting the anomaly's behavior, many believe that its multi-year variations may be linked to currents in the sea or the formation of sea ice. Their hope is that by studying the NAO and building models mimicking its behavior, they may someday understand what drives these variations. From there they may even be able to predict its behavior.
The data used in this study are available in one or more of NASA's Earth Science Data Centers. |
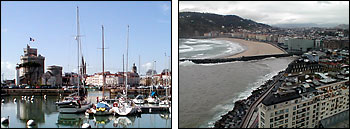
Typical weather caused by a negative NAO (small pressure difference between the mid-latitude and tropical North Atlantic) is fewer storms overall, clear skies over the Normandy coast of France (left,) and rain in Spain (right). (Photographs copyright Eric Simmon) | ||
| The Highs and Lows of the NAO | |||
For those who still don't know what those "Hs" and "Ls"
stand for on the nightly weather report, air pressure is a measure of how much
air is pushing down on the surface of the Earth at a given point. Generally,
high- and low-pressure systems form when air mass and temperature differences
between the surface of the Earth and the upper atmosphere create vertical
currents. In a low-pressure system, these vertical winds travel upwards and suck
air away from the surface of the Earth like a giant vacuum cleaner, decreasing
the air pressure above the ground or sea. This decrease in surface air pressure
in turn causes atmospheric currents moving parallel to the surface of
the Earth near the base of the low to spin counter clockwise (clockwise in the
Southern Hemisphere). Conversely, in a high-pressure
system, air is being pushed down on the ground like a vacuum put in reverse. The
downward vertical winds cause an increase in air pressure on the ground and force atmospheric currents to spin clockwise (counter clockwise in the
Southern Hemisphere). Both lows and highs function
like giant slow-moving hurricanes and anti-cyclones, respectively. The higher in
pressure a high-pressure system gets or the lower in pressure a low-pressure
system gets, the more robust and larger this spinning circulation pattern
becomes. |
|||
 |
A low pressure system will pull in air from the surrounding area. Winds around a low spiral counter-clockwise (in the Northern Hemisphere, clockwise in the Southern Hemisphere) and upwards towards the center of the system. View animation [945kb] (Image by Robert Simmon) | ||
 |
Air is pushed away from a high pressure system. The winds rotate clockwise (in the Northern Hemisphere, counter-clockwise in the Southern Hemisphere) and away from the system's center. View animation [910kb] (Image by Robert Simmon) | ||
"The NAO is an oscillation in atmospheric mass between a low around
Greenland and Iceland and a high over the Azores west of Portugal," says Vikram
Mehta. He is an atmospheric scientist at Goddard Space Flight Center who has
been studying Atlantic climate anomalies for the past ten years. |
|||
He explains that a permanent low-pressure system exists over Greenland and Iceland, and a permanent high-pressure system exists over a group of islands roughly 900 miles west of Portugal, known as the Azores. For most of the year, the high and the low are mild, and their influence on the Atlantic Basin climate is minimal. However, when winter hits, all of this begins to change. Both pressure systems grow much more intense and begin to fluctuate from week to week between two different states. In one state, which scientists call a positive NAO, the high-pressure system grows especially high, while the low-pressure system grows especially low, creating a large pressure difference between the Azores and Iceland. In the other state, known as a negative NAO, the high-pressure system weakens and the low becomes shallow, creating a mild pressure difference between the two regions of the Atlantic. As the low and high intensify and relax, the winds revolving around their centers increase and decrease in both strength and in extent. During a positive NAO, the two pressure systems can just about cause all the currents in the northern half of the Northern Atlantic to spin counterclockwise and all those currents in the southern half to spin clockwise. Though the impact of the NAO and its phases can be felt across the entire Atlantic and the surrounding continents, its greatest effect is on the storms passing into Europe. Between the two swirling, hurricane like circulation patterns created by the high and low, there is an area where they come together and form a steady, forward-moving current that channels weather systems from the United States to Europe. "As the pressure systems vary, they modulate the winds along this track and change the number of storms and the amount of moisture over Europe coming from the Atlantic and the Gulf Stream," says Mehta. Like two wheels of a printing press, the high and low systems can increase or decrease the strength of the winds along this channel. When the pressure difference between the two systems is large (a positive NAO), the winds along this conduit pick up, and they push the storms north towards Scandinavia and northern France. When the pressure difference is small (a negative NAO), the storms take a more direct course from the southern U.S. to southern Europe, the Middle East, and northern Africa. Jim Hurrell is an atmospheric scientist at the National
Center of for Atmospheric Research who spent a number of years analyzing the
connection between the North Atlantic Oscillation and winter weather in Europe.
He says, "The direction these storms take as a result of NAO can cause remarkable
changes in the temperature and the weather over Europe from December through
March." A positive NAO on average can increase rainfall in northern Europe by 3.6
mm per day and warm the air there by roughly 3°C. If the condition persists
for most of the winter, it can lengthen the growing season by 20 days in Sweden,
cause water shortages in the Fertile Crescent, and provide sunnier beaches for
tourists on the French Riviera. A negative NAO, on the other hand, will bring
the same amount of rain to southern Europe, drop the temperatures in northern
Europe and maintain the already warm climate across the Mediterranean. If the
negative state persists, it will increase the production of olives and grapes in
Greece, put Denmark in a deep freeze, and create ideal skiing conditions in
Austria (National Oceanic and Atmospheric Administration, 1999). |
 The positive and negative phases of the North Atlantic Oscillation are defined by the differences in pressure between the persistent low over Greenland and Iceland and the persistent high off the coast of Portugal. During a positive NAO, both systems are stronger than usual. That is, the low has a lower atmospheric pressure and the high has a higher atmospheric pressure. During the negative phase of the NAO, both systems are weaker, lowering the difference in pressure between them. (Images by Robert Simmon) | ||
Hurrell said the NAO’s effects could also be felt to a lesser degree in the United States and Canada. When the NAO is positive, the high-pressure system residing near the Azores stengthens. The winds rotating around the system expand and push warm air up from the Caribbean. "This creates warmer conditions and generally less snowfall in the Eastern U.S. ," said Hurrell. And though they don't understand it completely, scientists have also noticed a correlation between a positive NAO and increased rainfall in the Midwest and even in the Southwest. |
The maps at left show the relationship between a strong positive NAO and precipitation and temperature. Positive correlation means that an area is wetter or warmer than normal, negative correlation means an area is drier or colder than normal, and no correlation means the area is unaffected by the NAO. (Images courtesy Lamont-Doherty Earth Observatory) |
| Relying on the Ocean’s Long Term Memory | |||
The ultimate goal for atmospheric scientists studying the NAO is to be able to
predict how positive on average or how negative on average the NAO will become on
a yearly basis. If they knew that, then they could warn European farmers of when
they should plant their crops, alert Mediterranean resorts as to the amount of
rain they are likely to receive, and generally predict winter weather trends more
accurately. |
|||
Hurrell explains that the variability of the NAO occurs on several different time scales. From week to week, the NAO flip-flops between positive and negative phases seemingly at random, sending good and bad weather intermittently to both southern and northern Europe. Yet, each winter the NAO almost always shows an overwhelmingly negative or positive average for the year. When these yearly averages are put into an index and plotted next to one another, a clear pattern emerges. Since the 1960s, the differences in pressure between the Azores High and the Icelandic Low have followed a serpentine pattern, increasing for three to five years before decreasing for the same amount of time (World Climate Research Program, 1997). Despite its regular appearance, this long-term pattern is still too erratic to predict by simply looking at a chart of its history. "There are simply too many variables that go into these trends to make them easily predictable," says Hurrell. The only way scientists could forecast the dips and peaks in this trend would be if they understood exactly what was causing the two pressure systems to oscillate over long stretches of time, Mehta says. Currently, scientists only have a vague idea of what’s driving this rhythm in the NAO. Most researchers agree that the high and low would develop on their own over the Atlantic and that they would fluctuate in strength from week to week or even month to month. However, decadal patterns require some type of climatic "memory." For the NAO index to continue an upward climb over seven consecutive winters, there would have to be some mechanism in the atmosphere or the ocean that "reminds" the Azores High and the Icelandic Low of what part of the long-term cycle they were in the year before. "The hypothesis is that if you have long-lived climate anomalies that continue
for more than a season or several years, then the land, ocean, or sea ice must be
involved," says Mehta. Left to themselves, atmospheric currents change in
temperature and density so rapidly over time that there is no way they could
maintain a pattern into the spring and summer months after the low- and
high-pressure systems break up. Ocean currents and ice formations, however,
retain heat and can circulate for years without dissipating. Though the problem
is still a ways from being solved, researchers believe that the ocean currents or
ice sheets in the North Atlantic are somehow coupled with the atmosphere,
influencing the positive and negative sign NAO will take each winter. Only by
understanding the mechanisms that are driving the long-term decadal trend will
scientists be able to forecast its behavior on a yearly basis. Mehta points out
that knowledge of such systems is precisely what allowed scientists to predict
the last El Niño nearly thirteen months in advance. |
 Although the relative pressure difference between Iceland and the Azores varies from month to month (top), the winter average of the months December, January, February, and March (above) cycles over a period of several years. For three to five years the NAO grows stonger, then for the next three to five years weakens. (Graphs by Robert Simmon, based on data from Hurrell) |
| Mimicking Mother Nature | |||
To better understand what causes these long-term trends, scientists use oceanic and atmospheric computer models. These models are complex mathematical simulations of the natural systems that drive the Earth's climate. Different models focus on different aspects of climate change. Some simulate the effects of carbon dioxide on the atmosphere, others attempt to emulate airflow over land, and still others mimic the interaction between the sea and the air. While such models can be used in a number of applications, they are especially handy for testing hypotheses and obtaining a better understanding of climate phenomena. They allow scientists to test their climate theories and predictions relatively easily in a controlled fashion without all the unexpected variables mother nature can throw them. As an example, suppose a model was built that simulated the effects of water pollution on global climate and rainfall. Not long afterwards, a group of researchers comes up with the hypothesis that sewage run-off in New York City affects rainfall in China, which in turn causes fluctuations in tea prices. The team could test their theory on the model by simply feeding in sewage data from New York into the model and observing the resulting rainfall patterns produced by the computer. If their hypothesis and the model were correct, then the fluctuations in the sewage would simply correlate with the rainfall and the prices of tea in China. They could then go out and collect real-world data to verify their results. If there is no correlation, the model could also help them discern where their theory breaks down. Though the atmospheric and oceanographic models NAO researchers use
can be much more complex than the one in this fictitious
illustration, the manner in which they test their theories is the same. Their
goal is to use the models to link the long-term decadal trends in the NAO to
ocean currents, ice flows, and whatever else may be influencing the climate
anomaly. As of now, they are still in the initial stages of the process. The
scientists are merely attempting to establish that a basic connection exists
between the NAO and the ocean. |
|||
For several years Mehta and his team used an atmospheric model to study this connection. They made a big breakthrough last year by establishing a crucial link between sea surface temperature and the decadal variations in the NAO. "If the NAO does interact with the sea, then the interaction would be primarily with the temperature at the surface," said Mehta. The model they used essentially takes in sea surface temperatures over the planet for a given year and then calculates a number of variables including temperature, pressure, and rainfall. With this information, Mehta says it isn’t too difficult to figure out the average monthly and yearly pressure readings for the two Atlantic winter pressure systems or the amount of rainfall over Europe and the United States. So far the Goddard team has published one set of results. As an input to the model, the researchers compiled records of monthly sea surface temperatures taken across the globe from the years 1949 to 1996. Weather stations as well as Navy vessels and commercial ships made these readings on their voyages. Mehta explained that the dates were chosen because both maritime traffic and efforts to record sea surface temperatures increased dramatically after World War II. On their own without any further modifications, this initial set of readings would at best return undependable values on air pressure and rainfall after being fed into the computer. "This is due to a manifestation of chaos. A small difference in initial conditions of the readings can make a big difference in the final results that emerge from the model," he said. To eliminate this chaos and obtain accurate values for the NAO, the Goddard team fed the sea surface temperature data into the model sixteen different times. Each time they put in these data, they used a different set of initial atmospheric conditions–those atmospheric values that the computer sees as the starting point for the model run (Mehta et al., 1999). After averaging each of the 48 years of pressure, temperature, and other readings that the sixteen computer model runs produced, the scientists found that the computer readout matched up nicely to historical records. From these results, Mehta then calculated the yearly averages of the NAO and the corresponding changes in rainfall and temperature. "On the whole our model was a success. We were able to simulate the NAO itself and it's impact on Europe and the Northeastern U.S.," says Mehta. "The only years that did not correspond to actual readings were from 1949 to 1959. We have yet to explain the discrepancy here." Mehta warns that his analysis cannot make predictions, but can only show the difference in rainfall and pressure in and around the Atlantic for the years when sea surface temperatures of the ocean are given. The real significance in these results is that they demonstrate that the low-frequency, long-term changes in the NAO can be attributed primarily to sea surface temperatures. "We would only be able to forecast the phenomenon if we first could predict specific global sea surface temperatures," said Mehta. But even now other teams in both Europe and the United States are working with other ocean models to link currents, sea ice, and even the NAO itself to sea surface temperatures. Their hope is that if they nail down all the variables influencing the NAO as well as it’s reciprocal effects on the ocean, they may be able to predict the sign the anomaly will take each year. Then they may even be able to determine what is causing the multidecadal global warming trend. "However, this will probably not happen right away. It will be some time before these models are built, and the interactions involved here are very complex," says Mehta. References
National Oceanic and Atmospheric Administration, 1999: North Atlantic Oscillation, Silver Spring, Maryland. World Climate Research Program, 1997: CLIVAR International Implementation Plan, Southampton, United Kingdom, D1. Links
|
 The above maps show the relationship between the North Atlantic Oscillation Index and sea level pressure. The observed data (top) show that when the NAO index is high, the atmospheric pressure over Greenland and Iceland is lower than normal, and the pressure west of the Iberian Peninsula (Spain and Portugal) is higher than normal. Model results based on global sea surface temperatures (bottom) show a similar pattern. (Images by Vikram Mehta, NASA Goddard Space Flight Center) |
|
|||
A new
version of Searching for Atlantic Rhythms was posted
on July 11, 2003. It includes new information about the causes
of the North Atlantic Oscillation. |
|||
Over the past fifteen years, our society has come to view the El
Niño/La Niña phenomenona less as a climate anomaly and more as an
invisible spirit that is responsible for nearly every weather-related
adversity out there. We blame it for our dead car batteries in January, for the high
price of oranges in the summer, and for those cold snaps that hit us in early
October. In their zeal to tap into and sell this belief, the public media have
fed us a long stream of stories on El Niño-related events. However,
they’ve ignored those other climate anomalies outside of the Pacific Basin
that drive the weather. Probably the biggest and most powerful of these climate
phenomena is the aptly named North Atlantic Oscillation (NAO). While the North
Atlantic Oscillation doesn't generate the catastrophic floods, climate changes,
and carnage associated with El Niño, its effects are much
more consistent and nearly as widespread. |
| ||
The NAO is the relationship between a high-pressure system over the Azores
Islands and a low-pressure system over Iceland. Both of these systems are
present on average year round. For most of the spring, summer, and fall these
systems remain weak and ineffectual. However, throughout the course of the
winter, the NAO comes alive as both the high and the low intensify and fluctuate
in pressure relative to one another, creating dramatic variations
over the Atlantic Ocean and the surrounding continents. When the pressure
difference between the two systems is large, they bring higher temperatures
to northern Europe, cause droughts in the Middle
East, and push up the mercury in the northeastern United States. When the
pressure difference between the two systems is small, they push wet weather
toward those countries surrounding the Mediterranean, send Scandinavia into a
deep freeze, and decrease the temperature along the East Coast. |
A strong North Atlantic Oscillation (large difference in pressure between the mid-latitude and tropical North Atlantic) tends to produce more severe weather in the North Atlantic, increased snowfall in Sweden (left), and an early spring in Washington, DC (right) [Photographs copyright Mark Schoeberl (left) & Barbara Summey (right)] | ||
Despite the lack of publicity the NAO receives, teams of scientists at NASA and other institutions around the world have been studying it for many decades. They found that, much like El Niño, the NAO varies in a rhythmic pattern from decade to decade. Ever since the 1960s, the difference in pressure between the Azores high and the Icelandic low has repeatedly grown on average for three to five years and then has waned and decreased on average for another three to five years. Though the researchers have not had much luck in predicting the anomaly's behavior, many believe that its multi-year variations may be linked to currents in the sea or the formation of sea ice. Their hope is that by studying the NAO and building models mimicking its behavior, they may someday understand what drives these variations. From there they may even be able to predict its behavior. |
Typical weather caused by a negative NAO (small pressure difference between the mid-latitude and tropical North Atlantic) is fewer storms overall, clear skies over the Normandy coast of France (left,) and rain in Spain (right). (Photographs copyright Eric Simmon) | ||
|
|||
A new
version of Searching for Atlantic Rhythms was posted
on July 11, 2003. It includes new information about the causes
of the North Atlantic Oscillation. |
|||
Over the past fifteen years, our society has come to view the El
Niño/La Niña phenomenona less as a climate anomaly and more as an
invisible spirit that is responsible for nearly every weather-related
adversity out there. We blame it for our dead car batteries in January, for the high
price of oranges in the summer, and for those cold snaps that hit us in early
October. In their zeal to tap into and sell this belief, the public media have
fed us a long stream of stories on El Niño-related events. However,
they’ve ignored those other climate anomalies outside of the Pacific Basin
that drive the weather. Probably the biggest and most powerful of these climate
phenomena is the aptly named North Atlantic Oscillation (NAO). While the North
Atlantic Oscillation doesn't generate the catastrophic floods, climate changes,
and carnage associated with El Niño, its effects are much
more consistent and nearly as widespread. |
| ||
The NAO is the relationship between a high-pressure system over the Azores
Islands and a low-pressure system over Iceland. Both of these systems are
present on average year round. For most of the spring, summer, and fall these
systems remain weak and ineffectual. However, throughout the course of the
winter, the NAO comes alive as both the high and the low intensify and fluctuate
in pressure relative to one another, creating dramatic variations
over the Atlantic Ocean and the surrounding continents. When the pressure
difference between the two systems is large, they bring higher temperatures
to northern Europe, cause droughts in the Middle
East, and push up the mercury in the northeastern United States. When the
pressure difference between the two systems is small, they push wet weather
toward those countries surrounding the Mediterranean, send Scandinavia into a
deep freeze, and decrease the temperature along the East Coast. |
A strong North Atlantic Oscillation (large difference in pressure between the mid-latitude and tropical North Atlantic) tends to produce more severe weather in the North Atlantic, increased snowfall in Sweden (left), and an early spring in Washington, DC (right) [Photographs copyright Mark Schoeberl (left) & Barbara Summey (right)] | ||
Despite the lack of publicity the NAO receives, teams of scientists at NASA and other institutions around the world have been studying it for many decades. They found that, much like El Niño, the NAO varies in a rhythmic pattern from decade to decade. Ever since the 1960s, the difference in pressure between the Azores high and the Icelandic low has repeatedly grown on average for three to five years and then has waned and decreased on average for another three to five years. Though the researchers have not had much luck in predicting the anomaly's behavior, many believe that its multi-year variations may be linked to currents in the sea or the formation of sea ice. Their hope is that by studying the NAO and building models mimicking its behavior, they may someday understand what drives these variations. From there they may even be able to predict its behavior.
The data used in this study are available in one or more of NASA's Earth Science Data Centers. |
Typical weather caused by a negative NAO (small pressure difference between the mid-latitude and tropical North Atlantic) is fewer storms overall, clear skies over the Normandy coast of France (left,) and rain in Spain (right). (Photographs copyright Eric Simmon) | ||
| Air is pushed away from a high pressure system. The winds rotate clockwise (in the Northern Hemisphere, counter-clockwise in the Southern Hemisphere) and away from the system's center. (Animation by Robert Simmon) |
| A low pressure system will pull in air from the surrounding area. Winds around a low spiral counter-clockwise (in the Northern Hemisphere, clockwise in the Southern Hemisphere) and upwards towards the center of the system. (Animation by Robert Simmon) |
|
Subscribe to the Earth Observatory About the Earth Observatory Contact Us Privacy Policy and Important Notices Responsible NASA Official: Lorraine A. Remer Webmaster: Goran Halusa We're a part of the Science Mission Directorate |