|
Strategic
Plan for the
Climate Change
Science Program
Final Report, July 2003
|
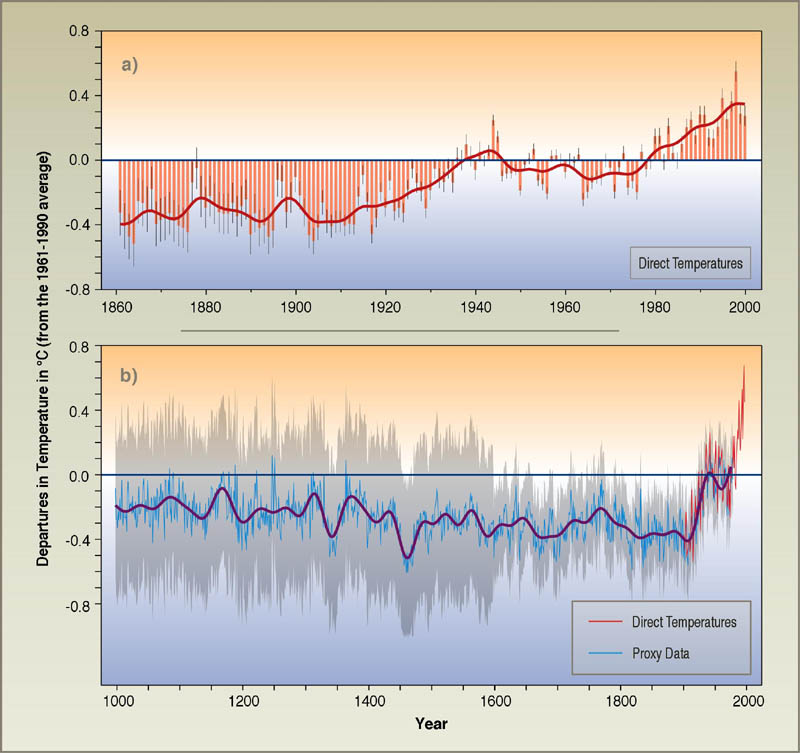
Figure 4-1
from Annex C
(Graphics and Photography Source Information)
Figure 4-1: The Earth's surface temperature has increased by about
0.6�C over the record of direct temperature measurements (1860-2000, top
panel) -- a rise that is unprecedented, at least based on proxy temperature
data for the Northern Hemisphere, over the last millennium (bottom panel).
In the top panel the global mean surface temperature is shown year-by-year
(red bars with very likely ranges as thin black line) and
approximately decade-by-decade (continuous red line). Analyses take into
account data gaps, random instrumental errors and uncertainties,
uncertainties in bias corrections in the ocean surface temperature data,
and also uncertainties in adjustments for urbanization over the land. The
lower panel merges proxy data (year-by-year blue line with very likely
ranges as gray band, 50-year-average purple line) and the direct
temperature measurements (red line) for the Northern Hemisphere. The proxy
data consist of tree rings, corals, ice cores, and historical records that
have been calibrated against thermometer data. Insufficient data are
available to assess such changes in the Southern Hemisphere. Source:
IPCC (2001d).
| US Climate
Change Science Program, Suite 250, 1717 Pennsylvania Ave, NW, Washington,
DC 20006. Tel: +1 202 223 6262. Fax: +1 202 223 3065. Email: .
Web: www.climatescience.gov.
Webmaster: |
|
|